Managing performance without clear visibility often leads to missed targets, delayed actions, and unclear accountability. The Performance Management KPI Dashboard in Excel solves this problem by converting raw performance data into a clean, visual, and decision-ready dashboard.
This ready-to-use Excel dashboard is designed for organizations that want clarity, control, and consistency in performance tracking—without relying on expensive BI tools. With structured sheets, automated calculations, and intuitive visuals, this dashboard helps you monitor MTD, YTD, Target vs Actual, and Previous Year performance with ease.
Whether you are tracking departmental KPIs, business objectives, or operational metrics, this Excel-based solution gives you a single source of truth for performance management.
## 🚀 Key Features of Performance Management KPI Dashboard in Excel
📊 Centralized KPI Tracking – Track all performance KPIs in one structured dashboard
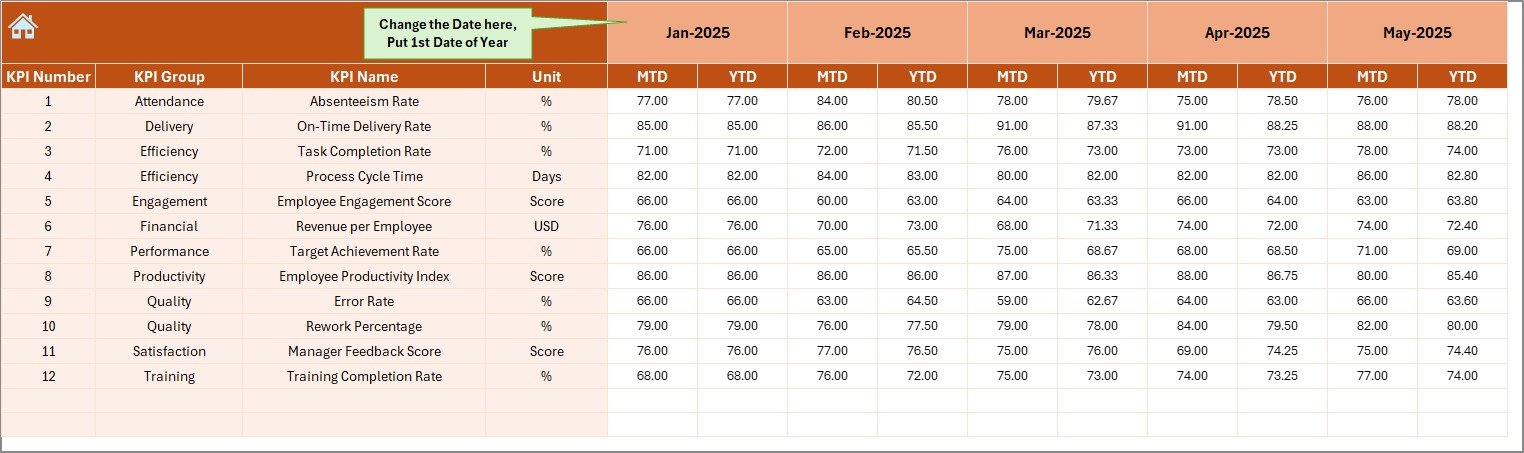
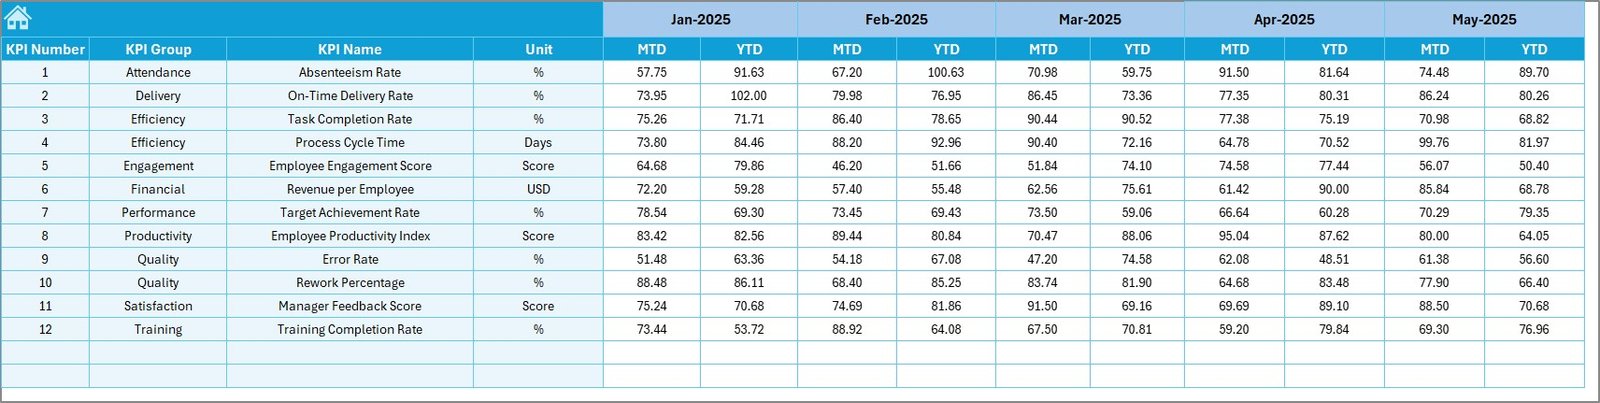
📈 MTD & YTD Analysis – Instantly compare Month-to-Date and Year-to-Date performance
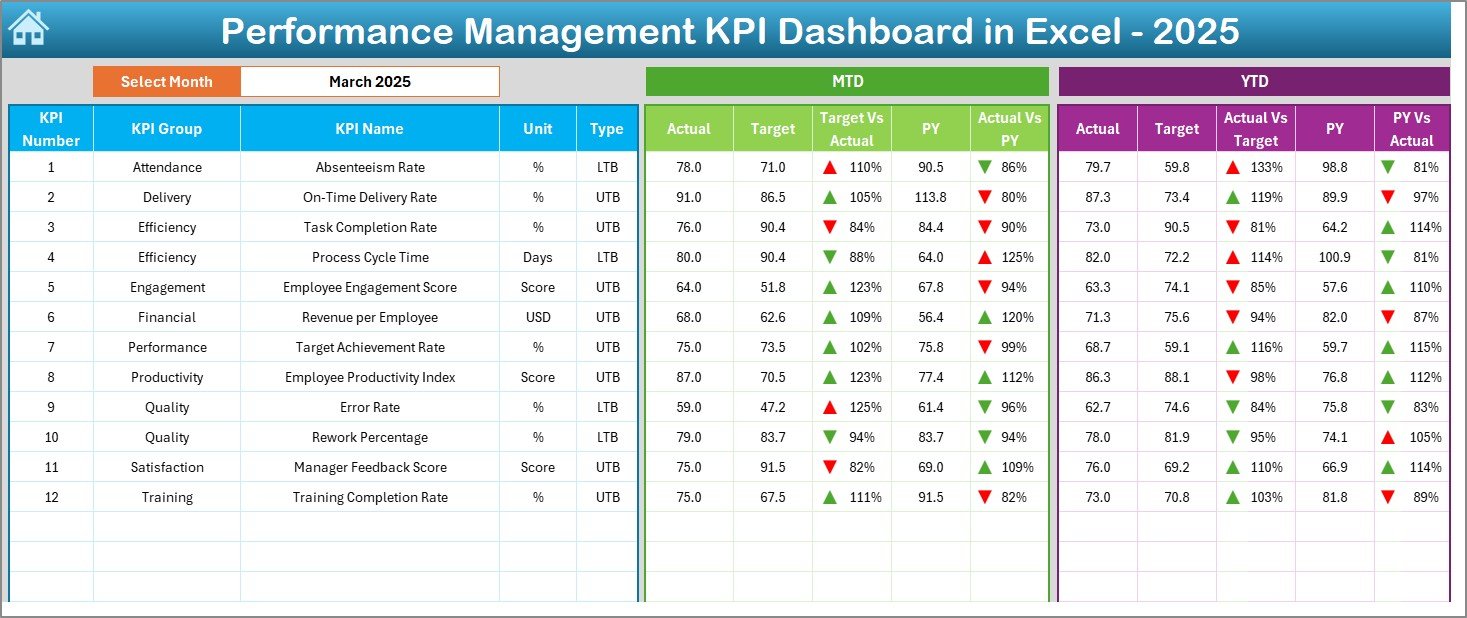
🎯 Target vs Actual Comparison – Clearly see performance gaps using arrows and colors
📅 Month Selector – Change months using a simple drop-down and refresh the dashboard
📉 Trend Analysis – Visual KPI trends to identify growth, decline, or stagnation
🟢 Conditional Formatting – Up/down arrows and color indicators for quick insights
📁 Structured Worksheets – Clean separation of input, logic, and visualization
🧠 Beginner-Friendly Excel Design – No macros, no coding, easy to maintain
## 📦 What’s Inside the Performance Management KPI Dashboard in Excel
This professionally designed Excel dashboard includes the following worksheets:
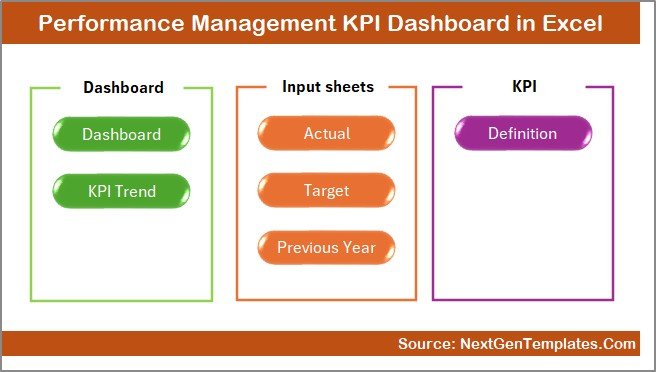
📌 Summary Page – Navigation hub with buttons to access all sheets
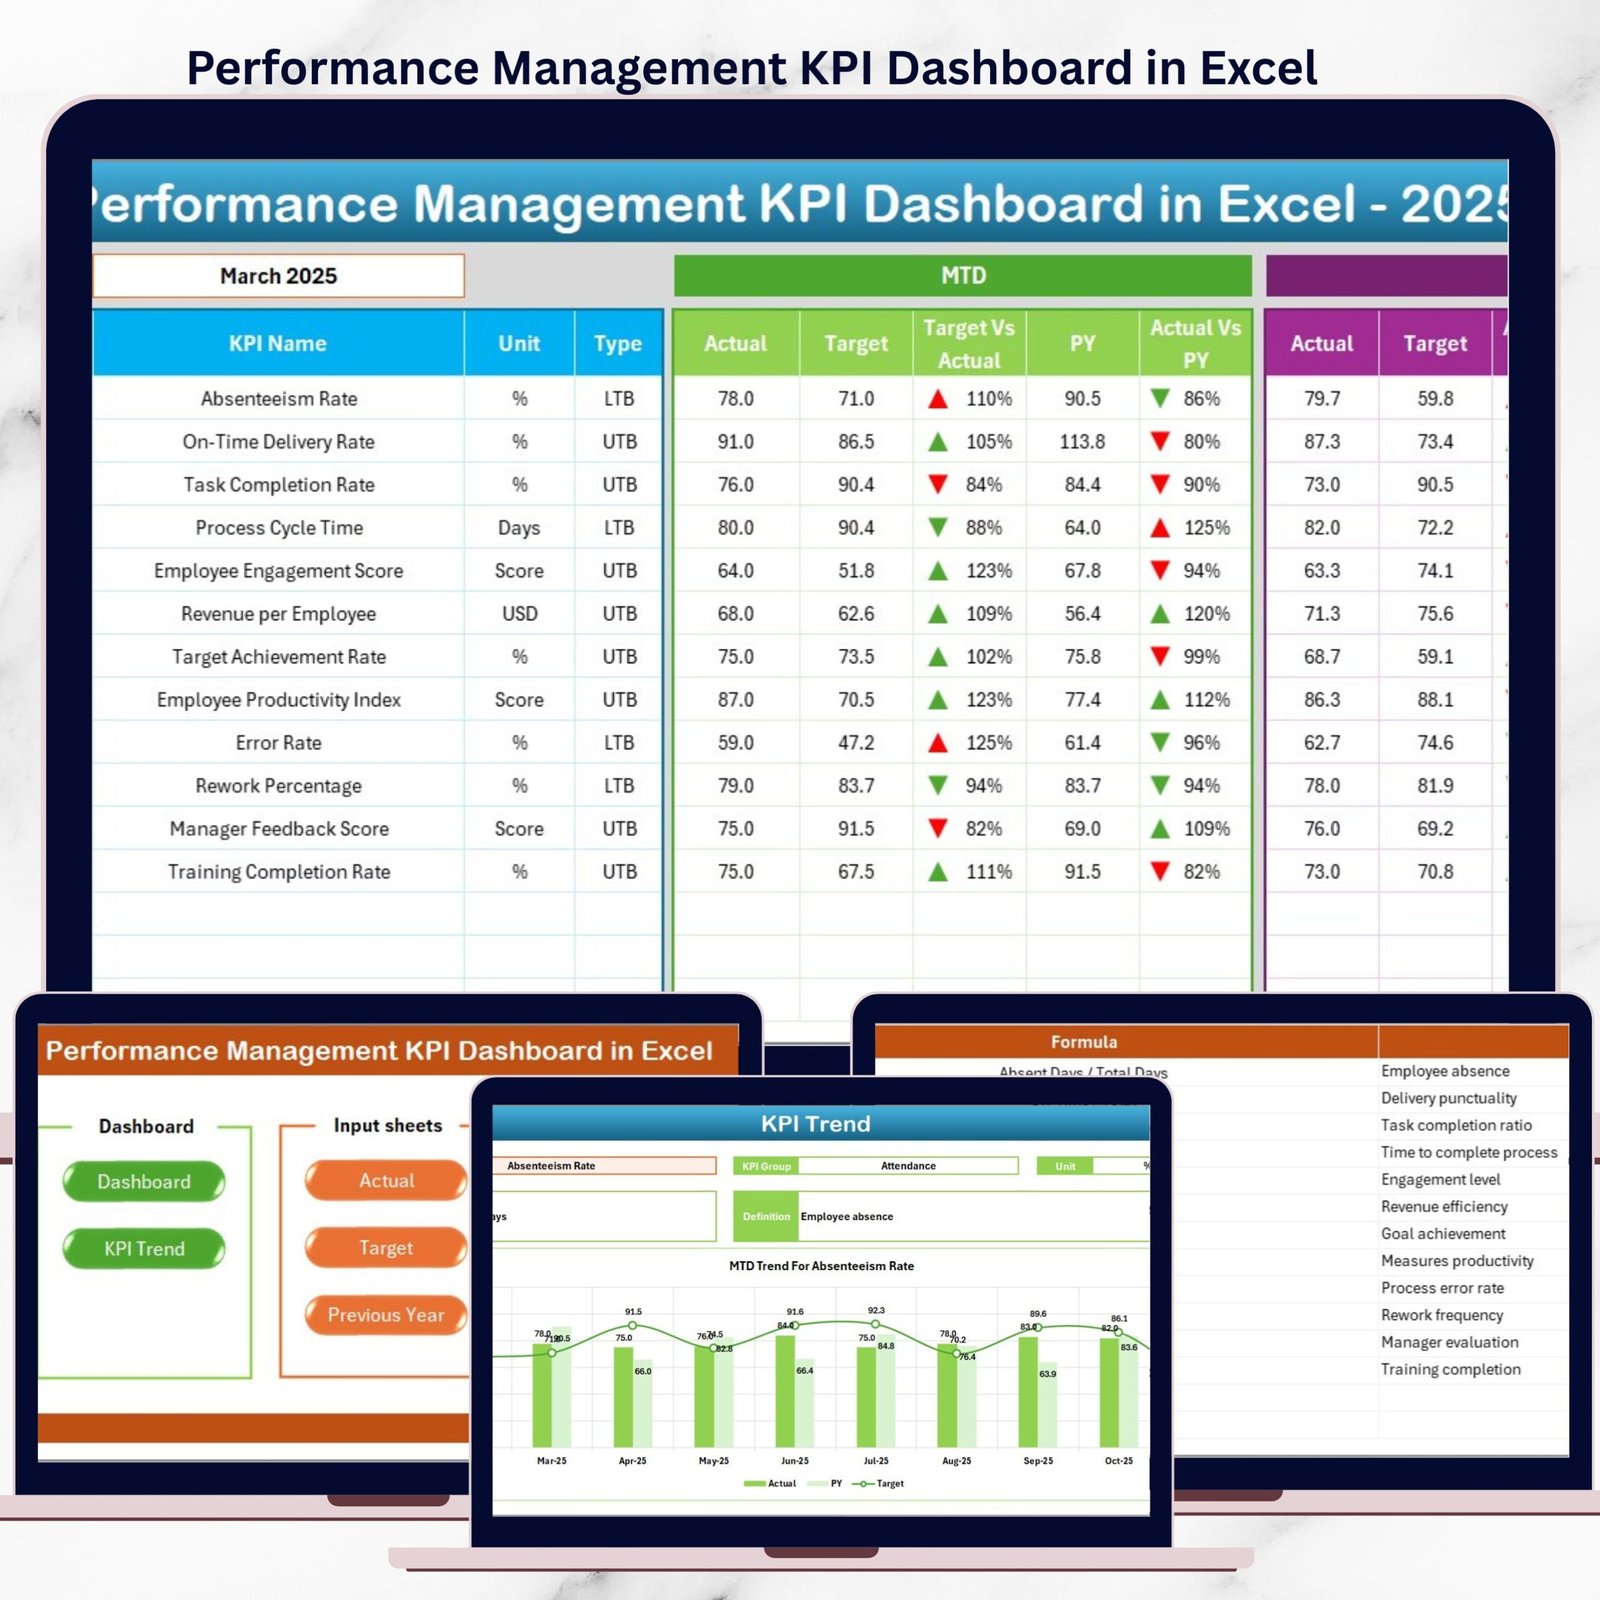
📌 Dashboard Sheet – Main KPI overview with MTD, YTD, Target, and PY comparisons
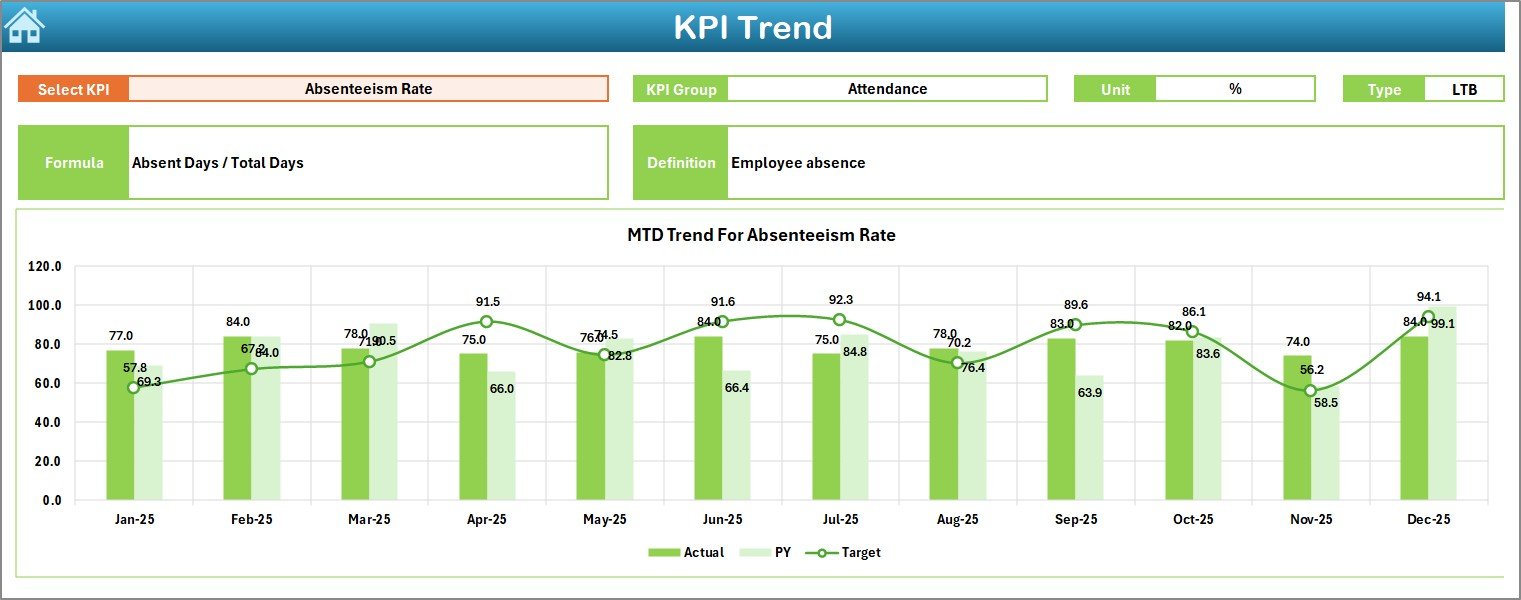
📌 KPI Trend Sheet – Detailed KPI-wise trend analysis with charts
📌 Actual Numbers Input Sheet – Simple entry for current year actual data
📌 Target Sheet – Centralized location to define KPI targets
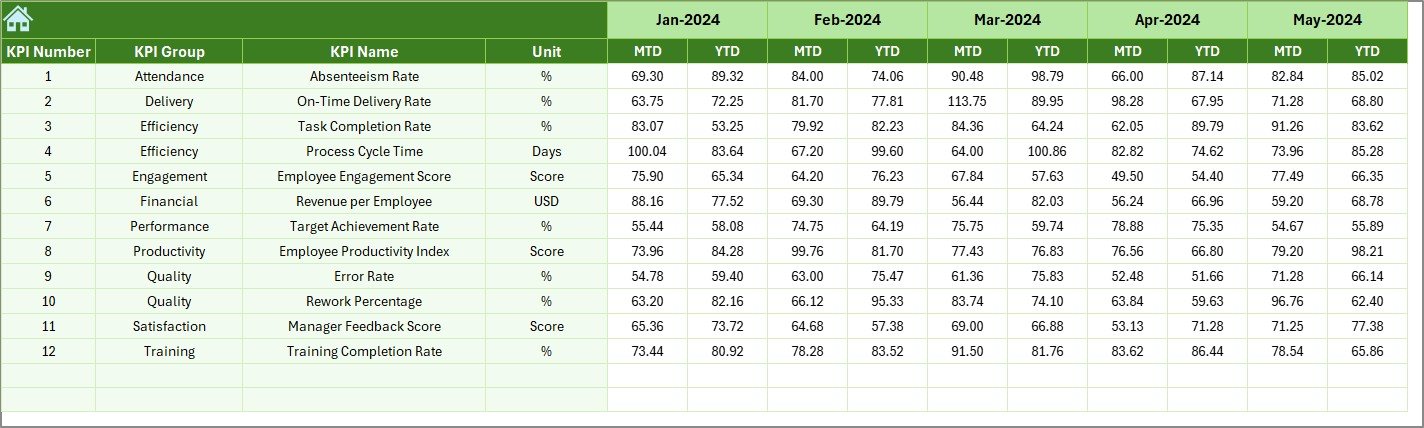
📌 Previous Year Sheet – Enables year-over-year performance comparison
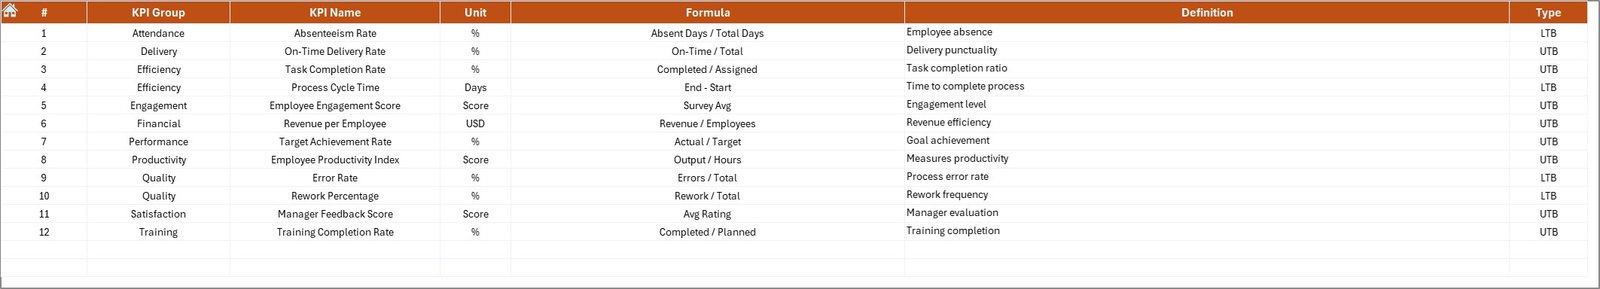
📌 KPI Definition Sheet – Stores KPI name, group, unit, formula, definition, and type (LTB/UTB)
Each sheet is logically designed to ensure accuracy, consistency, and scalability.
## 🛠️ How to Use the Performance Management KPI Dashboard in Excel
Using this dashboard is simple and intuitive:
1️⃣ Enter KPI definitions in the KPI Definition Sheet
2️⃣ Update Actual, Target, and Previous Year values in their respective sheets
3️⃣ Select the month from the drop-down in the Dashboard
4️⃣ Instantly view MTD, YTD, variances, and trends
5️⃣ Use the KPI Trend sheet for deeper performance analysis
No advanced Excel skills are required. Just enter data and analyze results.
## 👥 Who Can Benefit from This Performance Management KPI Dashboard in Excel
This dashboard is ideal for:
🏢 Business Owners & Founders – Monitor business performance clearly
📊 Department Heads – Track departmental KPIs and accountability
📋 Operations Managers – Identify bottlenecks and performance gaps
👥 HR & Finance Teams – Support reviews and planning with data
📈 Strategy & Planning Teams – Drive goal-oriented performance discussions
🏭 Small to Medium Enterprises – Get BI-level insights using Excel
The dashboard is industry-agnostic and fully customizable.
Click here to read the detailed blog post
Watch the step-by-step video tutorial:


Reviews
There are no reviews yet.