
Industrial manufacturing operates in a world where production efficiency, quality standards, cost control, safety, and delivery timelines must stay perfectly aligned. However, many manufacturing teams still depend on manual spreadsheets and disconnected reports, which reduces visibility and slows decision-making.
The Industrial Manufacturing KPI Dashboard in Google Sheets is a ready-to-use, structured performance management solution designed to track critical manufacturing KPIs at both month-to-date (MTD) and year-to-date (YTD) levels.
Built entirely in Google Sheets, this dashboard combines KPI definitions, actual performance, targets, and previous-year comparisons into one centralized system—helping manufacturing leaders move from reactive firefighting to proactive, data-driven control.
🚀 Key Features of Industrial Manufacturing KPI Dashboard in Google Sheets
📊 Centralized Manufacturing KPI Monitoring
Track production, quality, cost, delivery, efficiency, and safety KPIs in one place.
📅 MTD & YTD Performance Tracking
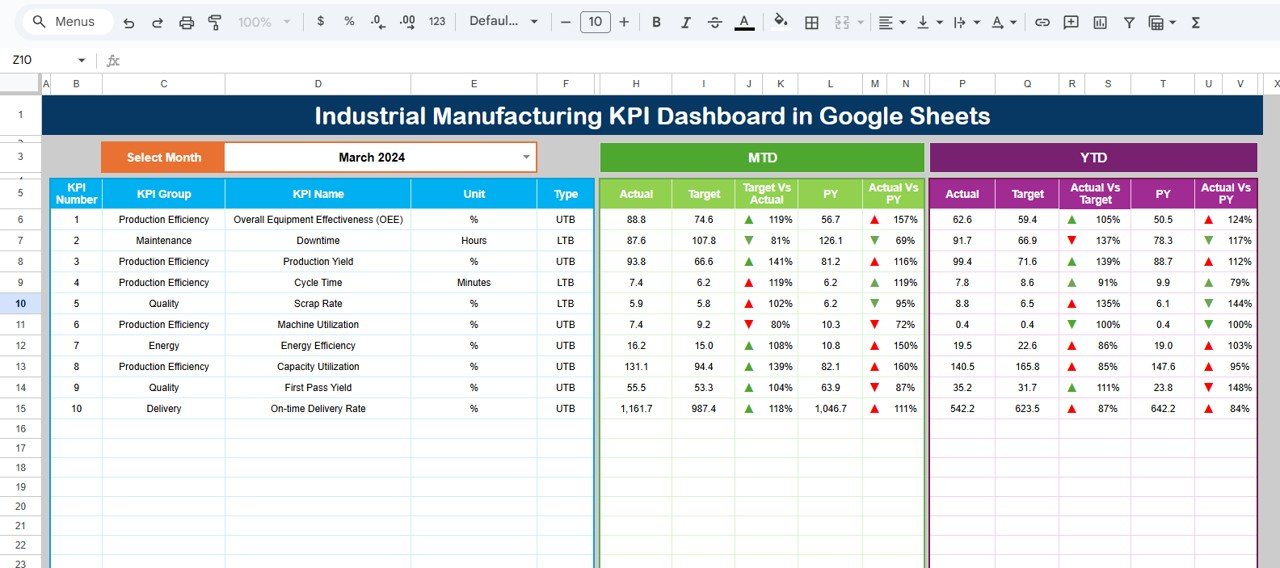
Monitor month-to-date and year-to-date performance side by side.
🎯 Target vs Actual Comparison
Instantly identify performance gaps using clear variance indicators.
📈 Previous Year Benchmarking
Compare current results with last year to measure real improvement.
🔺🔻 Visual Performance Indicators
Up and down arrows highlight KPI achievement or underperformance.
🧩 Clear KPI Definitions & Logic
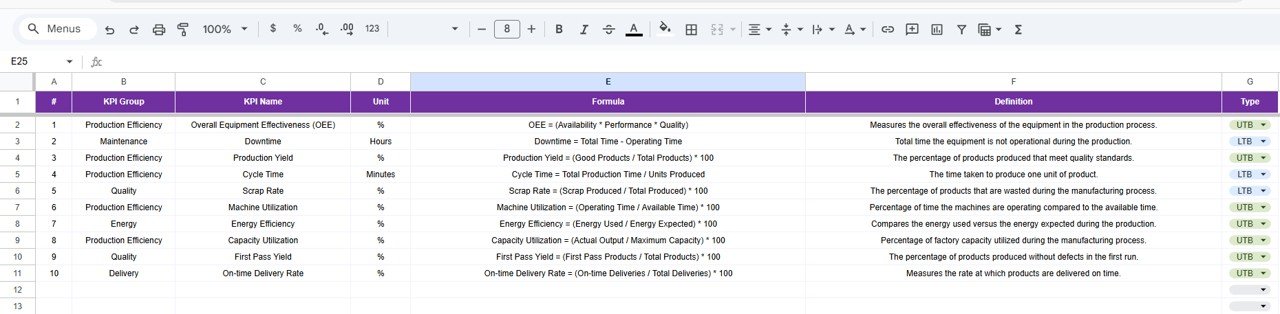
Each KPI includes unit, formula, definition, and type (UTB / LTB).
☁️ Google Sheets Collaboration
Access and update KPIs in real time from anywhere.
🔧 Highly Structured & Customizable
Easily add new KPIs or modify existing ones without breaking logic.
📦 What’s Inside the Industrial Manufacturing KPI Dashboard
📁 Dashboard Sheet
The main performance review screen, showing:
-
Month selector (cell D3)
-
MTD Actual, Target, Previous Year
-
YTD Actual, Target, Previous Year
-
Target vs Actual (MTD & YTD)
-
PY vs Actual (MTD & YTD)
-
Conditional formatting with arrows
This sheet provides instant visibility for leadership reviews.
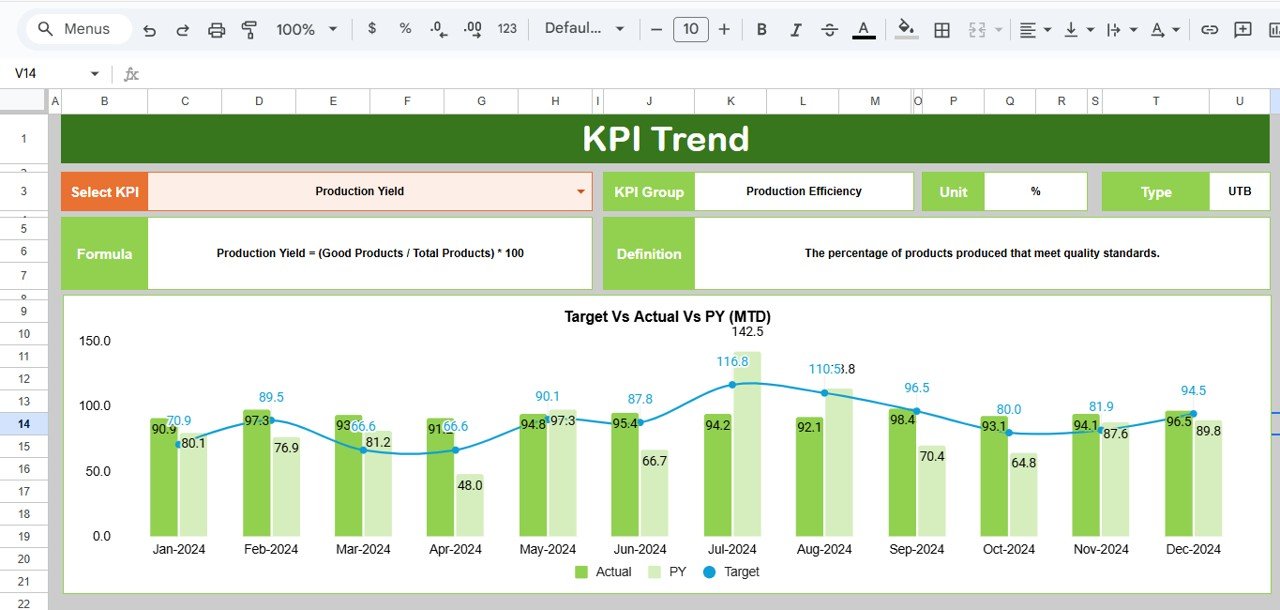
📁 KPI Trend Sheet
Deep-dive analysis for a selected KPI, including:
-
KPI Group
-
Unit of Measurement
-
KPI Type (UTB / LTB)
-
KPI Formula
-
KPI Definition
-
Performance trend context
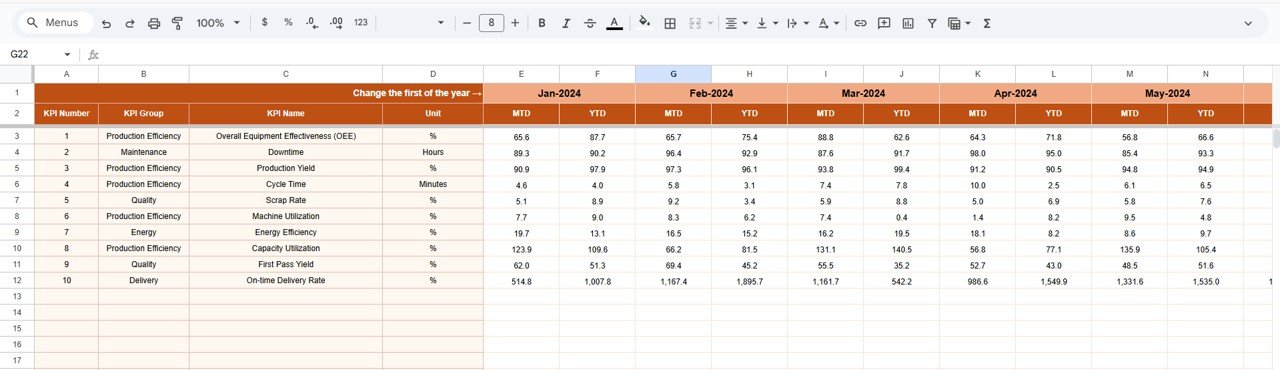
📁 Actual Number Sheet
Simple data entry sheet for:
-
MTD Actual values
-
YTD Actual values
-
Monthly selection (cell E1)
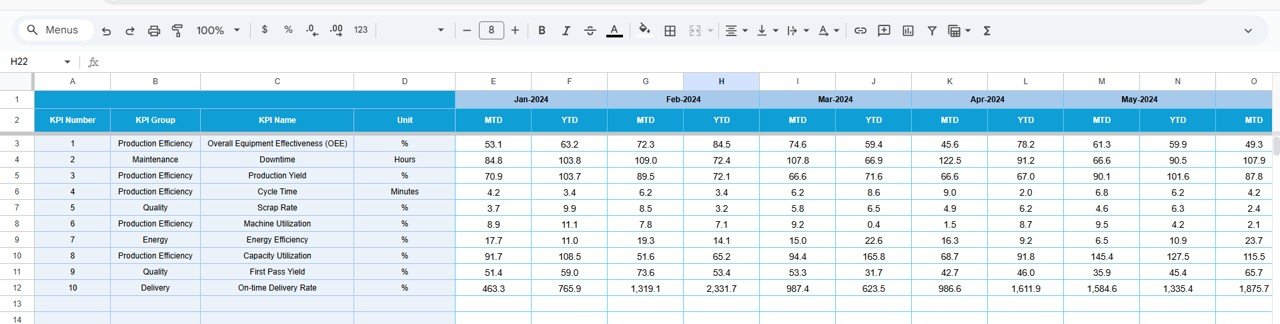
📁 Target Sheet
Defines expected performance:
-
MTD target values
-
YTD target values
-
KPI-wise structured layout
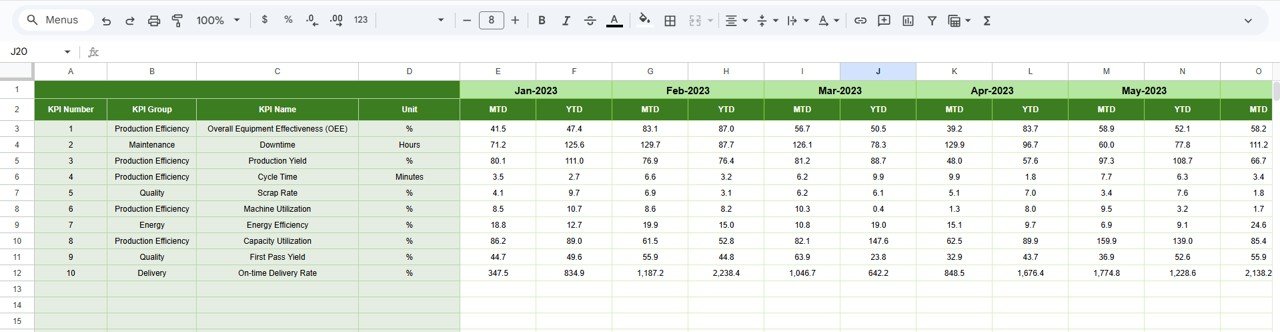
📁 Previous Year Number Sheet
Historical comparison sheet with:
-
PY MTD values
-
PY YTD values
-
Same structure as current year
📁 KPI Definition Sheet
The backbone of the dashboard, storing:
-
KPI Name
-
KPI Group
-
Unit
-
Formula
-
KPI Definition
-
KPI Type (Lower / Upper the Better)
🛠️ How to Use the Industrial Manufacturing KPI Dashboard
1️⃣ Define KPIs clearly in the KPI Definition sheet
2️⃣ Enter monthly actual values in the Actual Number sheet
3️⃣ Maintain targets in the Target sheet
4️⃣ Update previous year values once
5️⃣ Select the reporting month on the Dashboard
6️⃣ Review MTD & YTD performance instantly
7️⃣ Focus on KPIs with negative trends
No complex formulas. No manual calculations. Just structured input and instant insights.
👥 Who Can Benefit from This Manufacturing KPI Dashboard
🏭 Plant Managers – Monitor operational performance clearly
📊 Production Heads – Track output and efficiency
⚙️ Operations Managers – Control cost, quality, and delivery KPIs
🧪 Quality & Safety Teams – Monitor compliance metrics
📈 Manufacturing Analysts – Analyze trends and variances
🏗️ Industrial Engineers – Improve process performance
If you track manufacturing KPIs, this dashboard is built for you.
📘 Click here to read the Detailed blog post
Watch the step-by-step video tutorial:


Reviews
There are no reviews yet.