Managing credit risk is no longer just about tracking ratings—it is about understanding exposure, default probability, debt concentration, and revenue impact in real time. However, when credit data is spread across multiple spreadsheets and static reports, insights arrive late and decisions become reactive.
The Credit Rating Agencies Dashboard in Excel is a ready-to-use, professionally designed Excel dashboard that converts complex credit data into clear KPIs, interactive charts, and actionable insights—all in one place.
Instead of spending hours compiling reports, this dashboard helps finance and risk teams monitor credit ratings, exposure trends, and default risks instantly using Excel’s native pivot tables and slicers. It is powerful, flexible, and easy to use—without expensive BI tools.
🚀 Key Features of Credit Rating Agencies Dashboard in Excel
📌 Centralized Credit Risk Monitoring
Track ratings, exposure, probability of default, debt, and revenue from a single dashboard.
📊 Interactive Pivot Charts & KPI Cards
All visuals update instantly when slicers or data change.
🧭 Built-In Page Navigator
Move seamlessly across dashboard pages using the left-side navigator.
🎯 Dynamic Slicers
Filter data by agency, industry, country, and month in real time.
📈 Multi-Dimensional Credit Analysis
Analyze credit risk by agency, industry, geography, and time period.
⚙️ 100% Excel-Based Solution
No Power BI, no add-ins—just Excel pivot tables and charts.
🎨 Professional & Executive-Ready Design
Clean layout suitable for management reviews and risk meetings.
📦 What’s Inside the Credit Rating Agencies Dashboard in Excel
📁 Data Sheet
A structured table that stores credit data such as rating, rating change, exposure amount, probability of default, debt, revenue, agency, industry, country, and month.
📁 Support Sheet
Handles backend calculations, mappings, and helper logic for smooth dashboard performance.
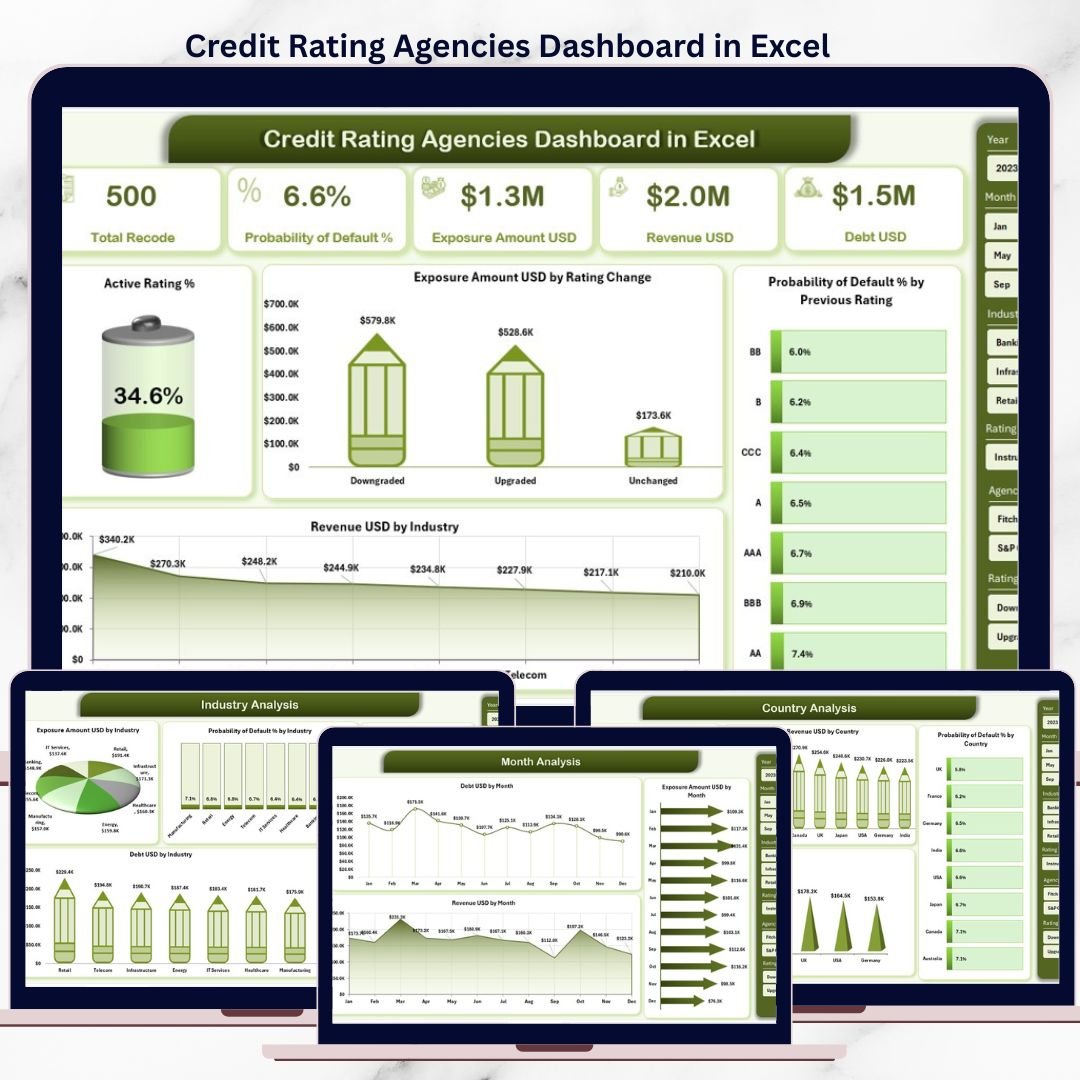
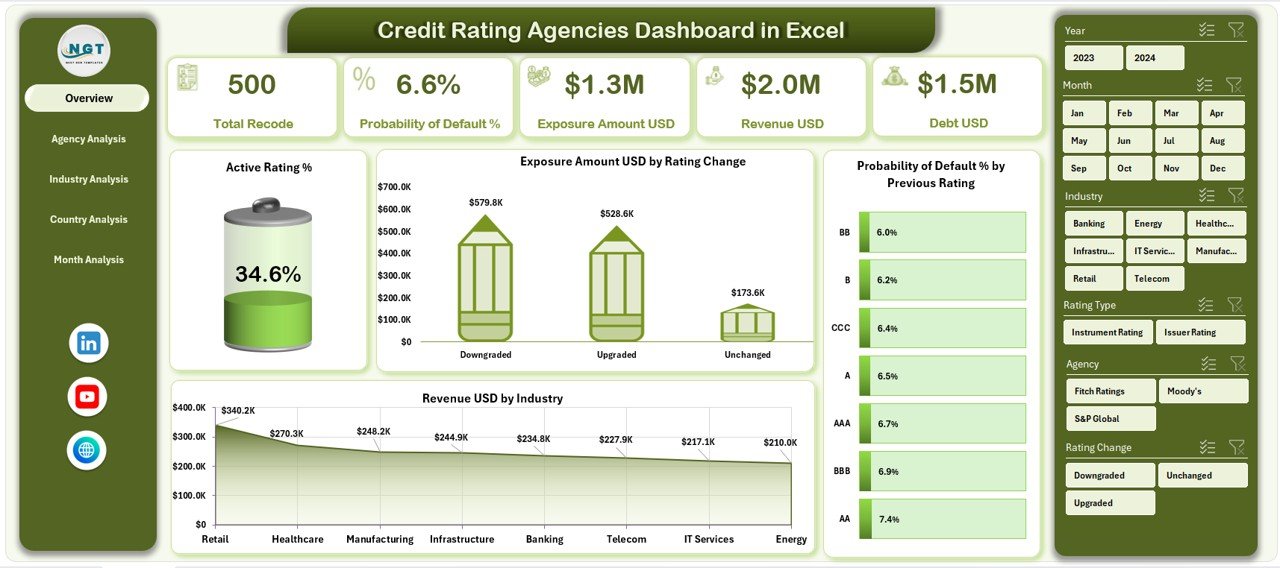
📁 Overview Page
High-level snapshot of credit performance with:
-
KPI cards
-
Active Rating %
-
Exposure by Rating Change
-
Probability of Default by Previous Rating
-
Revenue by Industry
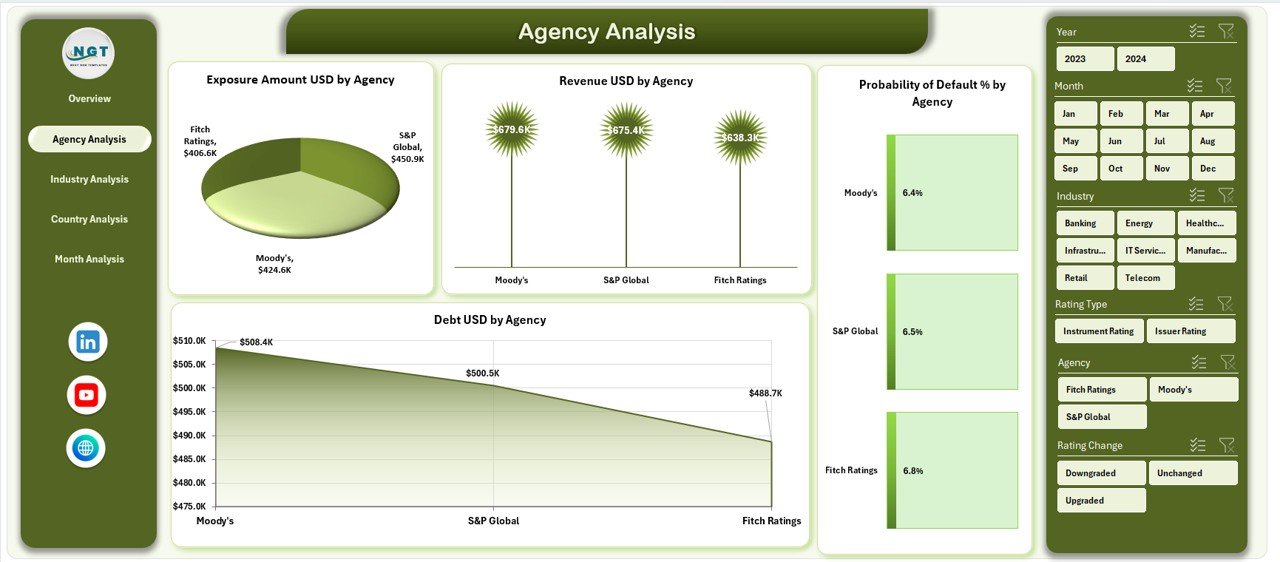
📁 Agency Analysis Page
Compare exposure, revenue, probability of default, and debt across rating agencies.
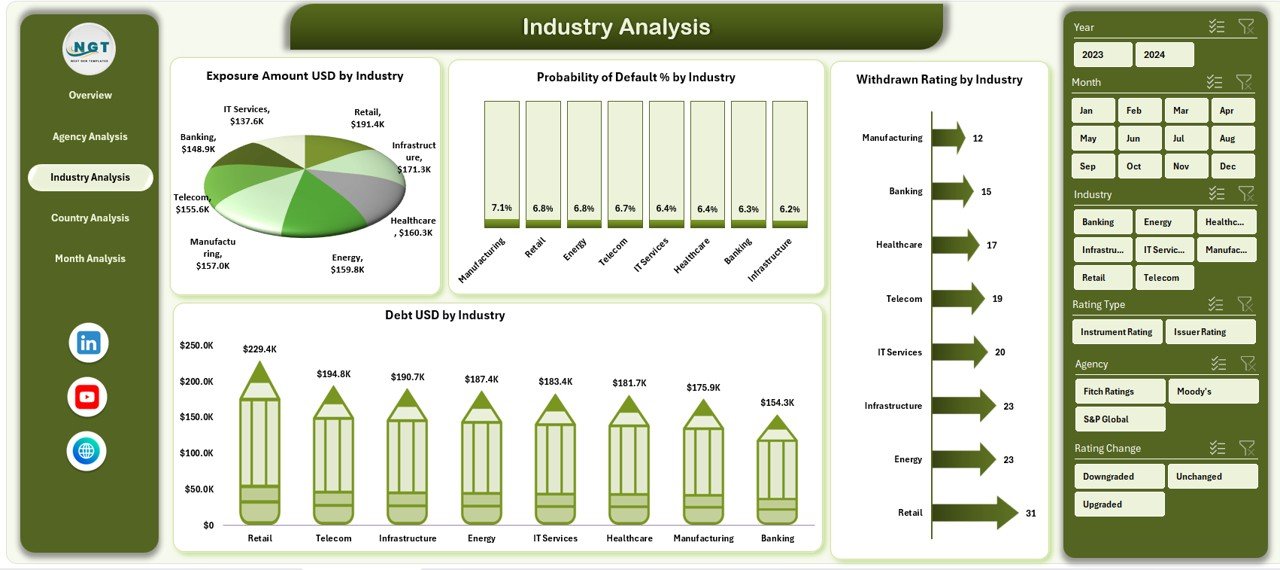
📁 Industry Analysis Page
Evaluate industry-wise exposure, default risk, debt levels, and withdrawn ratings.
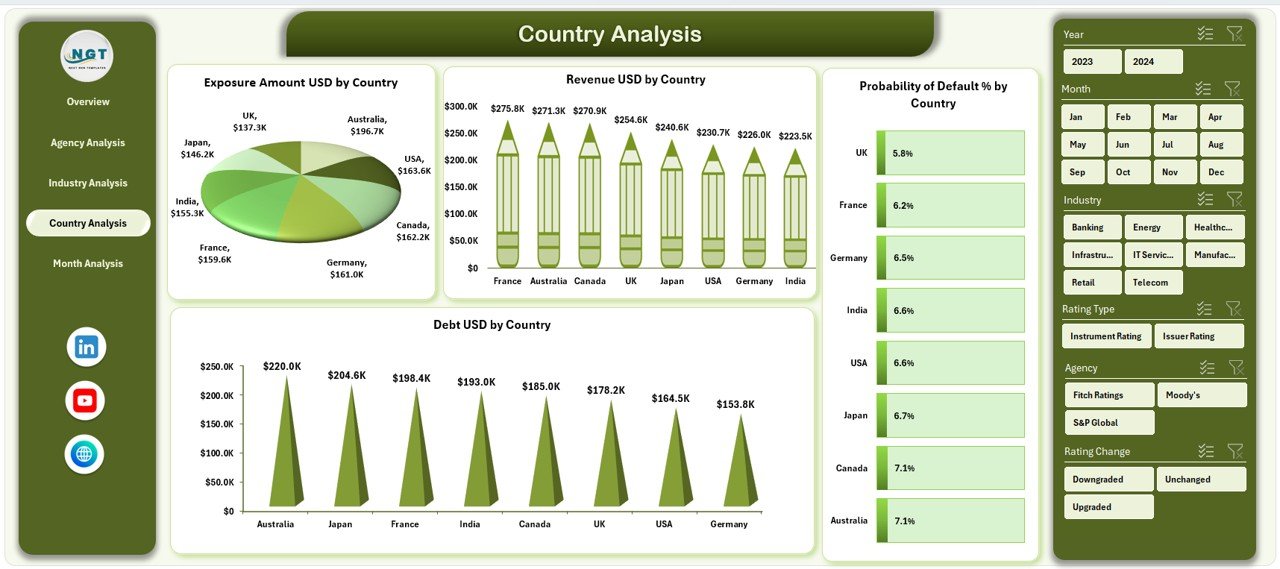
📁 Country Analysis Page
Assess geographic credit exposure, debt, revenue, and default risk.
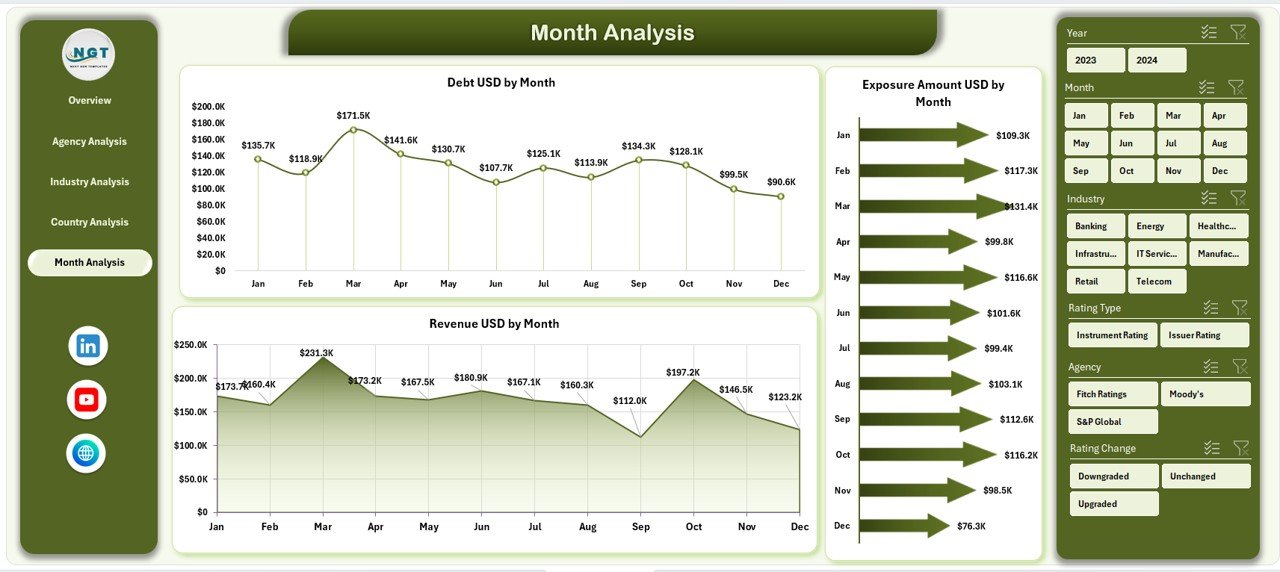
📁 Month Analysis Page
Track exposure, debt, and revenue trends over time.
📁 Page Navigator Panel
Quick navigation across all analytical pages.
🛠️ How to Use the Credit Rating Agencies Dashboard in Excel
1️⃣ Enter or paste credit data into the Data Sheet
2️⃣ Refresh pivot tables with one click
3️⃣ Use slicers to filter by agency, industry, country, or month
4️⃣ Navigate pages using the Page Navigator
5️⃣ Review KPIs, trends, and risk insights instantly
6️⃣ Customize charts or metrics as required
No advanced Excel skills required—the dashboard is built for everyday finance users.
👥 Who Can Benefit from This Credit Rating Agencies Dashboard
🏦 Credit Risk Analysts – Monitor exposure and default risk
📊 Financial Institutions – Improve portfolio risk visibility
📈 Investment Firms – Compare revenue versus credit risk
⚠️ Risk Management Teams – Identify high-risk agencies and sectors
💼 Corporate Finance Teams – Support strategic credit decisions
📉 Portfolio Managers – Track concentration and trend risks
If your work involves credit evaluation, this dashboard is made for you.
📘 Click here to read the Detailed blog post
🎥 Visit our YouTube channel to learn step-by-step video tutorials
👉 Youtube.com/@PKAnExcelExpert


Reviews
There are no reviews yet.