


Smart cities generate massive amounts of data every day—from infrastructure performance to sustainability metrics and citizen services. However, when this data lives in disconnected reports or manual spreadsheets, leaders struggle to identify trends, track progress, and make timely decisions.
That is exactly where the Smart Cities KPI Scorecard in Excel becomes a powerful performance management solution 📊✨.
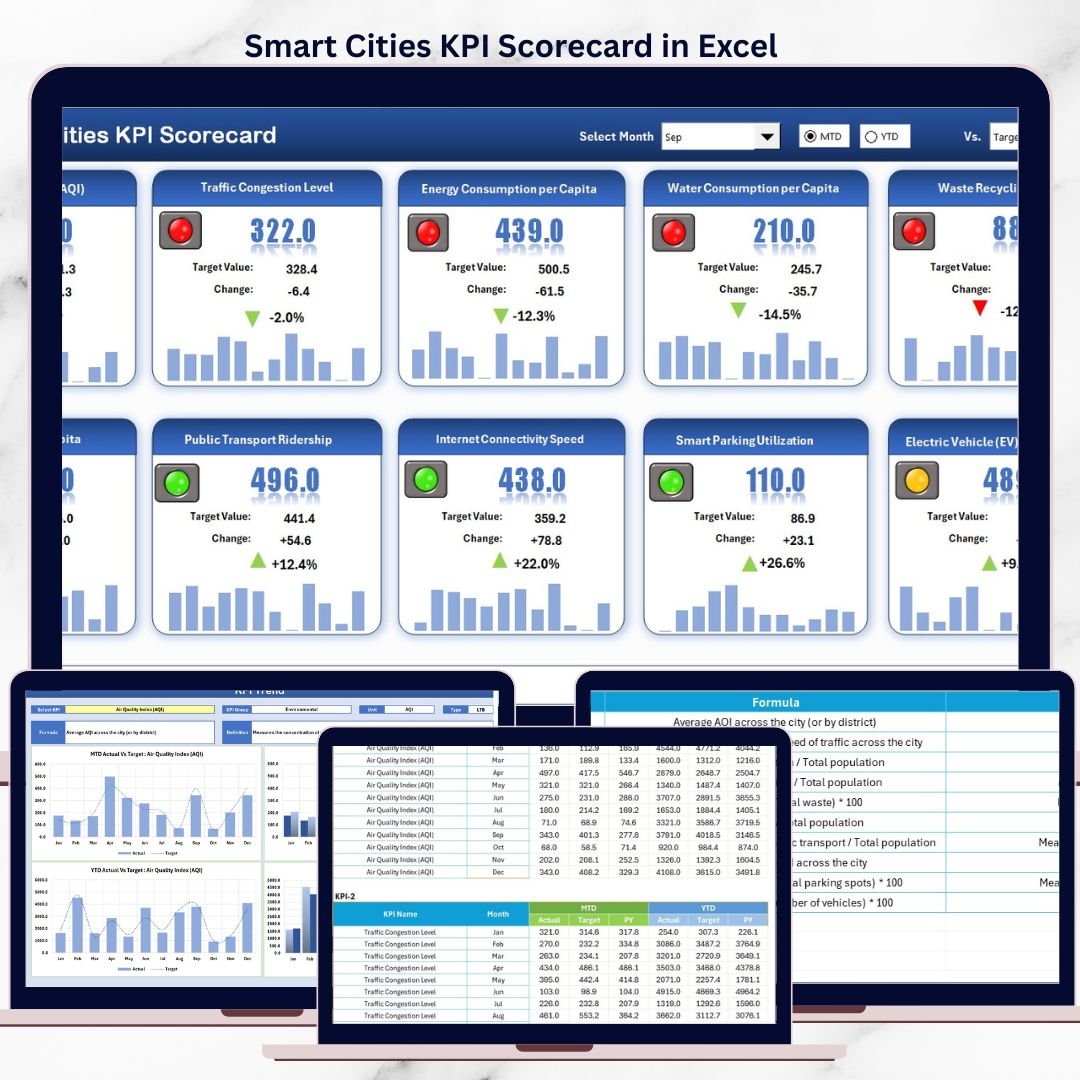
This ready-to-use Excel scorecard helps governments, urban planners, and administrators track, analyze, and visualize smart city KPIs in one centralized, easy-to-use file—without relying on complex BI tools or IT teams.
🚀 Key Features of Smart Cities KPI Scorecard in Excel
This scorecard is designed to deliver clarity, accountability, and actionable insights.
✅ Centralized smart city KPI tracking in one dashboard
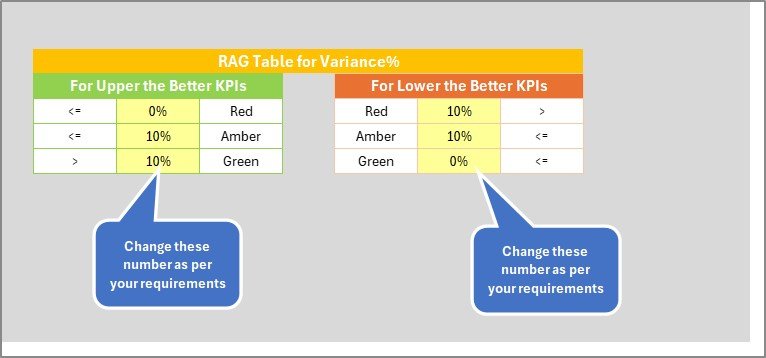
✅ Actual vs Target comparison for every KPI
✅ MTD and YTD analysis for performance monitoring
✅ Interactive dropdown selections for dynamic analysis
✅ Trend charts for historical and performance tracking
✅ KPI categorization by groups, units, and types
✅ Dedicated KPI definition sheet for standardization
✅ Fully customizable Excel-based design
These features help city leaders move from raw data to informed action.
📦 What’s Inside the Smart Cities KPI Scorecard in Excel
This product includes four professionally structured worksheets, each serving a specific analytical purpose.
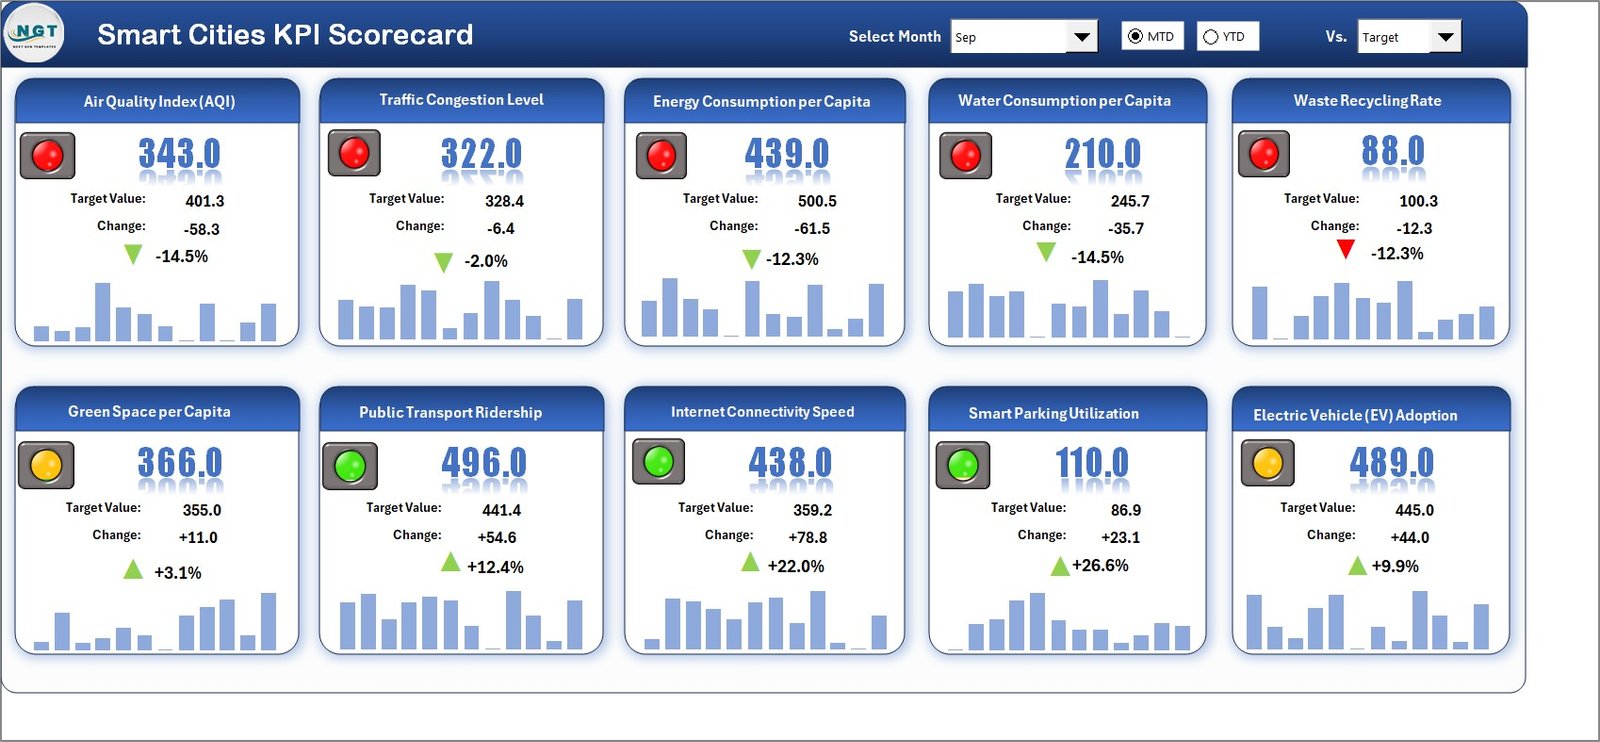
📊 Scorecard Sheet
The main dashboard that summarizes all KPIs in one view. It displays KPI names, groups, actuals, targets, MTD values, and YTD values with clear visual indicators.
📈 KPI Trend Sheet
Allows deep analysis of individual KPIs. Select a KPI from a dropdown, and the sheet updates automatically to show definitions, formulas, and trend charts for Actual, Target, and Previous Year values.
🧾 Input Data Sheet
Acts as the data entry layer where users enter actual values, targets, and supporting data. All calculations and visuals update automatically.
📘 KPI Definition Sheet
Ensures clarity and consistency by documenting KPI names, groups, units, formulas, and definitions—eliminating confusion across departments.
Together, these sheets form a complete smart city KPI monitoring system.
🛠️ How to Use the Smart Cities KPI Scorecard in Excel
Using this scorecard is simple and intuitive:
1️⃣ Enter KPI data and targets in the Input Data Sheet
2️⃣ Define and standardize KPIs using the KPI Definition Sheet
3️⃣ Select Month, MTD, or YTD from dropdowns
4️⃣ Review overall performance on the Scorecard Sheet
5️⃣ Analyze individual KPI trends using the KPI Trend Sheet
6️⃣ Share insights with stakeholders instantly
No advanced Excel skills required—just update data and analyze results.
🎯 Who Can Benefit from This Smart Cities KPI Scorecard in Excel
This scorecard is ideal for:
✔️ Smart city administrators
✔️ Municipal corporations
✔️ Urban planners and policymakers
✔️ Government departments
✔️ Infrastructure project teams
✔️ Sustainability and ESG analysts
If your role involves monitoring urban performance, this tool delivers immediate value.
📈 How This Scorecard Improves Decision-Making
Because this scorecard highlights gaps, trends, and targets clearly:
-
Leaders detect underperformance early
-
Teams prioritize corrective actions
-
Budgets align with real performance data
-
Policies rely on measurable outcomes
As a result, decision-making becomes proactive, data-driven, and transparent.
📖 Click here to read the Detailed Blog Post
🎥 Visit our YouTube channel to learn step-by-step video tutorials
👉 https://youtube.com/@PKAnExcelExpert


Reviews
There are no reviews yet.