The Web3 ecosystem is moving at lightning speed ⚡. From blockchain platforms and DeFi services to NFT marketplaces and DAO operations, Web3 businesses generate massive data every single day. However, without a clear system to track performance, even the most innovative projects risk making decisions blindly.
That is exactly where the Web3 Services KPI Dashboard in Excel becomes a game-changer 🚀.
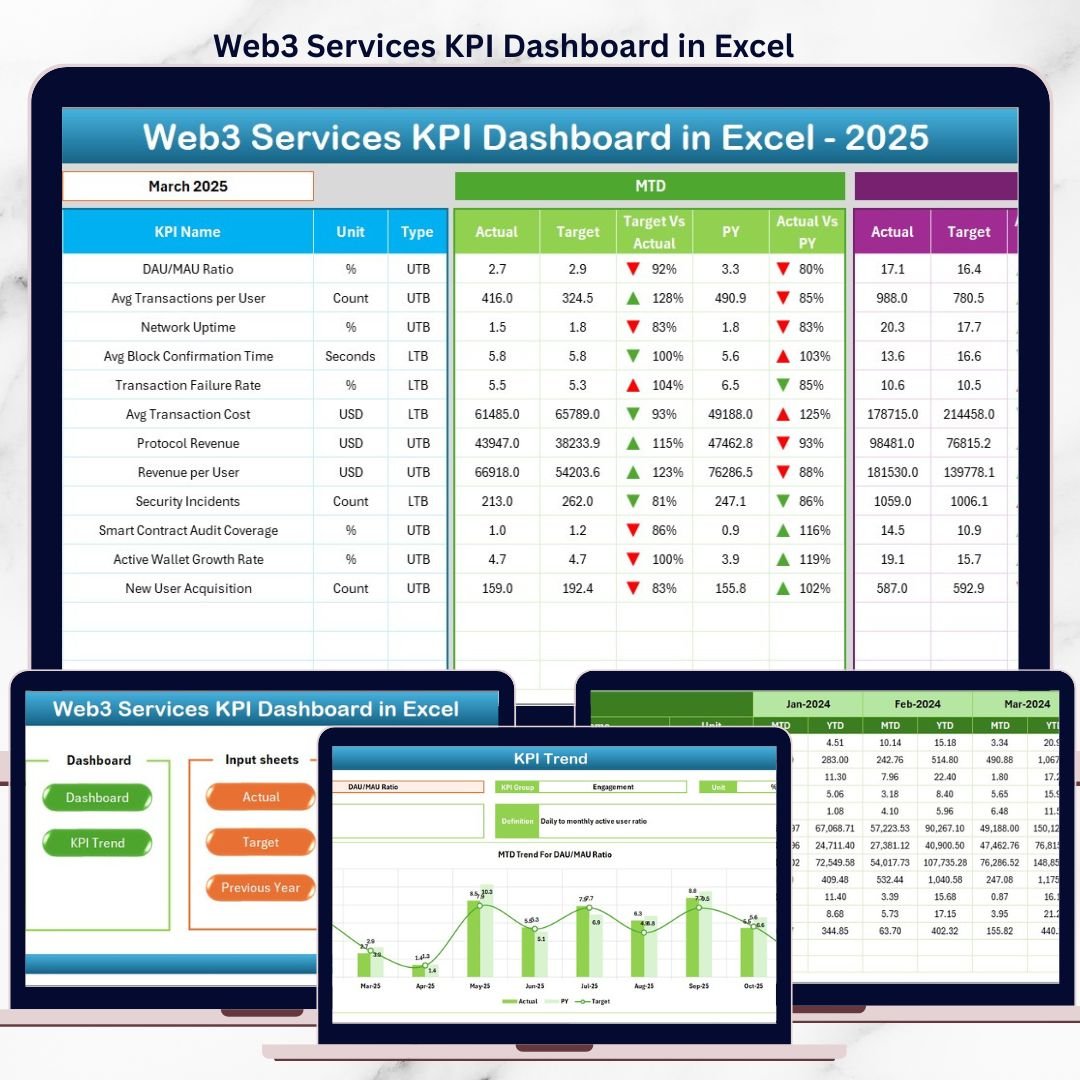
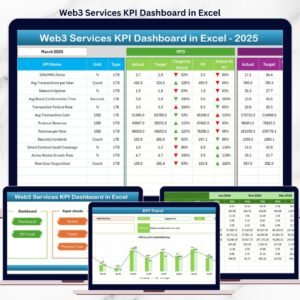
This ready-to-use Excel dashboard is designed specifically for Web3 service providers who want complete visibility, control, and clarity over their key performance indicators—without complex tools or expensive BI software. It converts raw Web3 data into actionable insights using structured worksheets, MTD & YTD tracking, trend analysis, and visual performance indicators.
Whether you are running a blockchain service, managing DAO operations, or offering Web3 consulting, this dashboard helps you stay data-driven and ahead of the curve.
🔑 Key Features of Web3 Services KPI Dashboard in Excel
📊 Centralized KPI Monitoring
Track all Web3 service KPIs from one single, interactive Excel dashboard.
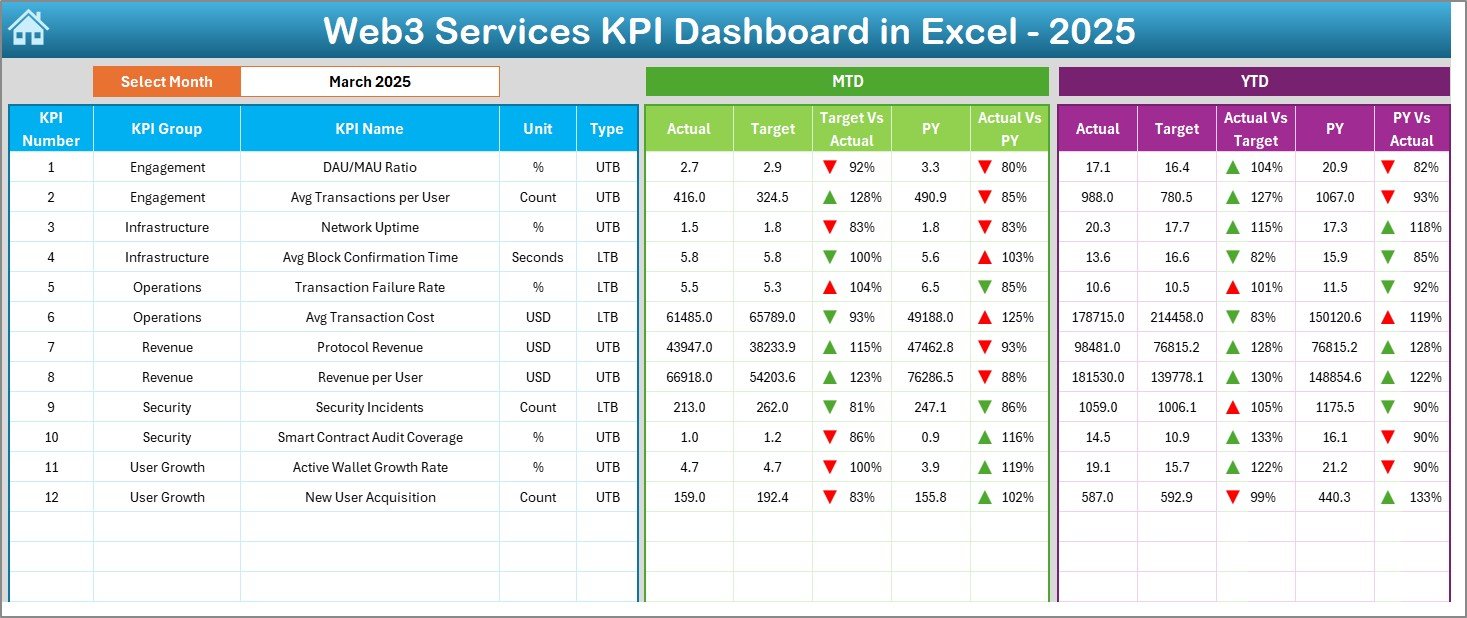
📅 Month-Based Analysis
Select the month from a drop-down and instantly view updated KPI results.
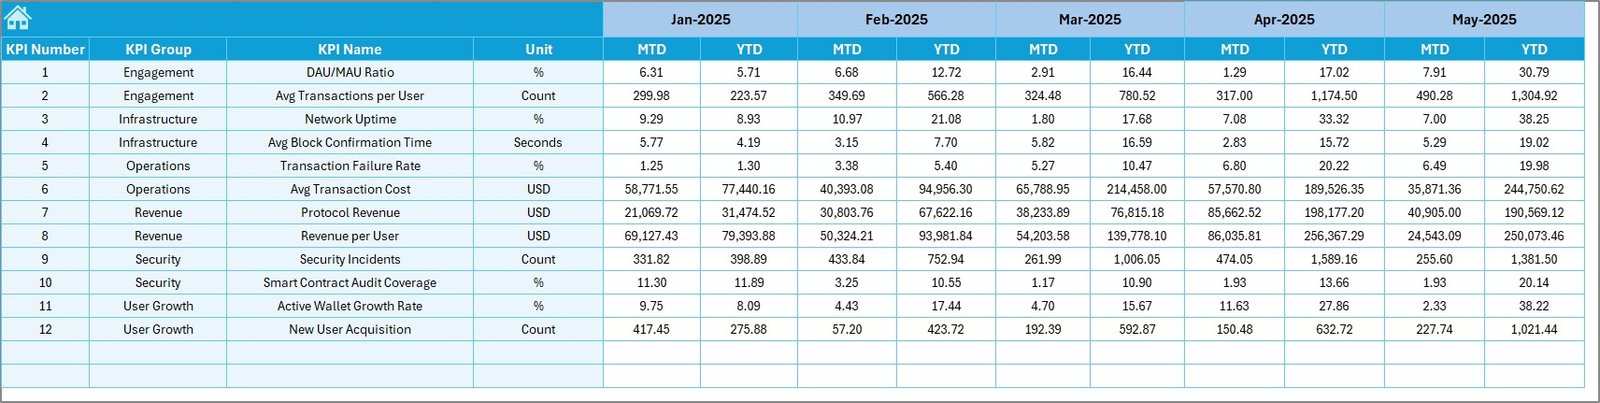
📈 MTD & YTD Performance Tracking
Monitor Month-to-Date and Year-to-Date actuals, targets, and previous-year values.
🎯 Target vs Actual Comparison
Instantly identify performance gaps using clear KPI comparisons.
📉 Trend Analysis with Visual Indicators
Analyze growth, decline, or stability using MTD and YTD trend charts.
🟢🔴 Conditional Formatting Alerts
Green and red arrows instantly highlight KPI success or underperformance.
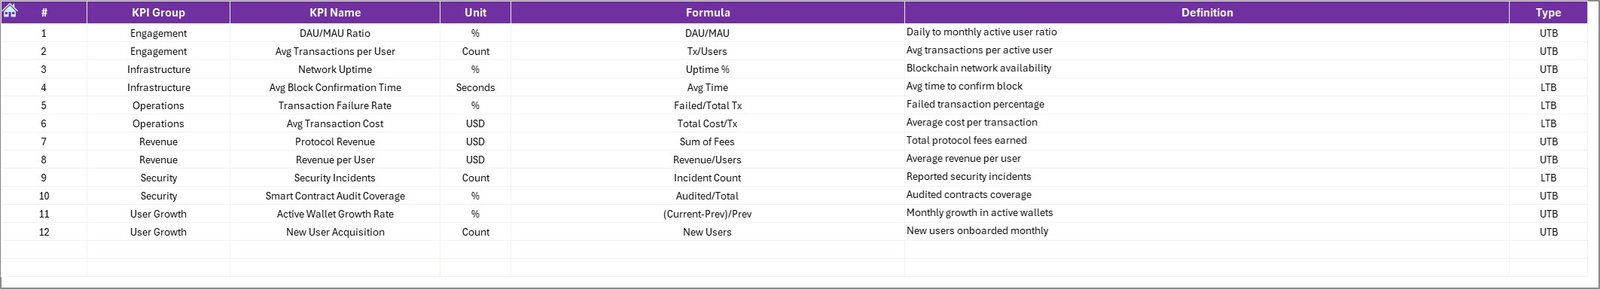
🧩 LTB & UTB KPI Classification
Clearly differentiate between Lower-the-Better and Upper-the-Better KPIs.
📦 What’s Inside the Web3 Services KPI Dashboard in Excel
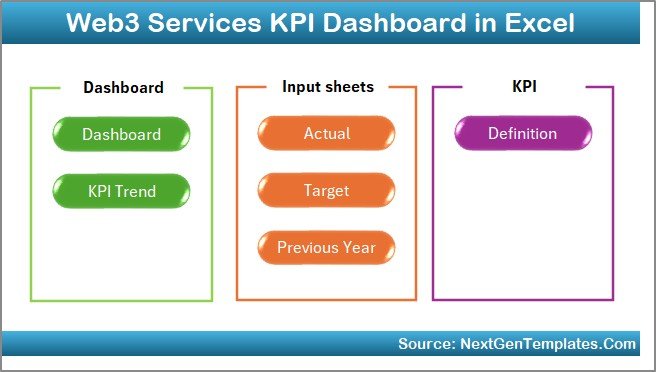
This dashboard follows a clean and scalable 7-worksheet structure, ensuring ease of use and long-term maintainability.
📌 Summary Page
Acts as the home screen with navigation buttons for smooth dashboard access.
📌 Dashboard Sheet
Displays all KPIs with MTD, YTD, target, and previous-year comparisons.
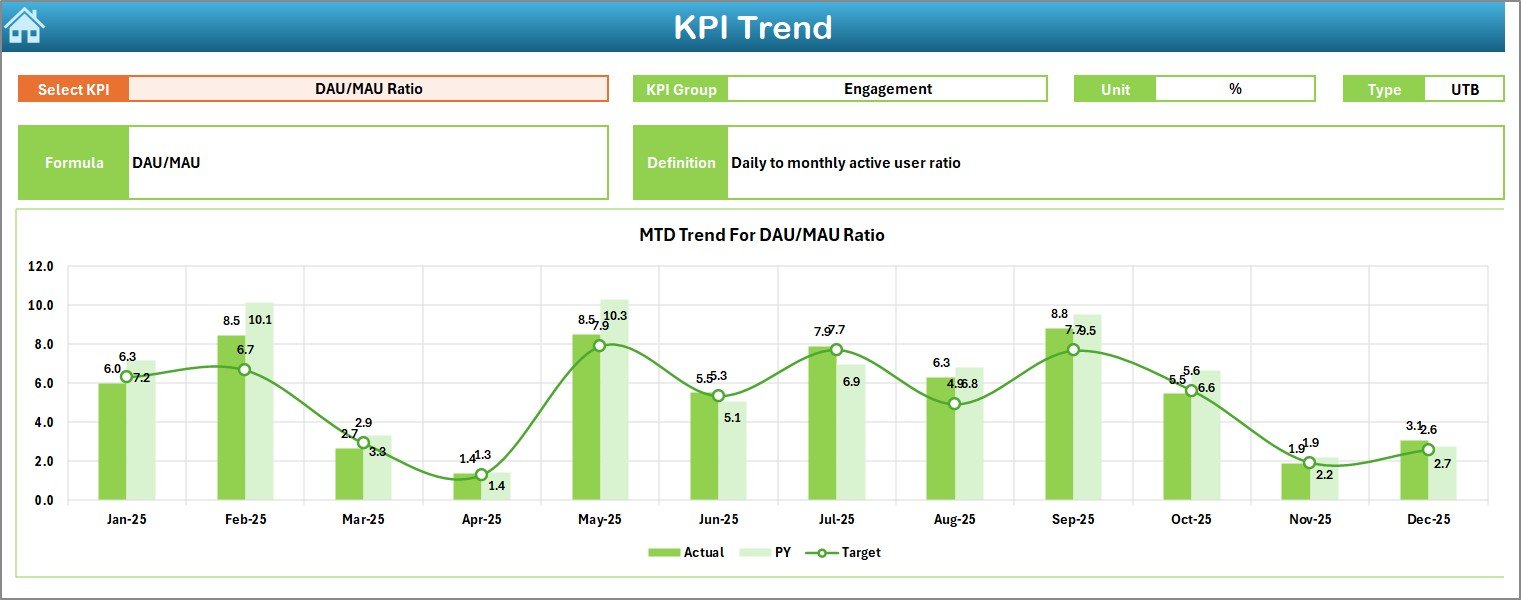
📌 KPI Trend Sheet
Shows detailed KPI trends with formula, definition, unit, and performance charts.
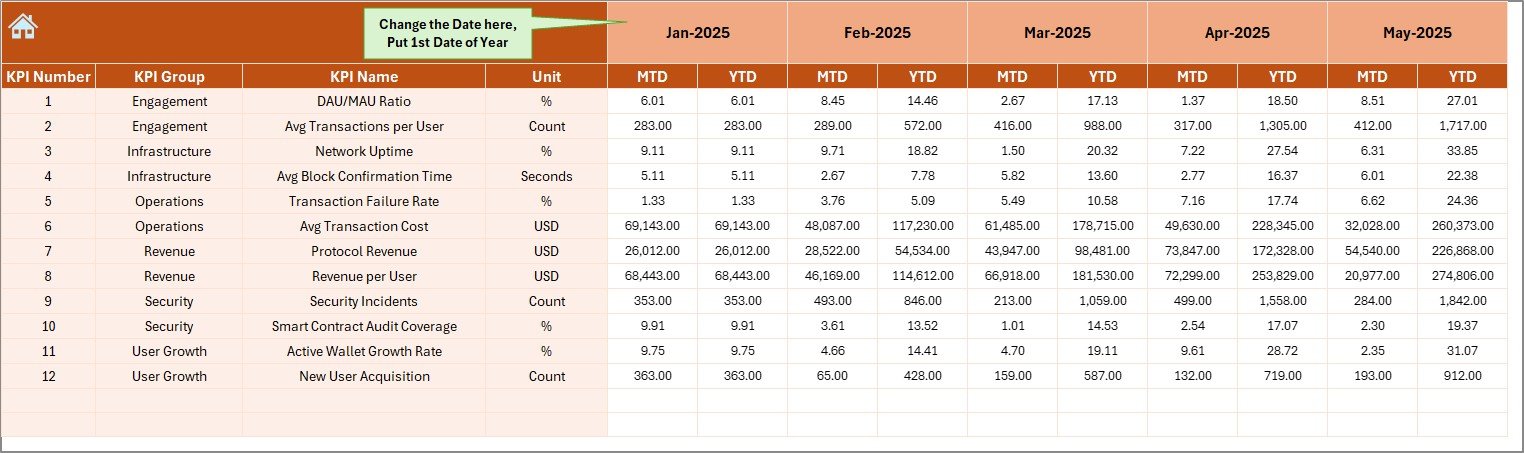
📌 Actual Numbers Input Sheet
Single location to enter monthly actual performance data.
📌 Target Sheet
Define MTD and YTD performance targets for every KPI.
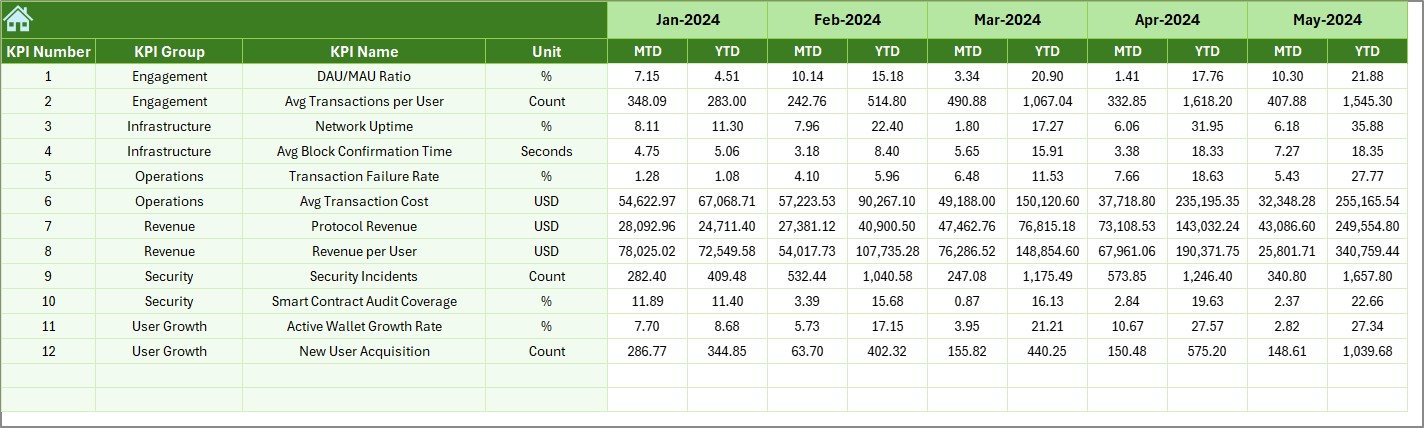
📌 Previous Year Numbers Sheet
Enable year-over-year comparison and benchmarking.
📌 KPI Definition Sheet
Standardize KPI definitions, formulas, units, and categories.
Everything is structured, pivot-ready, and business-focused—so you can start using it immediately.
🛠️ How to Use the Web3 Services KPI Dashboard in Excel
Using this dashboard is simple and intuitive—even for beginners.
1️⃣ Define your KPIs in the KPI Definition Sheet
2️⃣ Enter monthly actual values in the Actual Numbers Input Sheet
3️⃣ Set targets in the Target Sheet
4️⃣ Add previous-year data for comparison
5️⃣ Select the month and explore insights on the Dashboard & Trend Sheets
No macros. No coding. Just pure Excel intelligence 💡.
🎯 Who Can Benefit from This Web3 Services KPI Dashboard in Excel
This dashboard is ideal for:
🚀 Web3 founders & startup teams
🔗 Blockchain service providers
🧠 DAO operations & governance teams
📊 Web3 consultants & analysts
📈 Strategy, product, and growth teams
If your organization relies on Web3 data, this dashboard gives you clarity, confidence, and control.
Click here to read the Detailed Blog Post
Watch the step-by-step video tutorial:


Reviews
There are no reviews yet.