Managing performance in space technology organizations is never simple. Satellite missions, launch programs, system reliability, R&D efficiency, and cost control all demand absolute precision and real-time visibility. Yet in many organizations, critical KPI data still lives in scattered Excel files, manual reports, and disconnected systems—making performance tracking slow, unclear, and risky.
That is exactly where the Space Technology KPI Dashboard in Excel becomes a mission-critical performance management tool.Space Technology KPI Dashboard in Excel
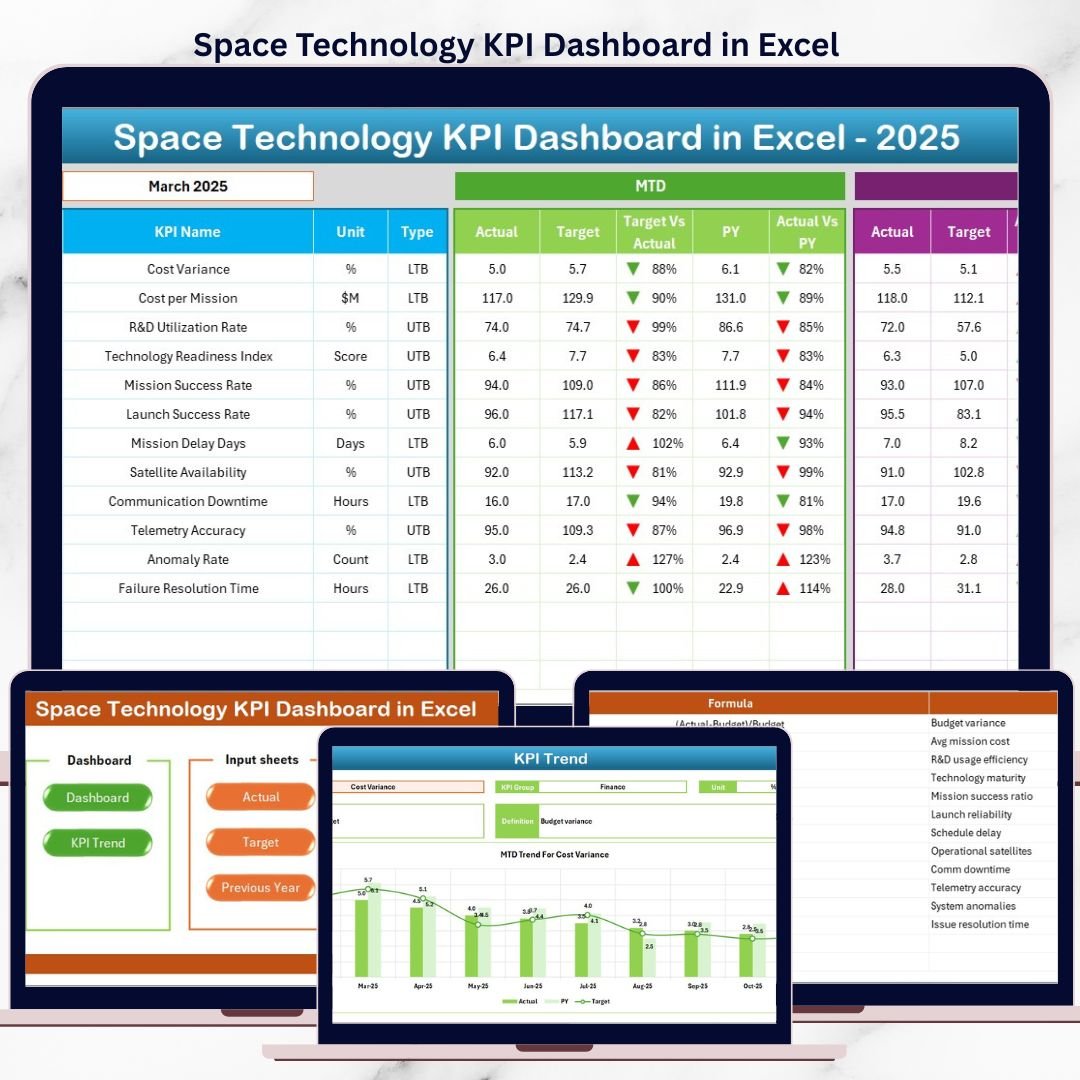
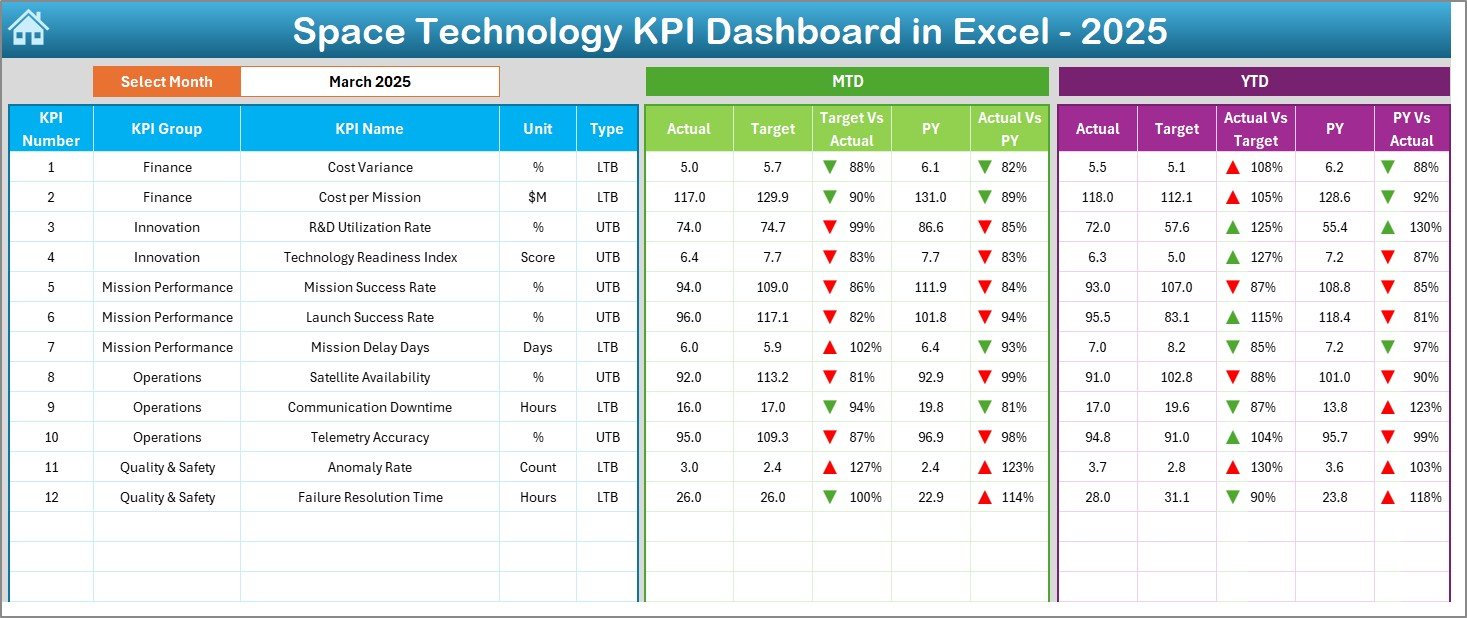
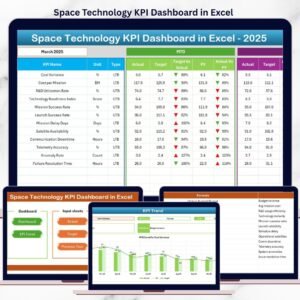
This professionally designed, ready-to-use Excel dashboard converts complex space-related KPI data into clear visuals, trend indicators, and actionable insights—all without expensive BI tools or technical complexity. Whether you manage satellite operations, mission programs, or advanced research initiatives, this dashboard gives you total control over performance in one centralized view.Space Technology KPI Dashboard in Excel
⭐ Key Features of Space Technology KPI Dashboard in Excel
🚀 Centralized KPI Monitoring
Track mission success, system reliability, cost variance, and R&D performance from one unified dashboard.
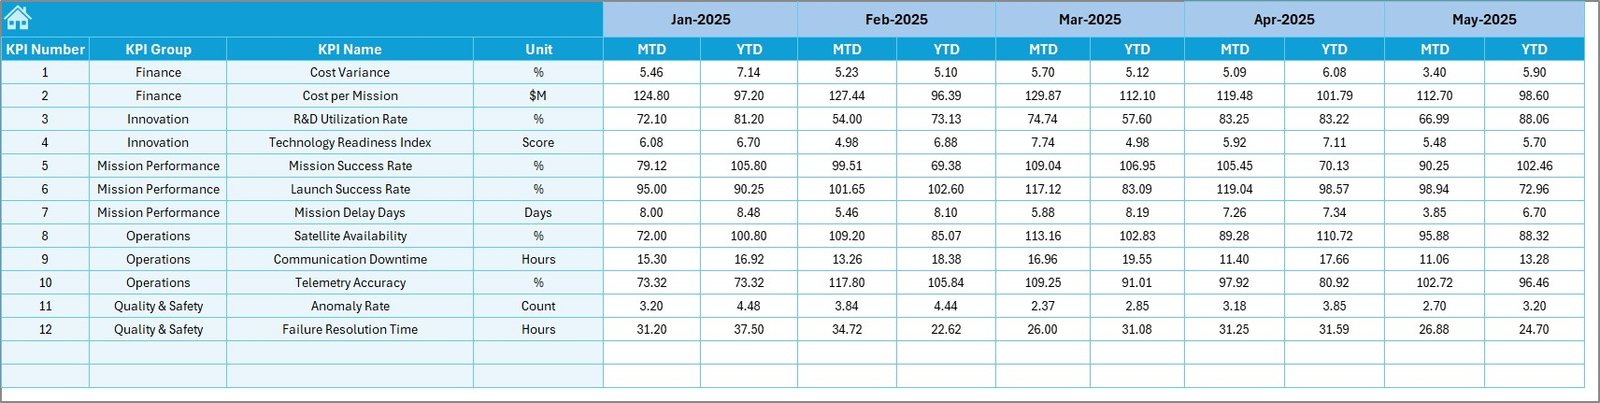
📊 MTD & YTD Performance Tracking
Instantly compare Actual vs Target vs Previous Year values to understand short-term and long-term performance.
📈 Visual Performance Indicators
Automatic green and red arrows instantly highlight positive trends and performance gaps.
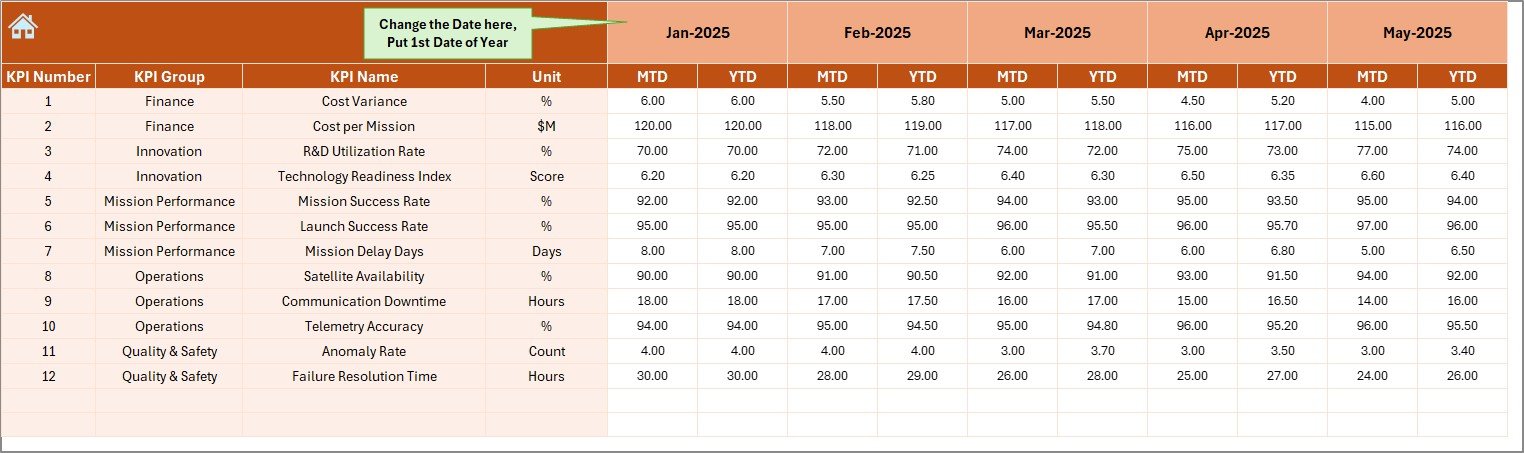
📅 Dynamic Month Selector
Change the reporting month from a simple dropdown and watch the entire dashboard update automatically.
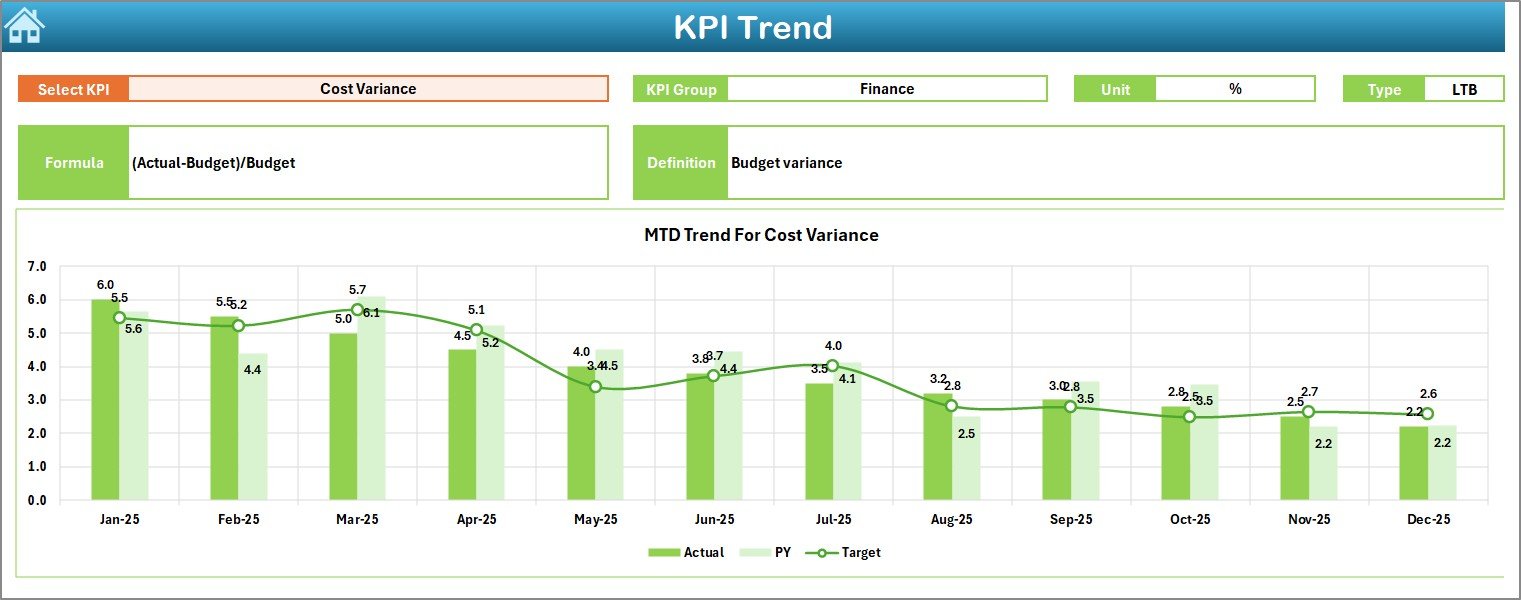
🧭 KPI Trend Analysis
Analyze each KPI individually with monthly and yearly trend charts for deeper insights.
📂 Structured Input & Analysis Sheets
Cleanly separated sheets ensure data accuracy, consistency, and easy maintenance.
💰 Cost-Effective & Scalable
Built entirely in Excel—no BI software, no coding, no subscriptions.
📦 What’s Inside the Space Technology KPI Dashboard
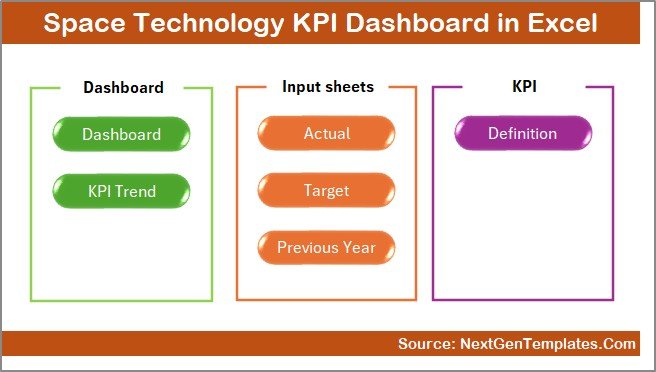
This Excel template includes 7 professionally structured worksheets, each designed to support precise KPI management:
📘 Summary Page – Quick navigation buttons for seamless movement across all analysis sheets
📊 Dashboard Sheet – Main KPI view with MTD, YTD, variance analysis, and visual indicators
📉 Trend Sheet – KPI-wise deep-dive analysis with MTD & YTD trend charts
✍️ Actual Numbers Input Sheet – Centralized entry for real performance data
🎯 Target Sheet – Monthly and yearly target planning for every KPI
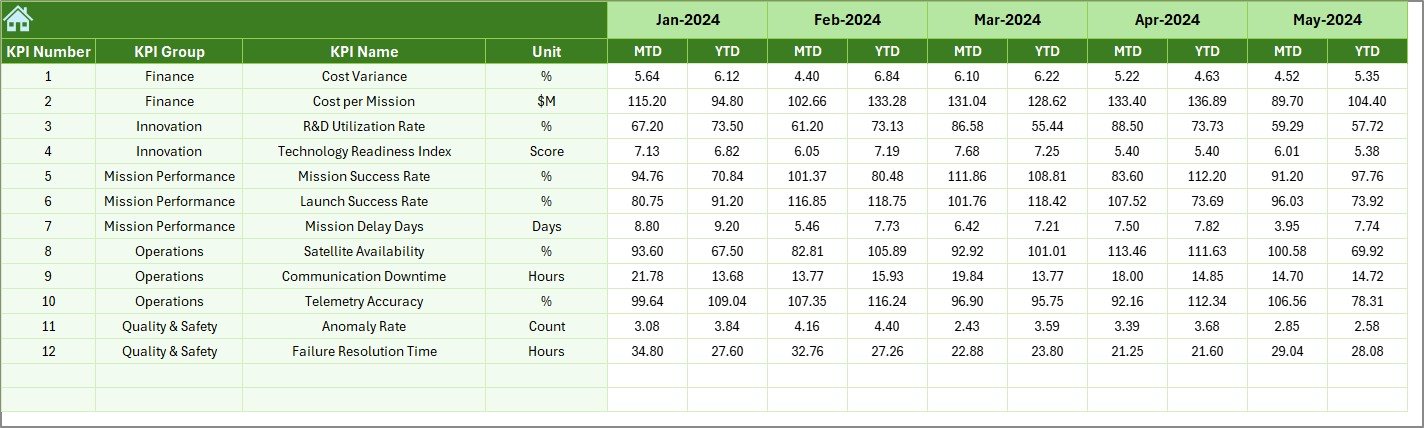
📅 Previous Year Data Sheet – Year-over-year comparison and historical analysis
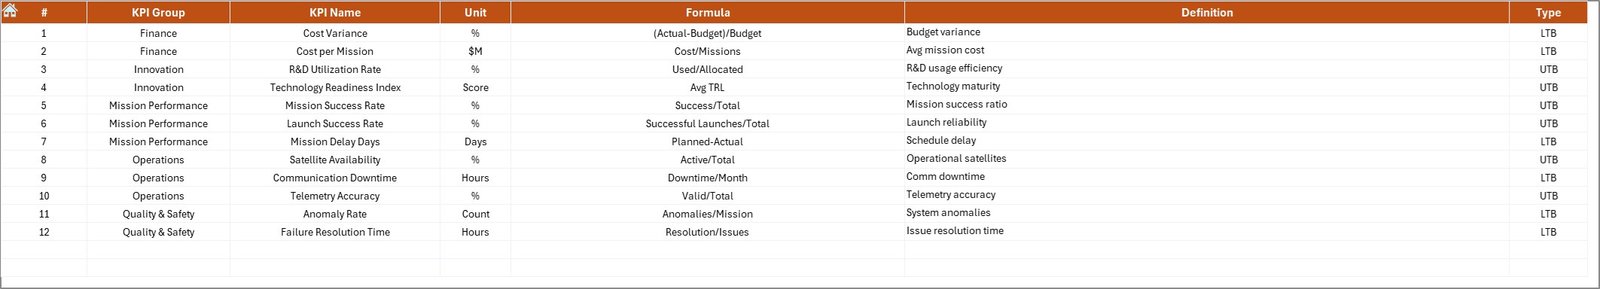
📚 KPI Definition Sheet – KPI names, formulas, units, groups, and definitions for full clarity
Together, these sheets create a complete performance governance system for space technology programs.
⚙️ How to Use the Space Technology KPI Dashboard
🧩 Step 1: Define your KPIs clearly in the KPI Definition Sheet
📥 Step 2: Enter monthly actual values in the Actual Numbers Input Sheet
🎯 Step 3: Add targets in the Target Sheet
📊 Step 4: Review performance instantly on the Dashboard Sheet
📈 Step 5: Analyze trends and root causes using the Trend Sheet
No advanced Excel skills are required—basic Excel knowledge is enough to operate this dashboard confidently.
👥 Who Can Benefit from This Space Technology KPI Dashboard?
🛰️ Space technology companies
🚀 Satellite launch and mission teams
🔬 Aerospace R&D departments
📊 Program management offices (PMO)
🏛️ Government space agencies
📈 Strategy, analytics, and performance teams
If your organization relies on precision, accountability, and data-driven decisions, this dashboard is built for you.
Click here to read the detailed blog post
Watch the step-by-step video tutorial:
Visit our YouTube channel to learn step-by-step video tutorials


Reviews
There are no reviews yet.