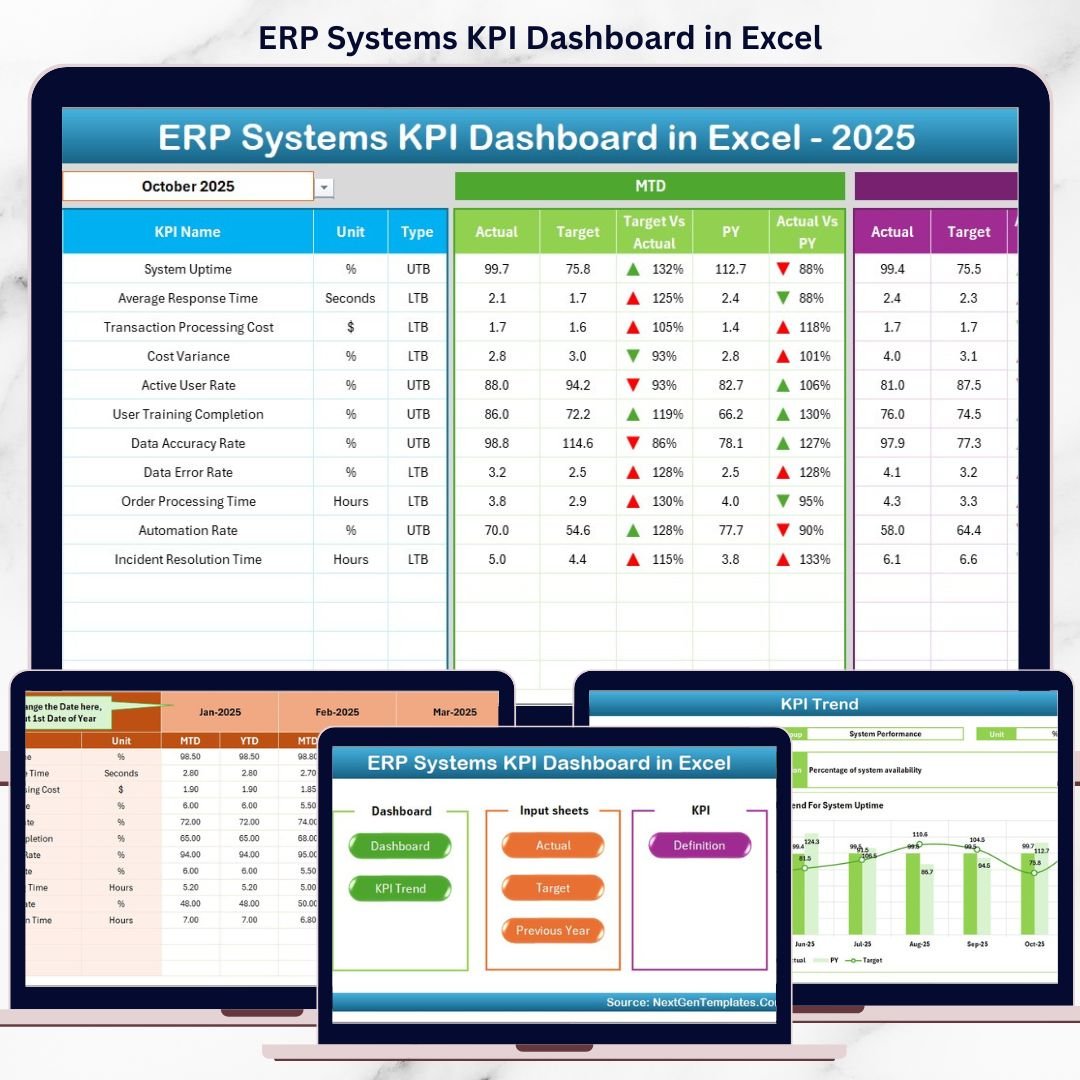
Implementing an ERP system is a major milestone for any organization. However, implementation alone does not guarantee success. The real value of an ERP system depends on how well it performs, how widely it is adopted, and how effectively it supports business decisions. That is exactly where the ERP Systems KPI Dashboard in Excel becomes a must-have performance management tool.
This ready-to-use Excel dashboard converts complex ERP data into clear KPIs, visual indicators, and actionable insights. Instead of struggling with multiple ERP reports or raw system exports, decision-makers get one centralized dashboard that shows ERP performance at a glance.
Designed for ERP managers, IT teams, finance leaders, and operations heads, this dashboard helps organizations track ERP efficiency, monitor adoption, compare targets vs actuals, and analyze trends over time—all within Microsoft Excel.
Because it is built entirely in Excel, the dashboard remains simple, flexible, transparent, and cost-effective, without requiring any additional BI tools or technical expertise.
🔑 Key Features of ERP Systems KPI Dashboard in Excel
📊 7 structured worksheets for complete ERP performance tracking
📅 Month selector to dynamically change reporting period
🎯 MTD & YTD analysis for short-term and long-term visibility
📈 Target vs Actual comparison with clear variance indicators
📉 Previous Year comparison for maturity and improvement tracking
🔼🔽 Conditional formatting arrows for instant performance signals
🧭 Navigation buttons for smooth user experience
⚙️ Fully customizable KPIs based on ERP modules and business needs
This dashboard transforms Excel into a powerful ERP performance cockpit.
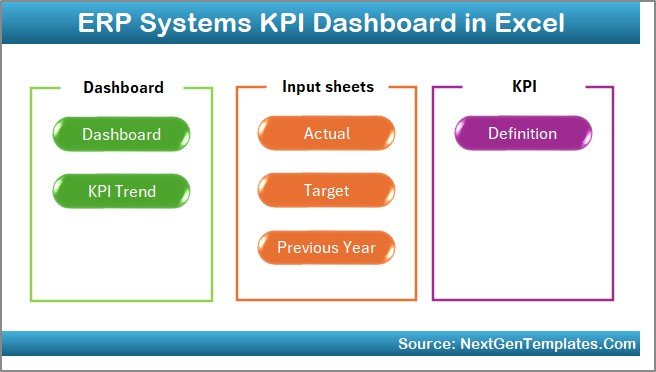
📂 What’s Inside the ERP Systems KPI Dashboard
🏠 Home Sheet – Navigation Center
The Home Sheet acts as the index page of the dashboard.
Key Highlights:
-
6 clickable navigation buttons
-
Instant access to all worksheets
-
Eliminates scrolling and confusion
This sheet ensures smooth navigation for all users, including non-technical stakeholders.
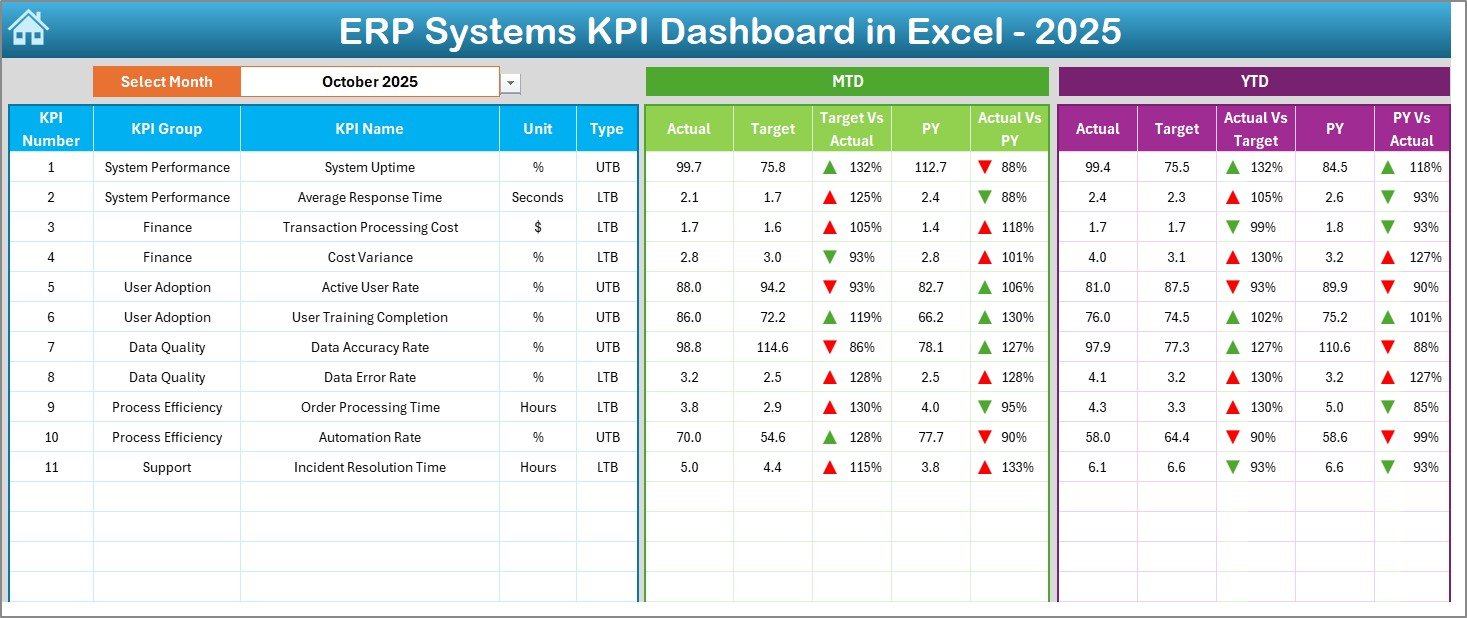
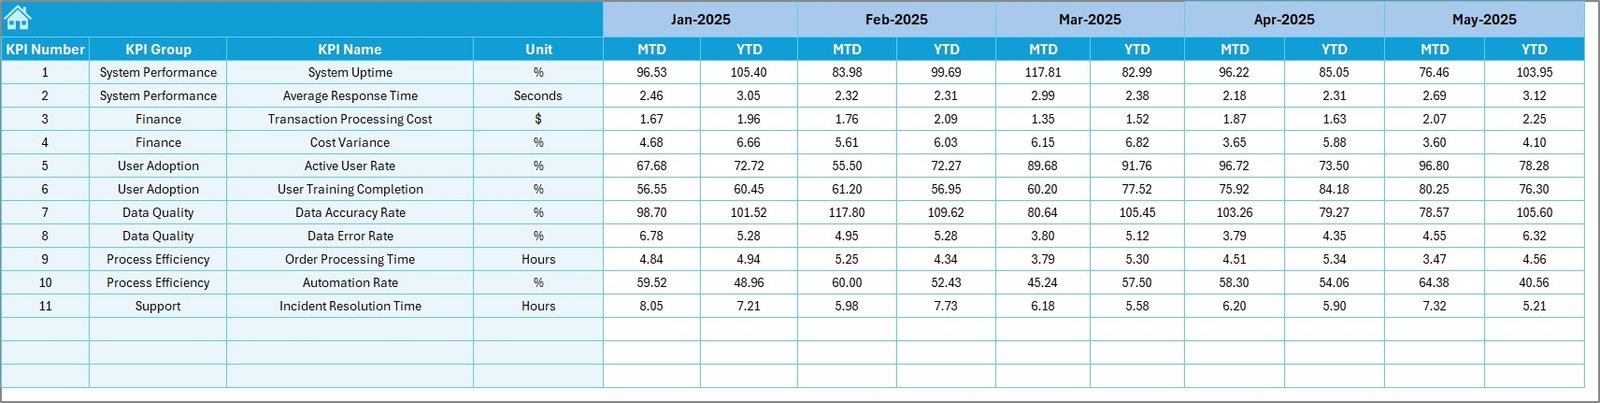
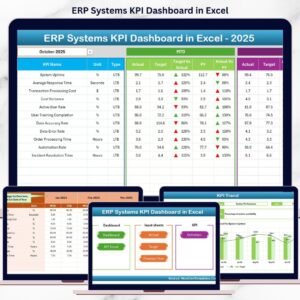
📊 Dashboard Sheet – ERP Performance Overview
The Dashboard Sheet is the heart of the ERP KPI Dashboard.
Key Capabilities:
-
Month selection dropdown at cell D3
-
Automatic update of all KPIs
-
Displays:
-
MTD Actual, Target & Previous Year
-
YTD Actual, Target & Previous Year
-
-
Shows:
-
Target vs Actual variance
-
Previous Year vs Actual variance
-
-
Uses green/red up-down arrows for instant interpretation
With one glance, leadership teams can identify performance gaps, improvements, and risks.
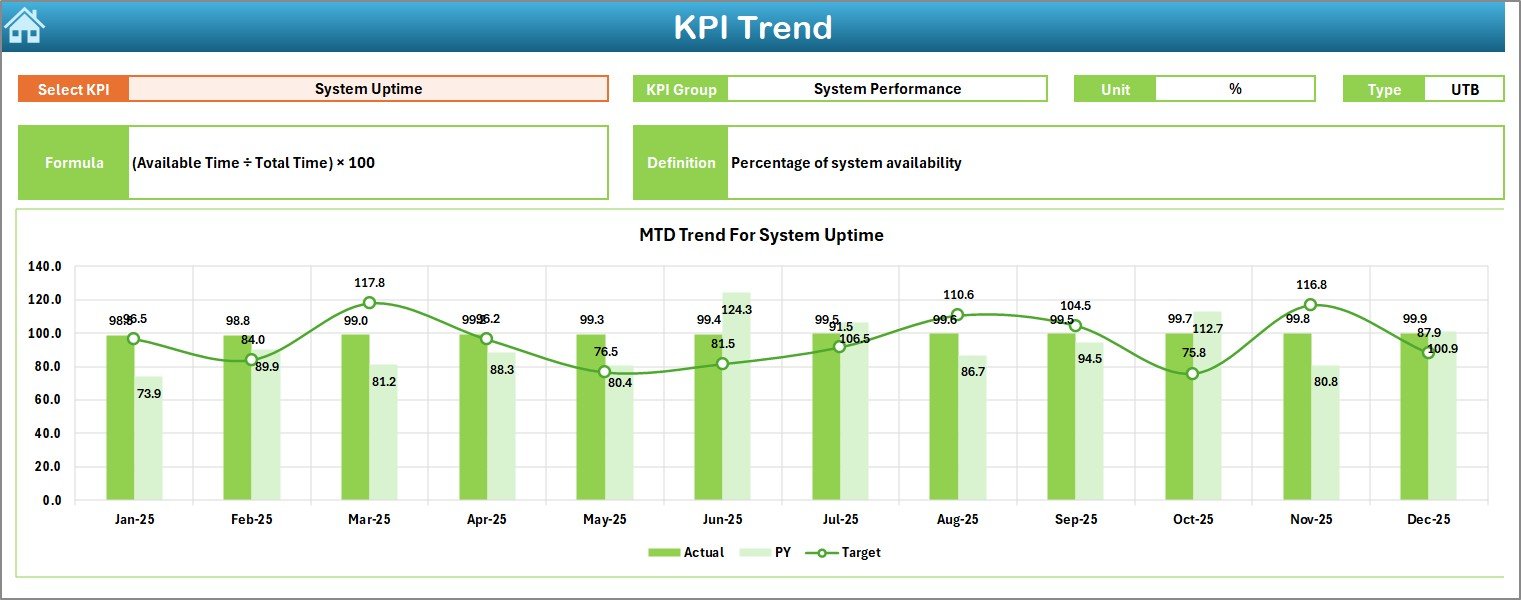
📈 KPI Trend Sheet – Deep KPI Analysis
The KPI Trend Sheet enables detailed KPI-level exploration.
How It Works:
-
Select KPI Name from dropdown at cell C3
-
View:
-
KPI Group
-
Unit
-
KPI Type (UTB / LTB)
-
Formula & Definition
-
Trend Analysis Includes:
-
MTD trend (Actual vs Target vs Previous Year)
-
YTD trend (Actual vs Target vs Previous Year)
This sheet supports root-cause analysis and strategic planning.
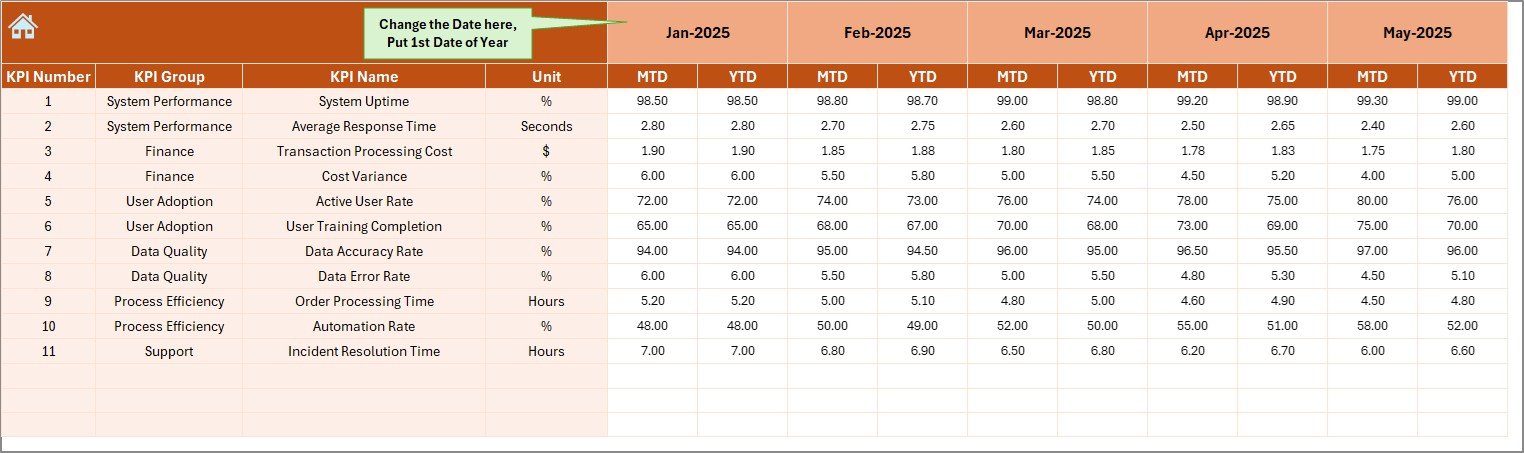
✍️ Actual Numbers Input Sheet – Data Entry Area
This sheet is where actual ERP performance data is entered.
Key Features:
-
Enter MTD and YTD actual values
-
Control reporting month using cell E1
-
Clean, structured, and formula-safe layout
Because data entry stays simple, accuracy and consistency improve significantly.
🎯 Target Sheet – Performance Expectations
The Target Sheet defines success benchmarks.
You Can:
-
Enter MTD and YTD targets
-
Align ERP performance with business goals
-
Ensure meaningful variance analysis
Targets turn ERP metrics into actionable performance indicators.
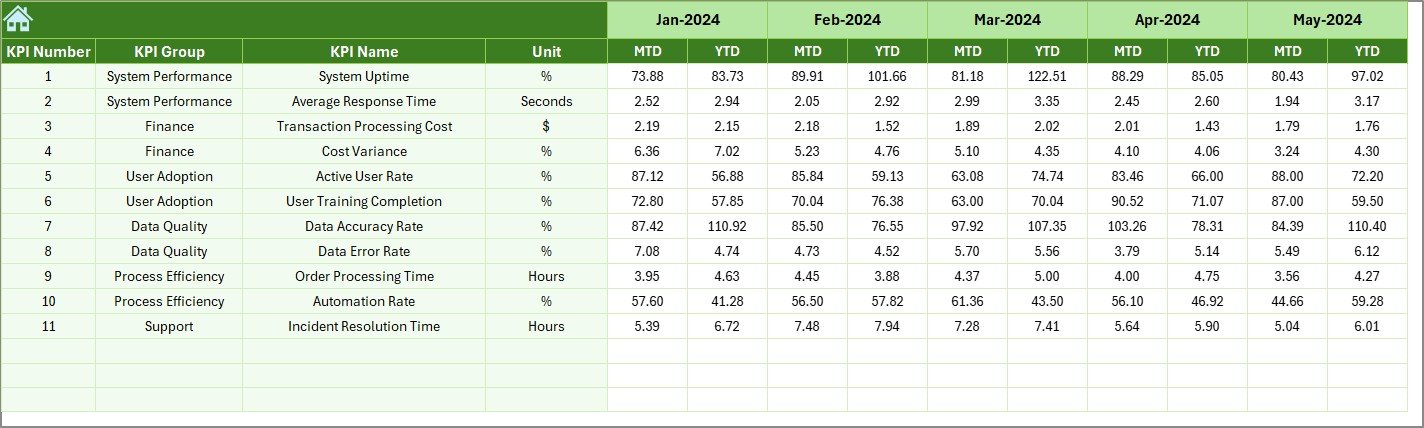
⏮️ Previous Year Number Sheet – Historical Comparison
This sheet stores last year’s KPI values.
Why It Matters:
-
Enables year-over-year comparison
-
Highlights ERP improvement or decline
-
Supports maturity assessment
Historical context strengthens data-driven leadership decisions.
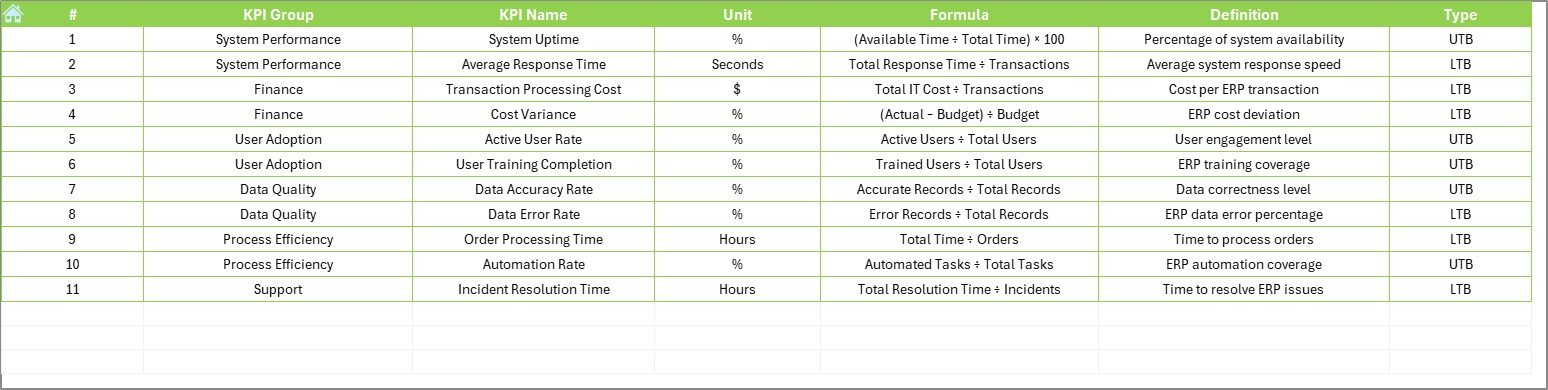
📘 KPI Definition Sheet – Standardization & Clarity
The KPI Definition Sheet acts as a reference guide.
Contains:
-
KPI Name
-
KPI Group
-
Unit
-
Formula
-
Definition
This sheet ensures everyone interprets KPIs the same way, reducing confusion across departments.
🛠️ How to Use the ERP Systems KPI Dashboard
✅ Enter actual data, targets, and previous year values
✅ Select reporting month from dropdown
✅ Review MTD & YTD performance instantly
✅ Analyze trends and variances
✅ Take corrective or strategic actions
No advanced Excel skills required.
👥 Who Can Benefit from This ERP Dashboard?
🏢 ERP Managers
💻 IT Leadership Teams
📊 Operations Managers
💰 Finance Controllers
📈 Business Analysts
🔄 Process Improvement Teams
Perfect for any organization using an ERP system, regardless of industry.
👉 Click here to read the Detailed blog post
▶️ Visit our YouTube channel to learn step-by-step video tutorials
https://youtube.com/@PKAnExcelExpert


Reviews
There are no reviews yet.