Managing heavy machinery without clear performance data always creates risk. Unexpected breakdowns delay projects. Maintenance costs rise suddenly. Productivity drops without warning. Therefore, organizations that rely on heavy equipment need a simple, visual, and reliable way to monitor machinery performance.
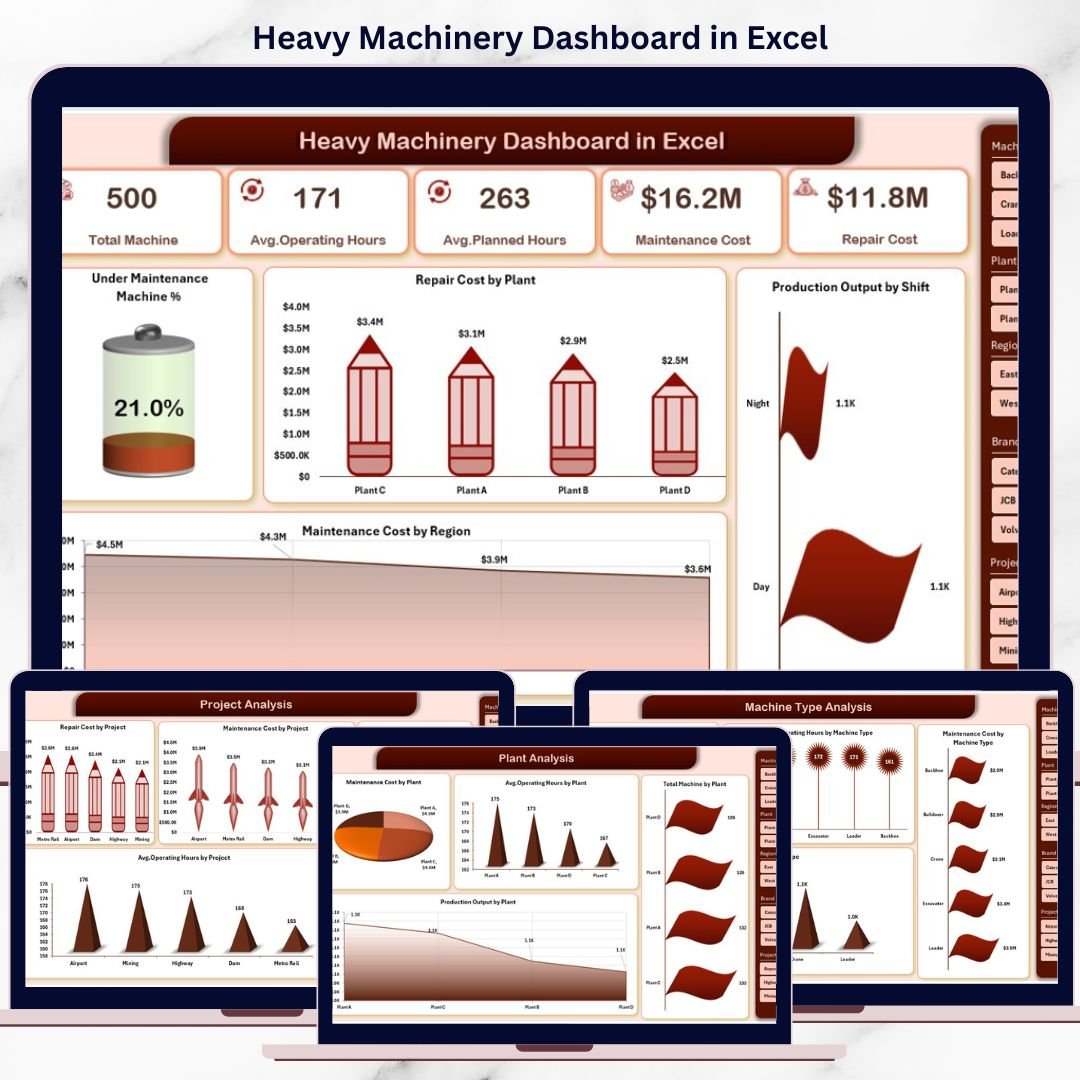
That is exactly why the Heavy Machinery Dashboard in Excel is a must-have operational tool 🚀. This ready-to-use Excel dashboard transforms raw machinery data into clear KPIs, interactive charts, and actionable insights—all inside a single Excel file. Instead of juggling multiple spreadsheets, managers see maintenance, repair, cost, and production performance at a glance.
Designed for construction, manufacturing, mining, and infrastructure operations, this dashboard helps teams reduce downtime, control maintenance costs, and improve equipment utilization with confidence.
🔑 Key Features of Heavy Machinery Dashboard in Excel
🚜 5 Dedicated Analysis Pages for complete machinery insights
📊 Interactive Pivot Charts & KPI Cards for fast understanding
🧭 Left-Side Page Navigator for smooth dashboard navigation
🎯 Dynamic Slicers to filter by plant, project, machine type, brand, or shift
💰 Maintenance & Repair Cost Tracking to control expenses
⏱️ Operating & Downtime Analysis to improve utilization
🏭 Plant & Project Comparison for performance benchmarking
🧩 100% Excel-Based Solution – no macros, no add-ins required
This dashboard delivers clarity, speed, and control to machinery-intensive operations.
📂 What’s Inside the Heavy Machinery Dashboard
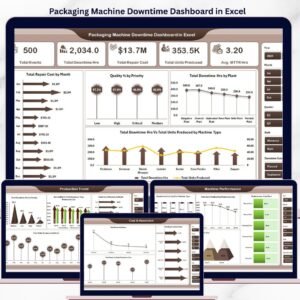
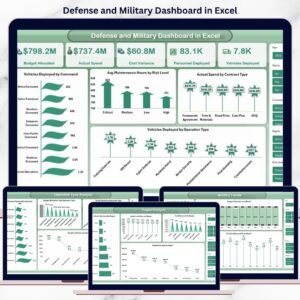
📊 Overview Page
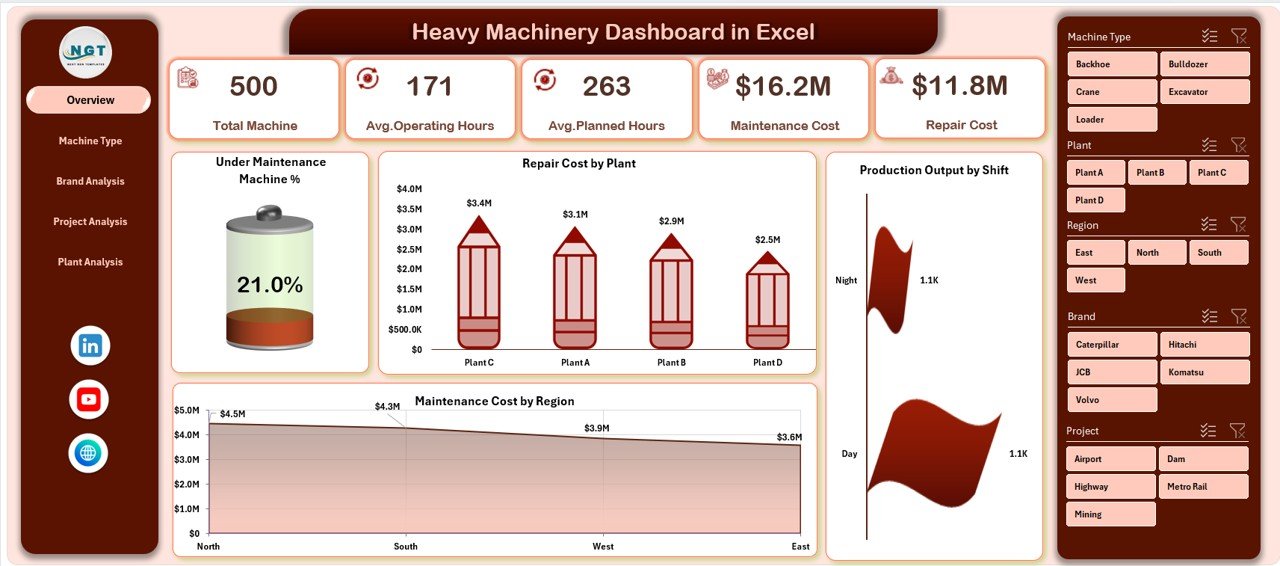
The executive summary of machinery performance, showing:
-
Maintenance Machine %
-
Repair Cost by Plant
-
Production Output by Shift
-
Maintenance Cost by Region
This page helps leaders instantly identify cost spikes and productivity issues.
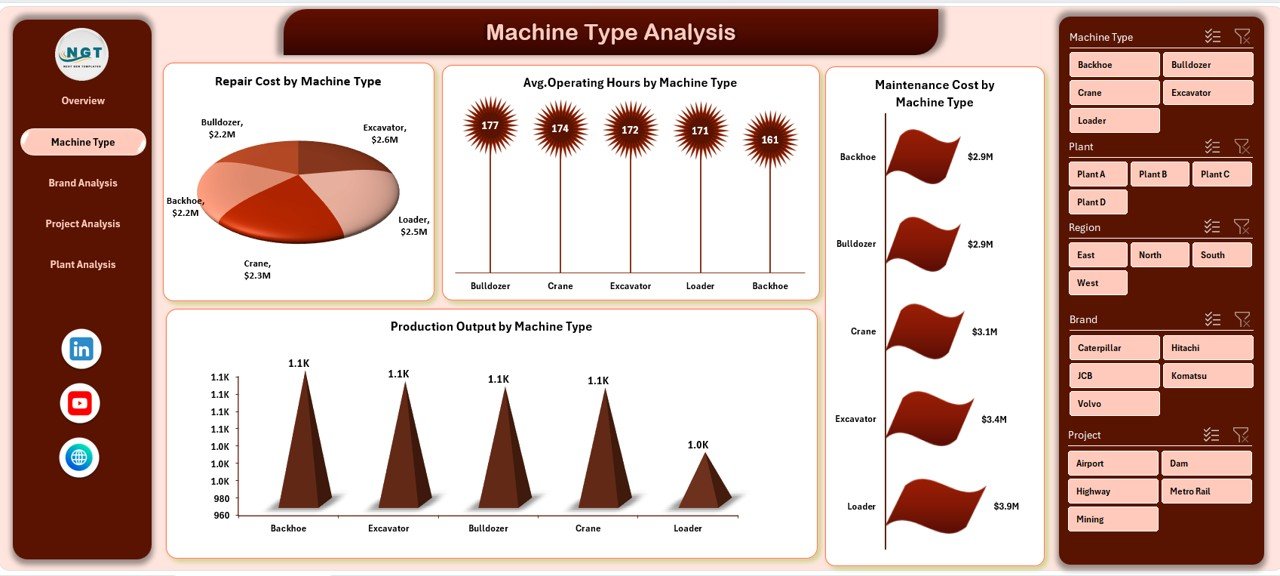
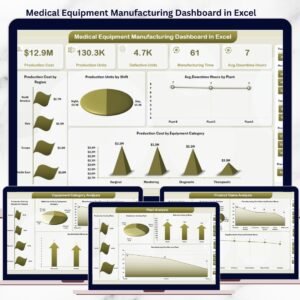
⚙️ Machine Type Analysis Page
Compares performance across different machinery types to highlight:
-
Repair cost differences
-
Operating hour variations
-
Maintenance cost patterns
-
Production output efficiency
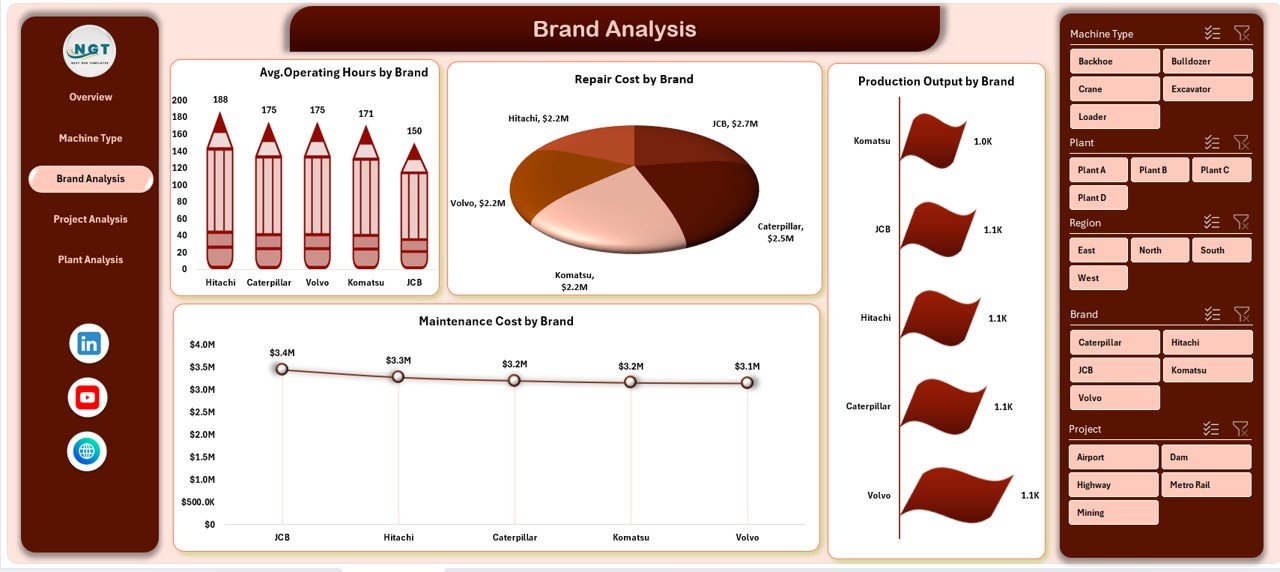
🏷️ Brand Analysis Page
Evaluates machinery performance by brand, supporting smarter procurement decisions through:
-
Average operating hours
-
Repair and maintenance costs
-
Production output comparisons
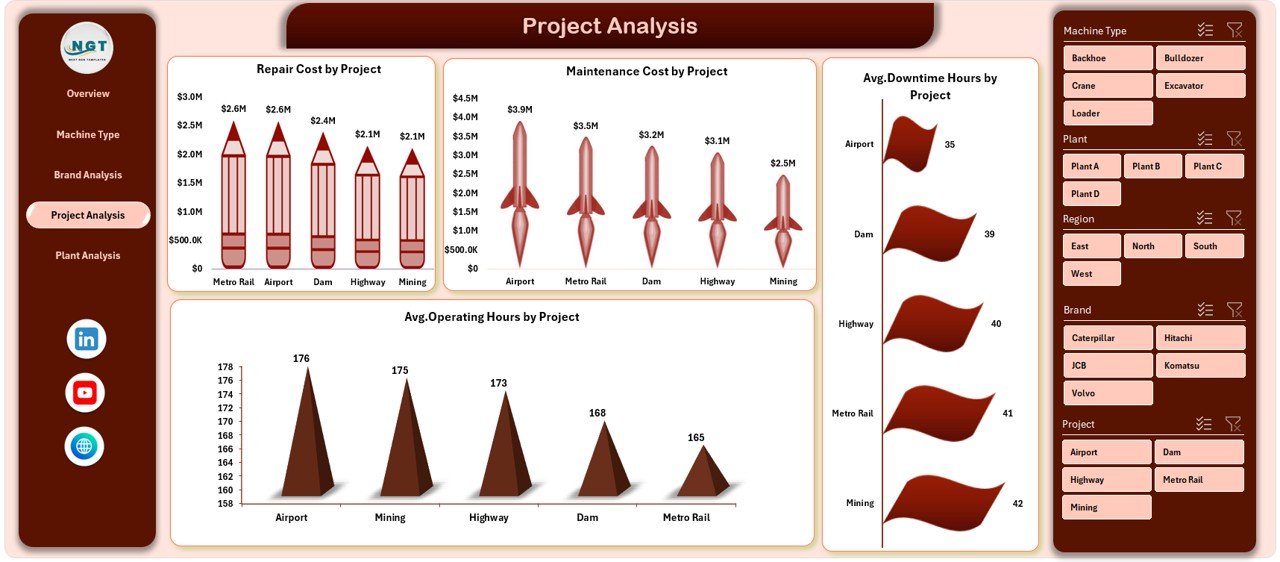
📁 Project Analysis Page
Analyzes machinery usage across projects to track:
-
Repair and maintenance cost by project
-
Downtime hours
-
Operating hours
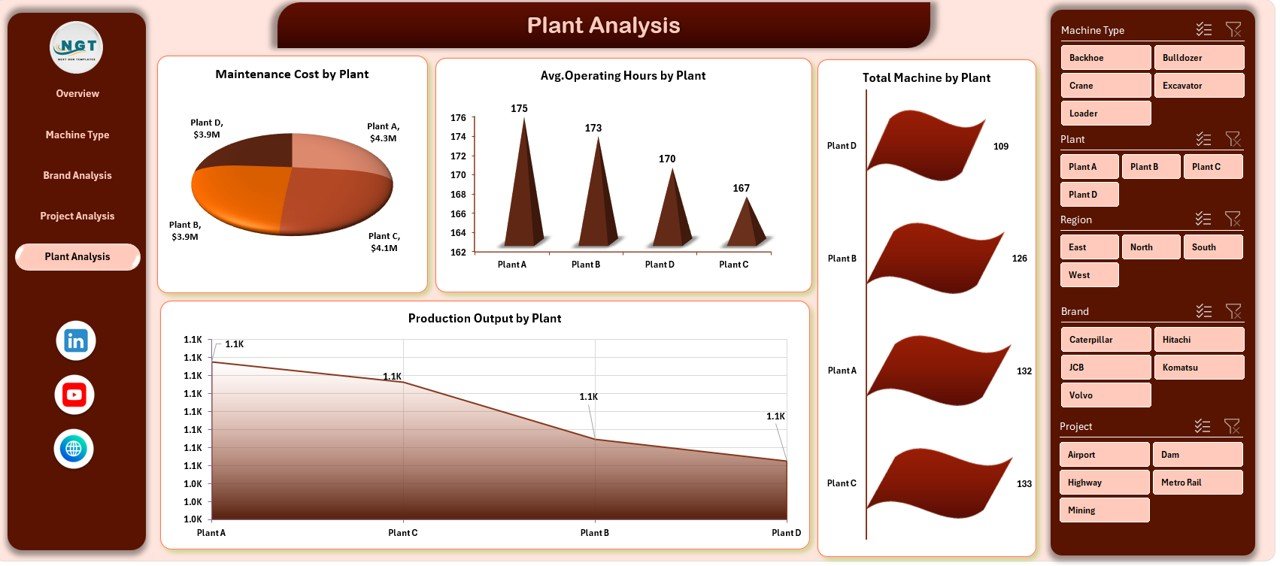
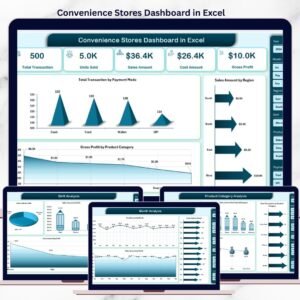
🏭 Plant Analysis Page
Compares machinery performance across plants to identify:
-
Maintenance cost differences
-
Equipment utilization levels
-
Production output by location
Each page includes interactive slicers for quick filtering and deeper analysis.
🛠️ How to Use the Heavy Machinery Dashboard in Excel
✅ Enter or update raw machinery data in the data sheet
✅ Refresh pivot tables with one click
✅ Use slicers to filter by plant, project, machine type, or brand
✅ Navigate between pages using the page navigator
✅ Analyze trends and take corrective action
No advanced Excel skills are required. The dashboard is easy to use, easy to update, and easy to customize.
👥 Who Can Benefit from This Heavy Machinery Dashboard?
🏗️ Construction Companies
🏭 Manufacturing Plants
⛏️ Mining Operations
🚧 Infrastructure Projects
📊 Operations & Maintenance Teams
🧑💼 Plant & Project Managers
If your business depends on heavy equipment, this dashboard becomes an essential decision-support tool.
👉 Click here to read the Detailed blog post
▶️ Visit our YouTube channel to learn step-by-step video tutorials
https://youtube.com/@PKAnExcelExpert


Reviews
There are no reviews yet.