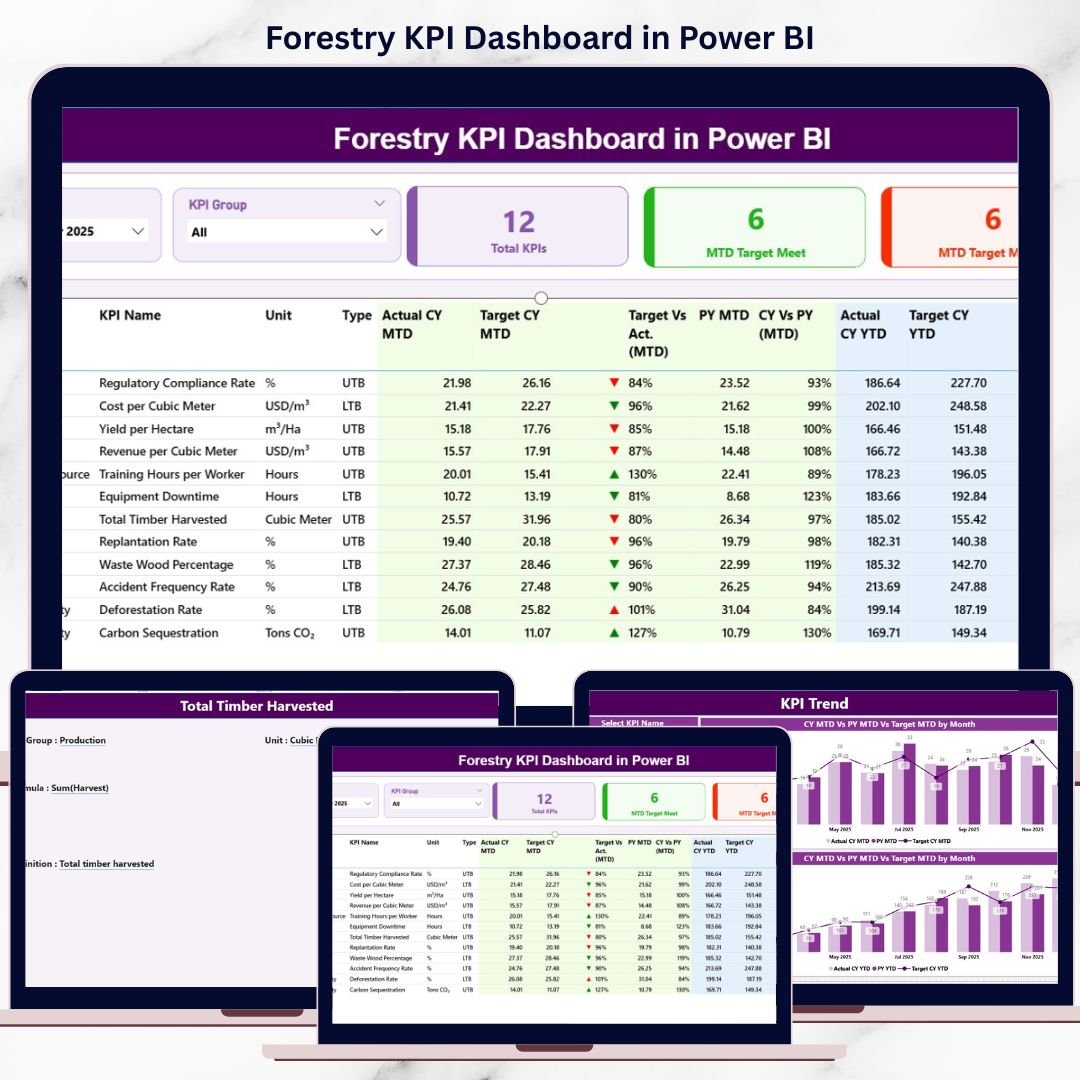
Forestry KPI Dashboard in Power BI a challenging environment where sustainability, productivity, safety, and compliance must move together. Forestry managers, sustainability officers, and operations teams track multiple KPIs related to harvesting, conservation, efficiency, and environmental impact. However, when this data sits across disconnected Excel files, performance tracking becomes slow, inconsistent, and difficult to trust.
That is where the Forestry KPI Dashboard in Power BI delivers real value 🚀. This ready-to-use Power BI dashboard transforms raw forestry data into interactive visuals, KPI cards, trend charts, and performance indicators. Instead of manually reviewing spreadsheets, decision-makers gain instant visibility into MTD and YTD performance, target achievement, and year-over-year comparisons.
Designed specifically for forestry operations and sustainability management, this dashboard helps organizations monitor performance clearly, improve accountability, and support data-driven decisions with confidence.
🔑 Key Features of Forestry KPI Dashboard in Power BI
🌲 Centralized KPI Monitoring for forestry operations
📊 MTD & YTD Performance Tracking with clear comparisons
🎯 Target Met & Target Missed Analysis at a glance
📈 Interactive KPI Trend Analysis over time
🧭 KPI Group & Month Slicers for quick filtering
🔍 Drill-Through KPI Definitions for transparency
⚡ Excel-Based Data Source for easy updates
🧩 Scalable Power BI Model for future KPI expansion
This dashboard brings clarity, control, and confidence to forestry performance reporting.
📂 What’s Inside the Forestry KPI Dashboard
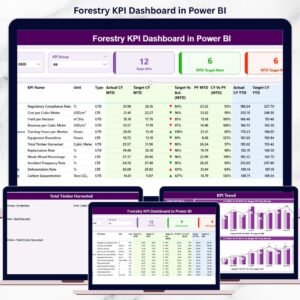
📊 Summary Page
The main page of the dashboard that provides a complete KPI overview.
It includes:
-
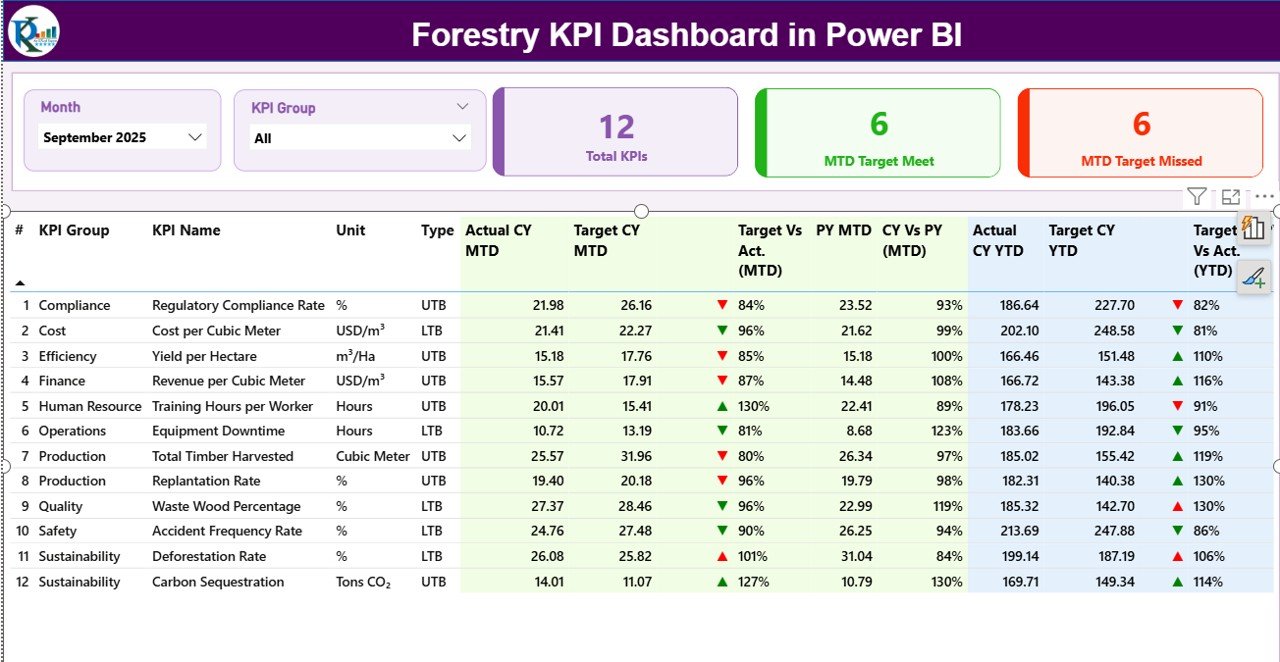
Month slicer and KPI Group slicer
-
KPI cards showing total KPIs, MTD target met, and MTD target missed
-
A detailed KPI table with:
-
KPI number, group, name, unit, and type (UTB/LTB)
-
MTD Actual, Target, Previous Year, and variance indicators
-
YTD Actual, Target, Previous Year, and variance indicators
Green and red arrows instantly highlight performance status.
-
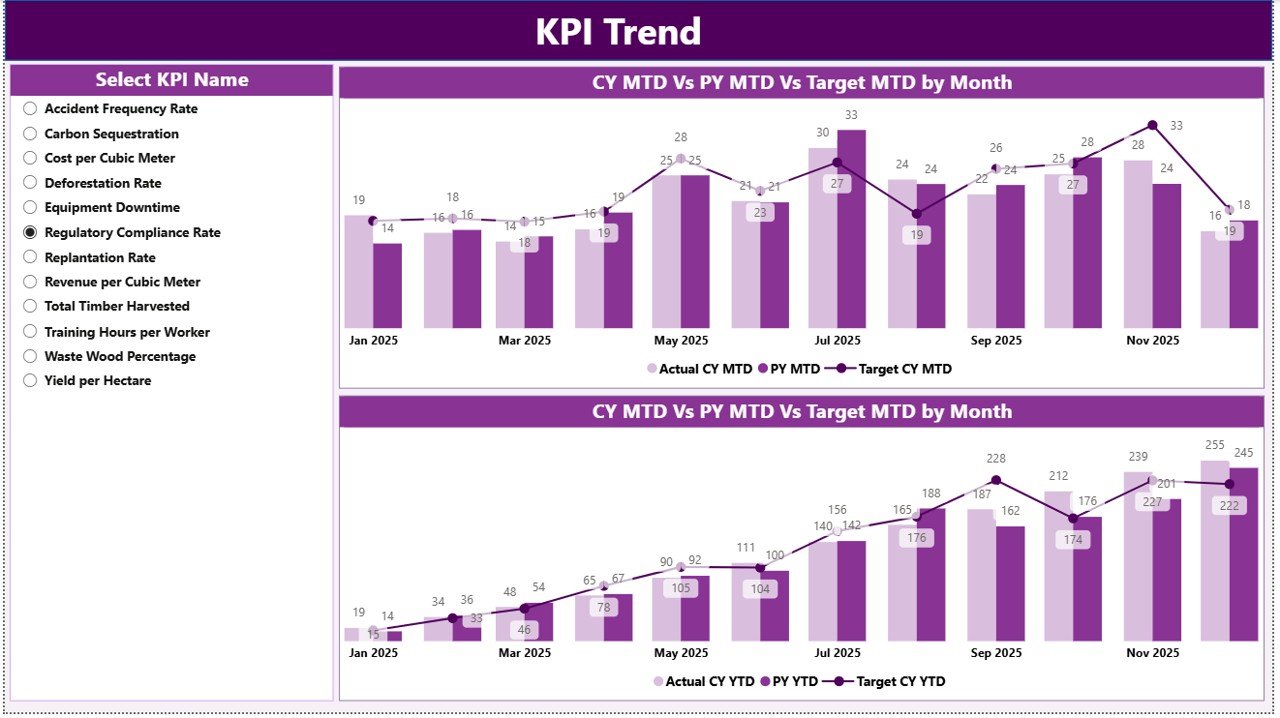
📈 KPI Trend Page
This page focuses on performance movement over time.
Users select a KPI from the slicer and analyze:
-
MTD trend (Actual vs Target vs Previous Year)
-
YTD trend (Actual vs Target vs Previous Year)
As a result, teams identify patterns, seasonality, and performance gaps.
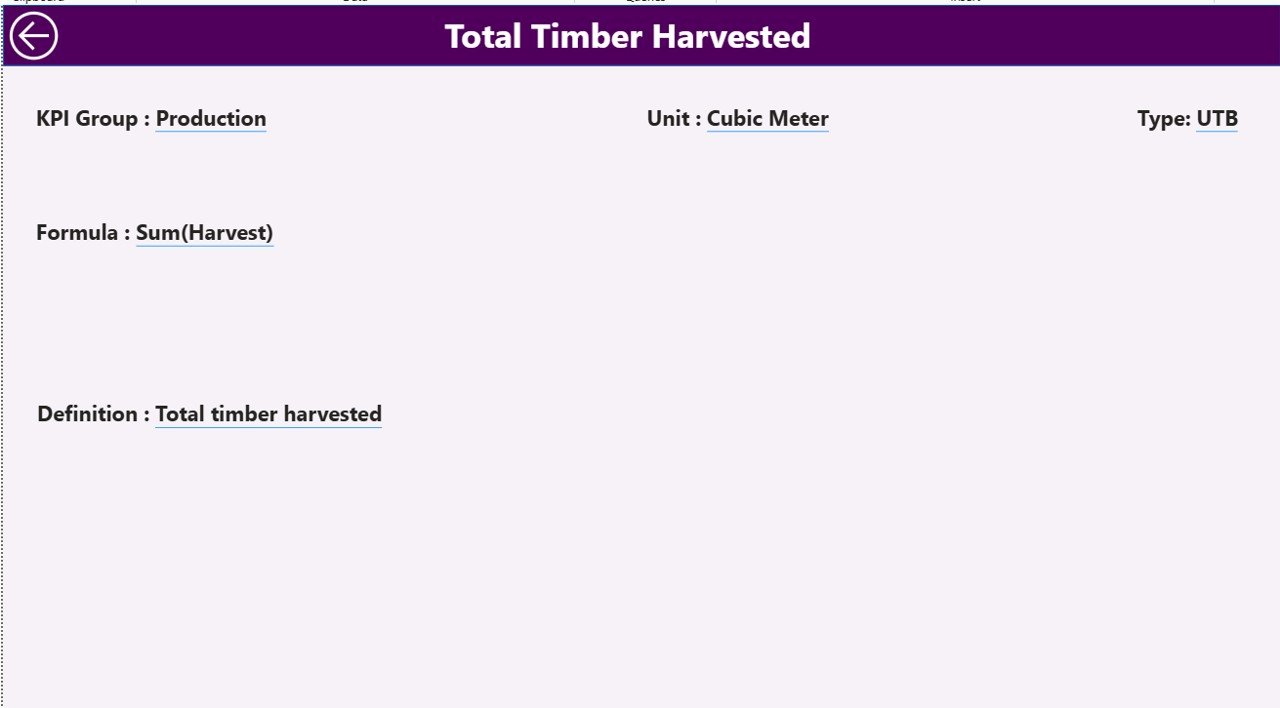
📘 KPI Definition Page (Drill-Through)
This page ensures governance and clarity.
By drilling through from the Summary page, users can view:
-
KPI formula
-
KPI definition
-
KPI unit
-
KPI type (UTB or LTB)
This eliminates confusion and ensures consistent KPI interpretation.
🛠️ How to Use the Forestry KPI Dashboard
✅ Enter actual and target data in the linked Excel file
✅ Refresh the dataset in Power BI
✅ Select month and KPI group using slicers
✅ Review KPI cards and performance tables
✅ Drill into trends and definitions for deeper insights
No advanced Power BI skills are required. The dashboard is intuitive, structured, and business-ready.
👥 Who Can Benefit from This Forestry KPI Dashboard?
🌲 Forestry Managers
🌍 Sustainability & ESG Officers
📊 Operations & Planning Teams
🛡️ Compliance & Safety Teams
🏢 Senior Leadership & Decision-Makers
Whether managing forest operations, conservation programs, or sustainability goals, this dashboard adapts to your needs.
👉 Click here to read the Detailed blog post
▶️ Visit our YouTube channel to learn step-by-step video tutorials
https://youtube.com/@PKAnExcelExpert


Reviews
There are no reviews yet.