

Courier and logistics businesses run on speed, accuracy, and efficiency. A single delayed delivery, cost overrun, or missed target can directly impact customer trust and profitability. That’s why tracking performance manually is no longer enough. The Courier Services KPI Dashboard in Excel is a powerful, ready-to-use solution designed to help courier companies monitor, analyze, and improve operational performance with confidence.
This Excel-based dashboard converts raw courier data into clear, visual, and actionable insights. Instead of juggling multiple spreadsheets, you get a centralized performance view covering deliveries, costs, revenue, targets, and trends. Most importantly, it helps you make faster and smarter decisions without investing in expensive BI tools.
🚀 Key Features of Courier Services KPI Dashboard in Excel
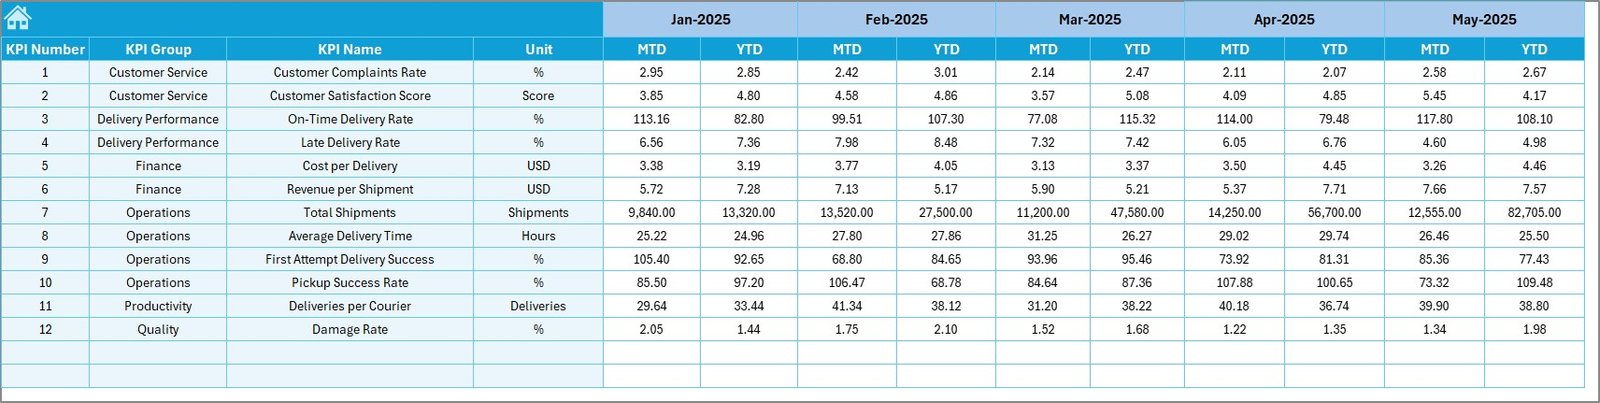
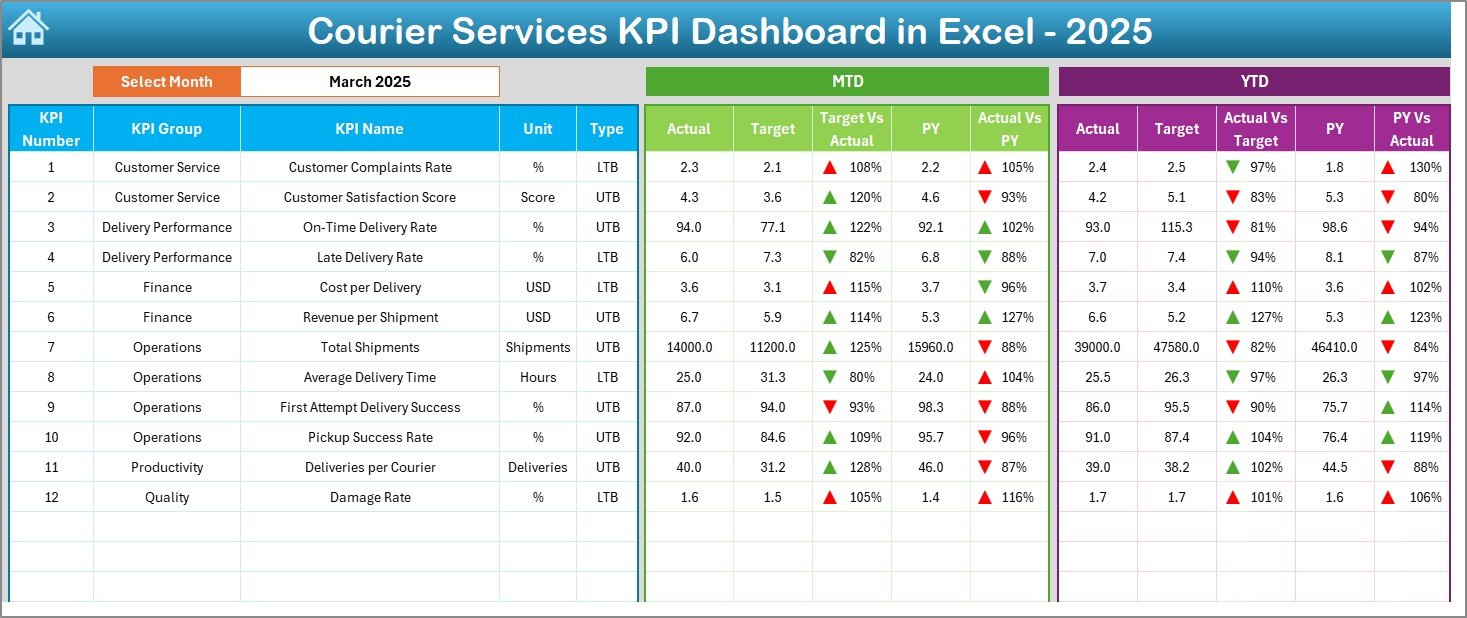
📊 MTD & YTD Performance Tracking – Automatically track Month-to-Date and Year-to-Date performance for all courier KPIs.
🎯 Actual vs Target Comparison – Instantly identify performance gaps with clear target comparisons.
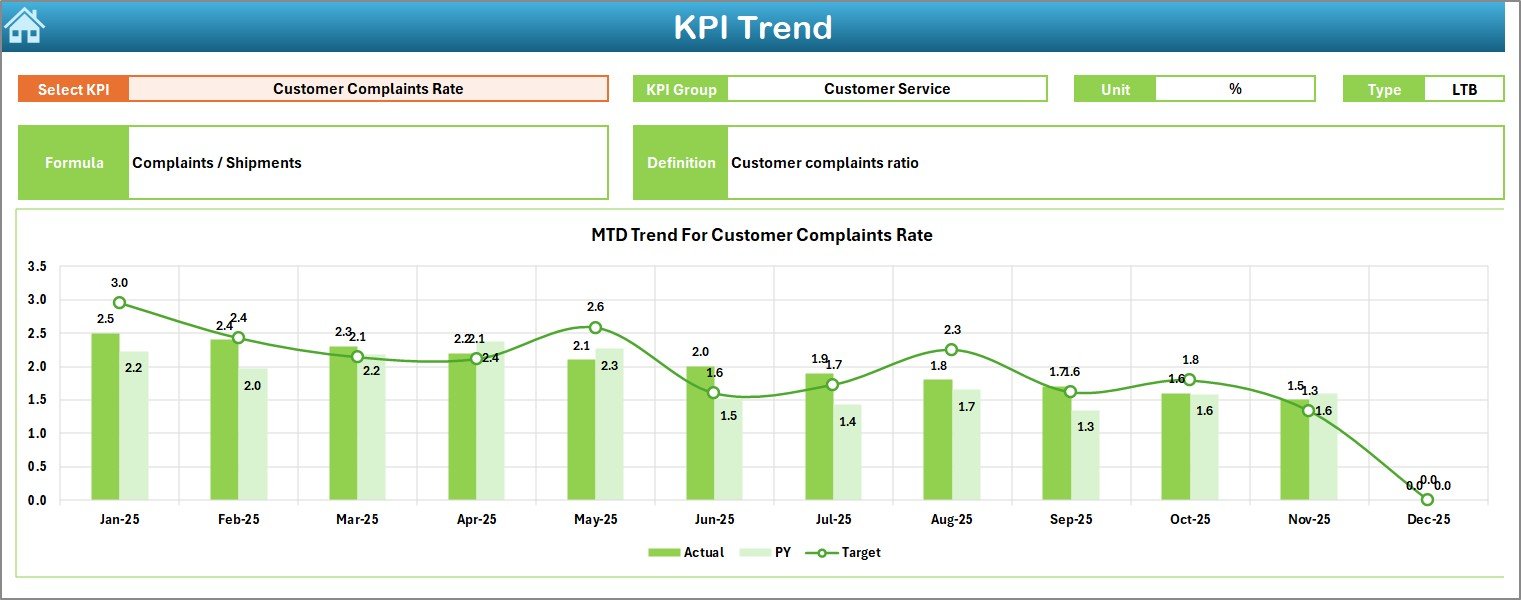
📈 Previous Year Analysis – Compare current results with last year to spot improvement or decline.
🔽 Interactive Month & KPI Selection – Change the month or KPI using simple dropdowns and watch the dashboard update instantly.
🔼 Visual Performance Indicators – Green and red arrows highlight positive and negative trends at a glance.
🧭 Easy Navigation – Built-in navigation buttons make movement across sheets effortless.
🧮 Automated Calculations – No manual formulas required; Excel handles everything in the background.
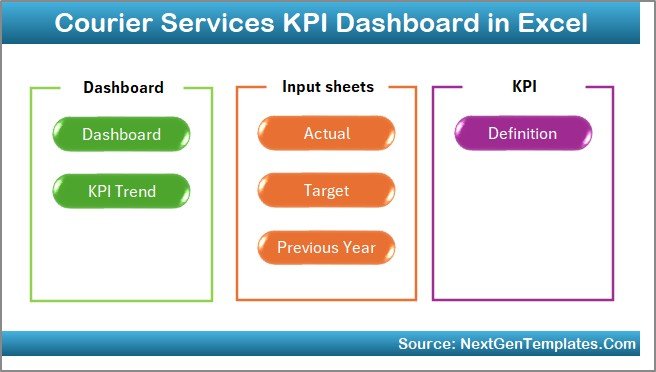
📂 What’s Inside the Courier Services KPI Dashboard in Excel
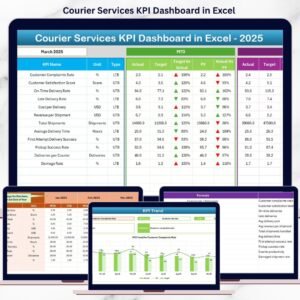
This ready-to-use dashboard includes 7 professionally designed worksheets, each serving a specific purpose:
📌 Summary (Index) Sheet – A clean navigation page with buttons for quick access to all sections.
📊 Dashboard Sheet – Displays all KPIs with MTD, YTD, Target, and Previous Year values using visuals and conditional formatting.
📈 KPI Trend Sheet – Analyze month-wise trends for selected KPIs with Actual, Target, and PY comparisons.
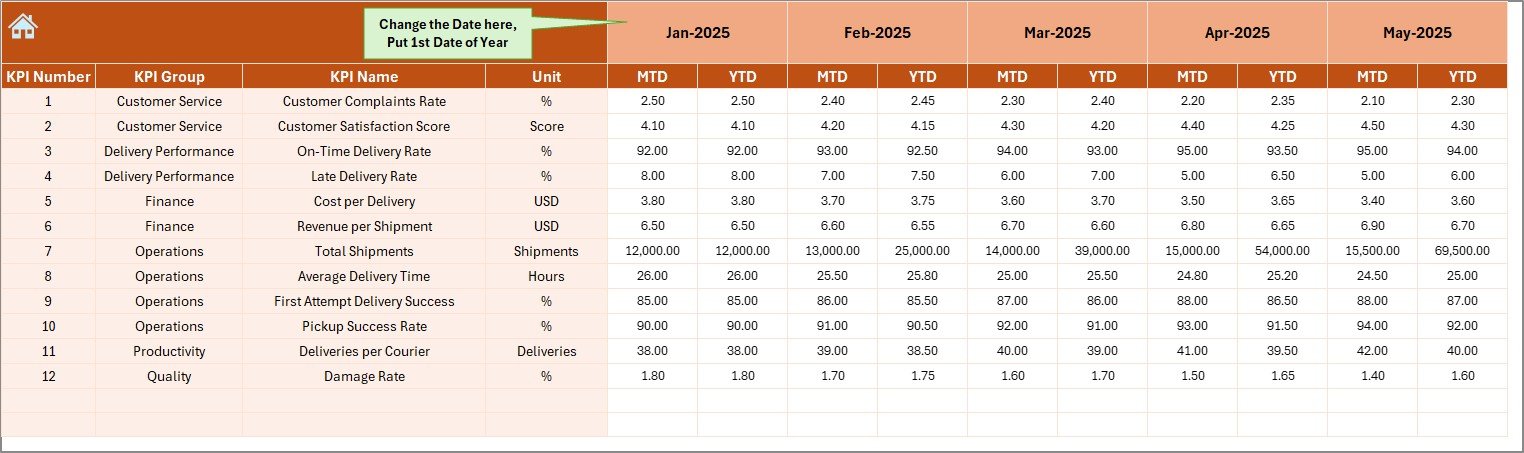
🧾 Actual Numbers Input Sheet – Enter real operational data without disturbing the dashboard layout.
🎯 Target Sheet – Define monthly and YTD targets for each KPI.
📉 Previous Year Numbers Sheet – Store last year’s data for accurate YoY analysis.
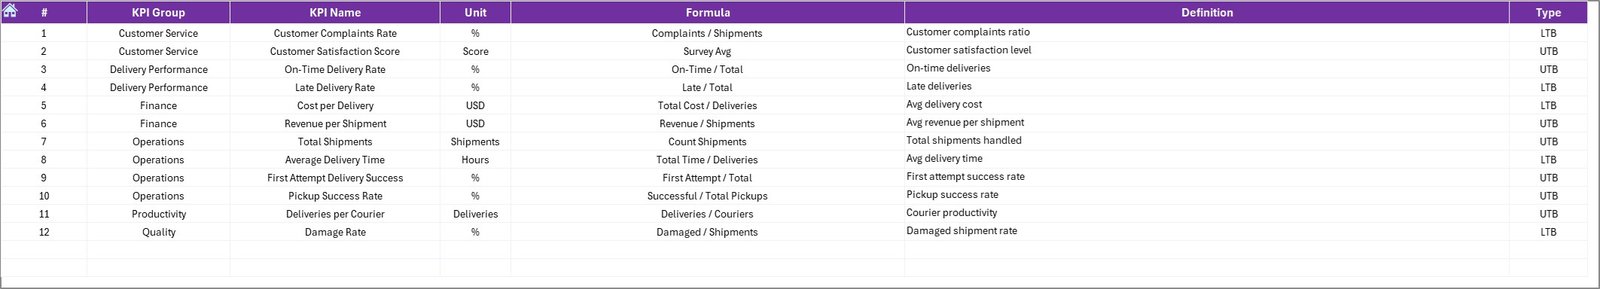
📘 KPI Definition Sheet – Maintain KPI names, units, formulas, groups, and definitions for clarity and consistency.
🛠 How to Use the Courier Services KPI Dashboard in Excel
Using this dashboard is simple and user-friendly:
1️⃣ Enter actual performance data in the Actual Numbers Input Sheet
2️⃣ Define monthly and YTD goals in the Target Sheet
3️⃣ Add last year’s data in the Previous Year Numbers Sheet
4️⃣ Select the month from the dropdown in cell D3
5️⃣ Instantly review performance on the Dashboard and Trend Sheets
No advanced Excel skills are required. Basic Excel knowledge is enough to maintain and operate the dashboard confidently.
👥 Who Can Benefit from This Courier Services KPI Dashboard
📦 Courier & Logistics Company Owners – Gain complete visibility into business performance
🚚 Operations Managers – Track delivery efficiency and identify bottlenecks early
💼 Finance Teams – Monitor costs, revenue, and profitability
📊 Business Analysts – Perform trend, variance, and comparative analysis
🧑💼 Fleet & Delivery Supervisors – Improve accountability and operational control
Whether you run a small courier firm or a large logistics operation, this dashboard adapts easily to your business size.
Click here to read the Detailed blog post
Watch the step-by-step video tutorial:


Reviews
There are no reviews yet.