4D printing is no longer just a futuristic concept—it is already transforming manufacturing, materials science, and product innovation. However, advanced technology alone does not guarantee success. Without proper performance tracking, even the most innovative 4D printing initiatives can suffer from inefficiencies, cost overruns, and missed opportunities.
That is exactly why the 4D Printing KPI Dashboard in Power BI becomes a game-changing performance management solution.
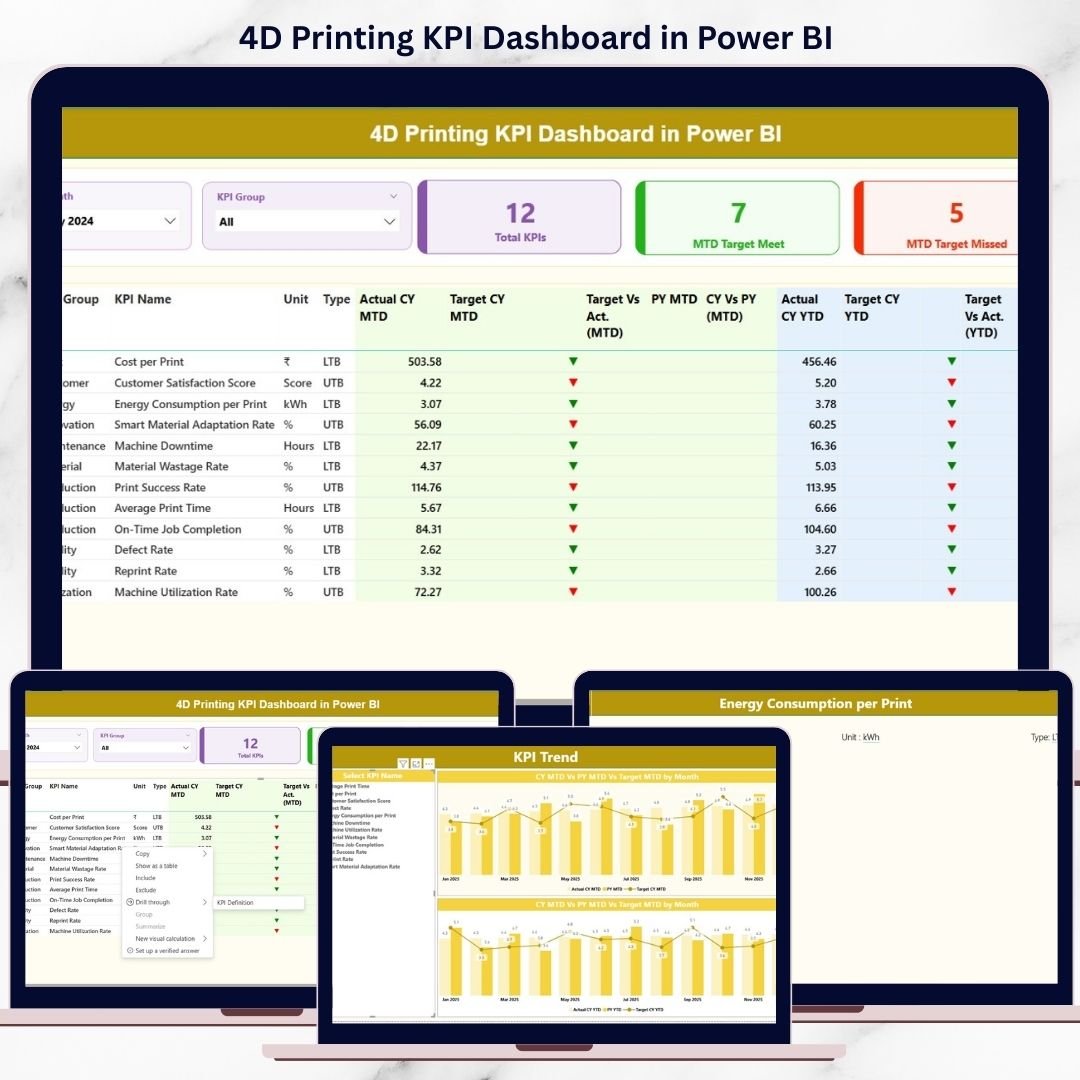
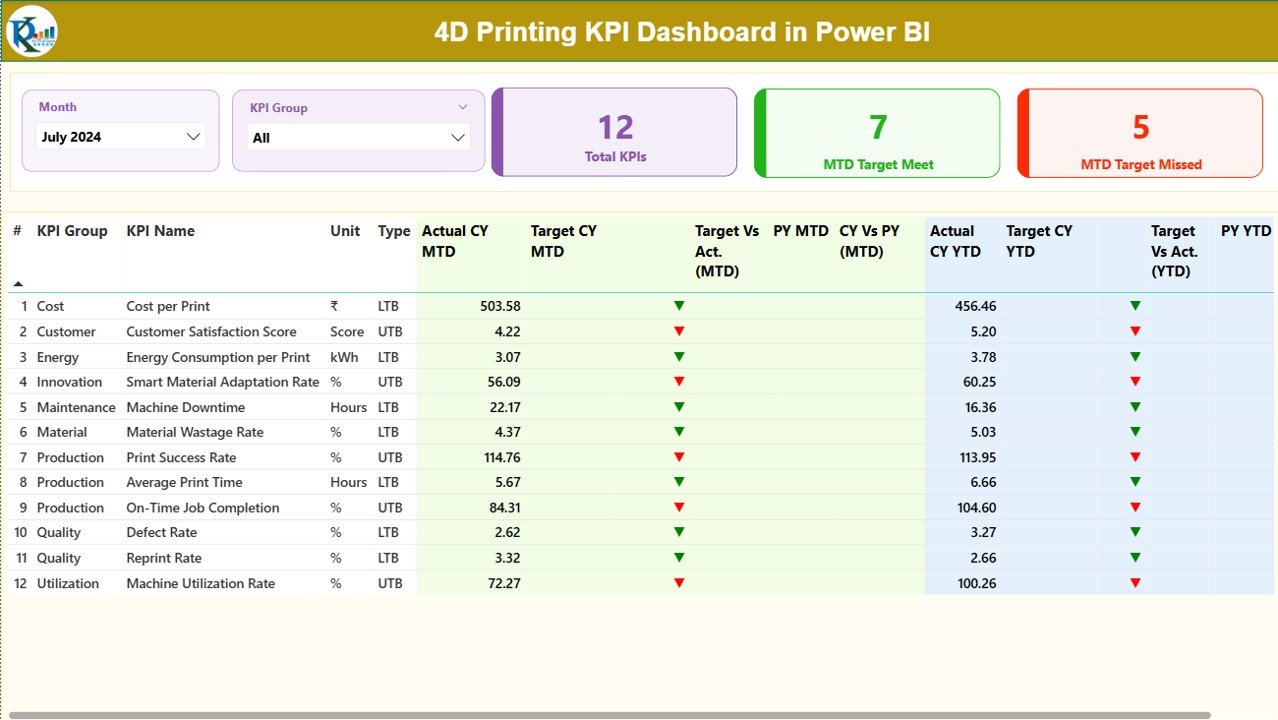
This professionally designed digital dashboard helps organizations monitor, analyze, and improve their 4D printing operations using clear KPIs, interactive visuals, and standardized performance logic. Instead of juggling multiple Excel files or manual reports, you get one centralized Power BI dashboard that delivers instant clarity and control.
Whether you manage smart materials, adaptive manufacturing processes, or R&D-driven innovation, this dashboard transforms raw data into actionable insights—fast, simple, and reliable.
🔑 Key Features of the 4D Printing KPI Dashboard in Power BI
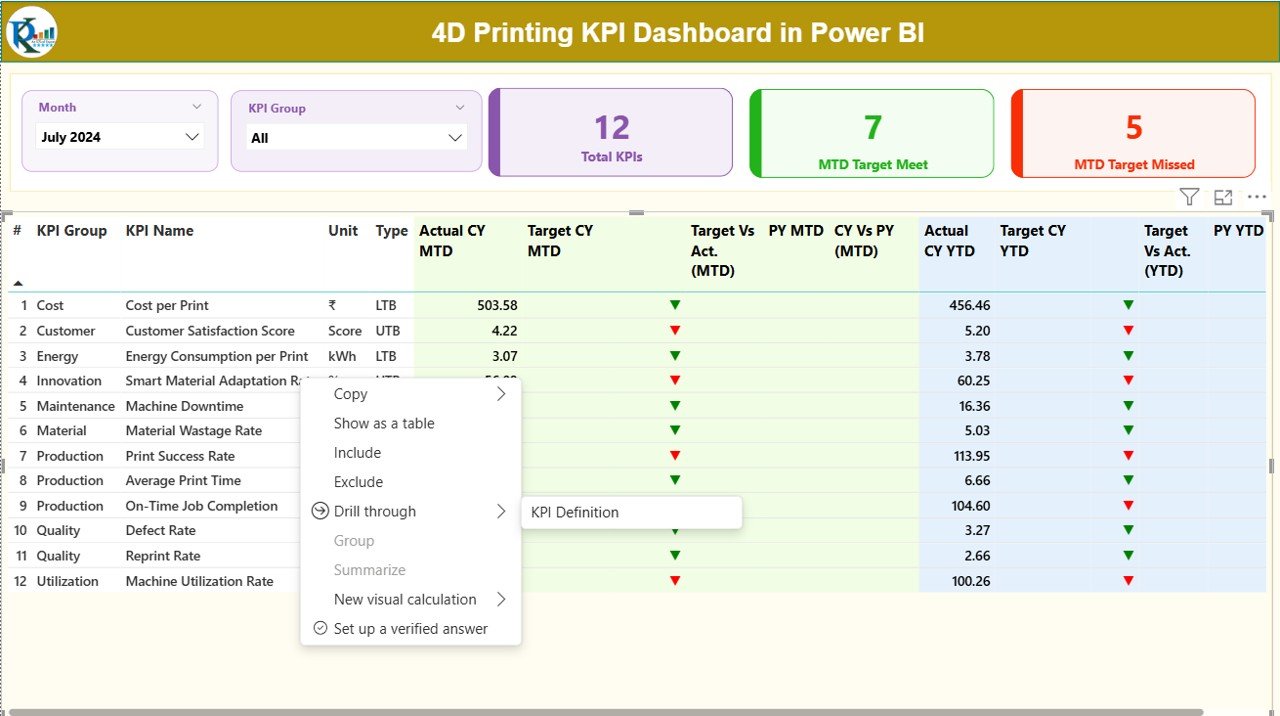
⚙️ Interactive Month & KPI Group Slicers to analyze performance instantly
📊 MTD & YTD tracking for short-term execution and long-term progress
🎯 Actual vs Target vs Previous Year comparison for complete performance context
🔼🔽 Automatic performance icons using LTB (Lower the Better) and UTB (Upper the Better) logic
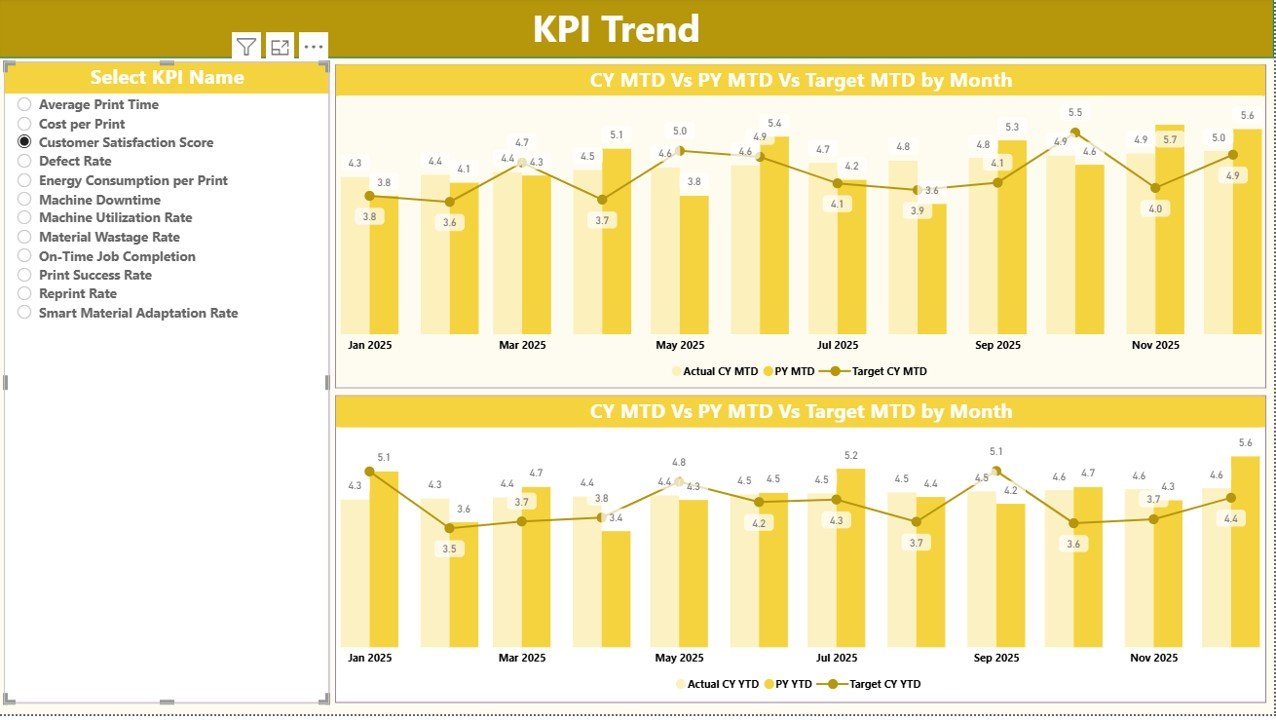
📈 KPI trend analysis with clear combo charts for historical insights
🧮 Standardized KPI formulas for consistent and accurate evaluation
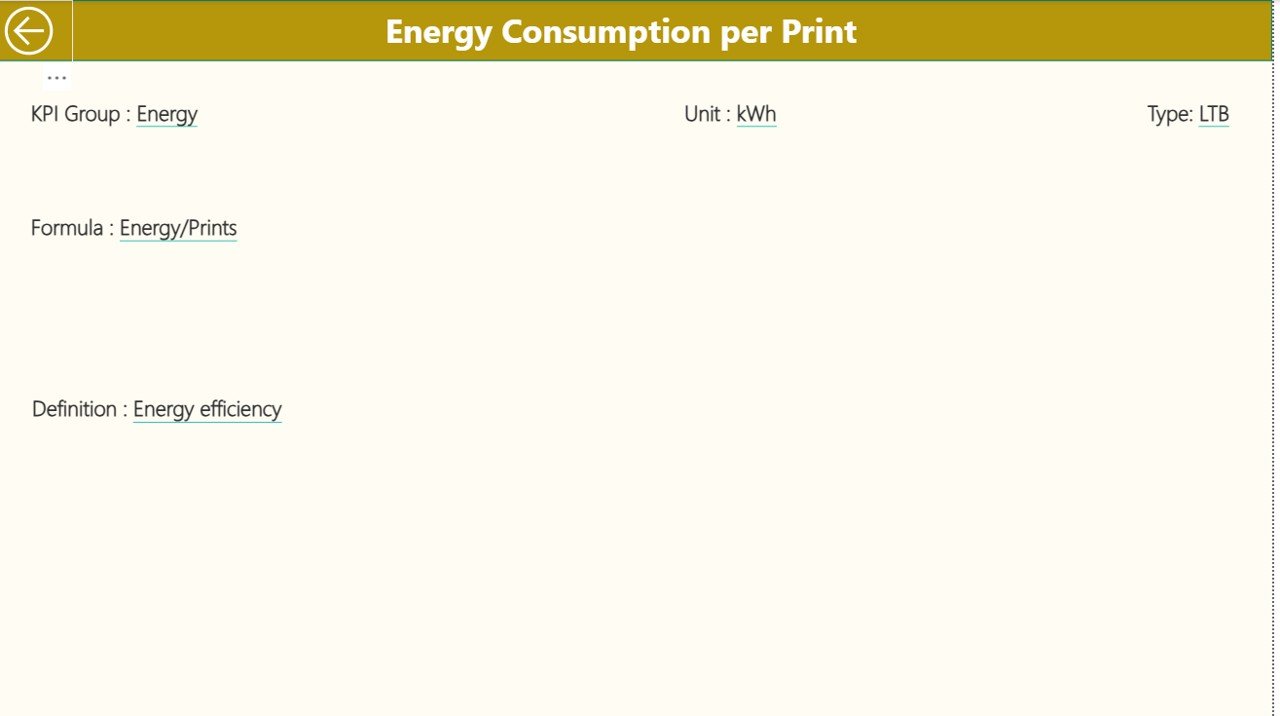
📘 KPI Definition Page to eliminate confusion and ensure governance
⏱️ Time-saving automation that replaces manual reporting
🔄 Easy Excel data refresh without complex Power BI modeling
Each feature is designed to help decision-makers identify gaps, track progress, and take action confidently.
📦 What’s Inside the 4D Printing KPI Dashboard
📄 Power BI Desktop File with 3 structured pages
📊 Summary Page showing KPI counts, target met/missed status, and detailed KPI table
📈 KPI Trend Page with MTD & YTD performance trends
📘 KPI Definition Page for formulas, definitions, and KPI purpose
📂 Excel Data Source Structure including:
-
Input_Actual Sheet
-
Input_Target Sheet
-
KPI Definition Sheet
This clean structure ensures easy maintenance, scalability, and long-term usability.
⚙️ How to Use the 4D Printing KPI Dashboard
Using the dashboard is simple—even for beginners.
📝 Step 1: Update monthly actual values in the Input_Actual Excel sheet
🎯 Step 2: Enter targets in the Input_Target sheet
📘 Step 3: Maintain KPI details in the KPI Definition sheet
🔄 Step 4: Refresh the Power BI report
📊 Step 5: Analyze MTD, YTD, trends, and performance icons instantly
No advanced Power BI knowledge is required. The dashboard handles all calculations and logic automatically.
👥 Who Can Benefit from This 4D Printing KPI Dashboard?
🏭 Manufacturing & Production Managers monitoring advanced printing operations
🧪 R&D Teams tracking innovation performance and efficiency
📊 Operations & Performance Analysts seeking standardized KPI reporting
💼 Business Leaders & Executives needing clear performance visibility
🎓 Consultants & Trainers working on Industry 4.0 and smart manufacturing
🚀 Startups & Enterprises investing in 4D printing technologies
If performance visibility matters to you, this dashboard is built for your needs.
Click here to read the Detailed blog post
Watch the step-by-step video tutorial:


Reviews
There are no reviews yet.