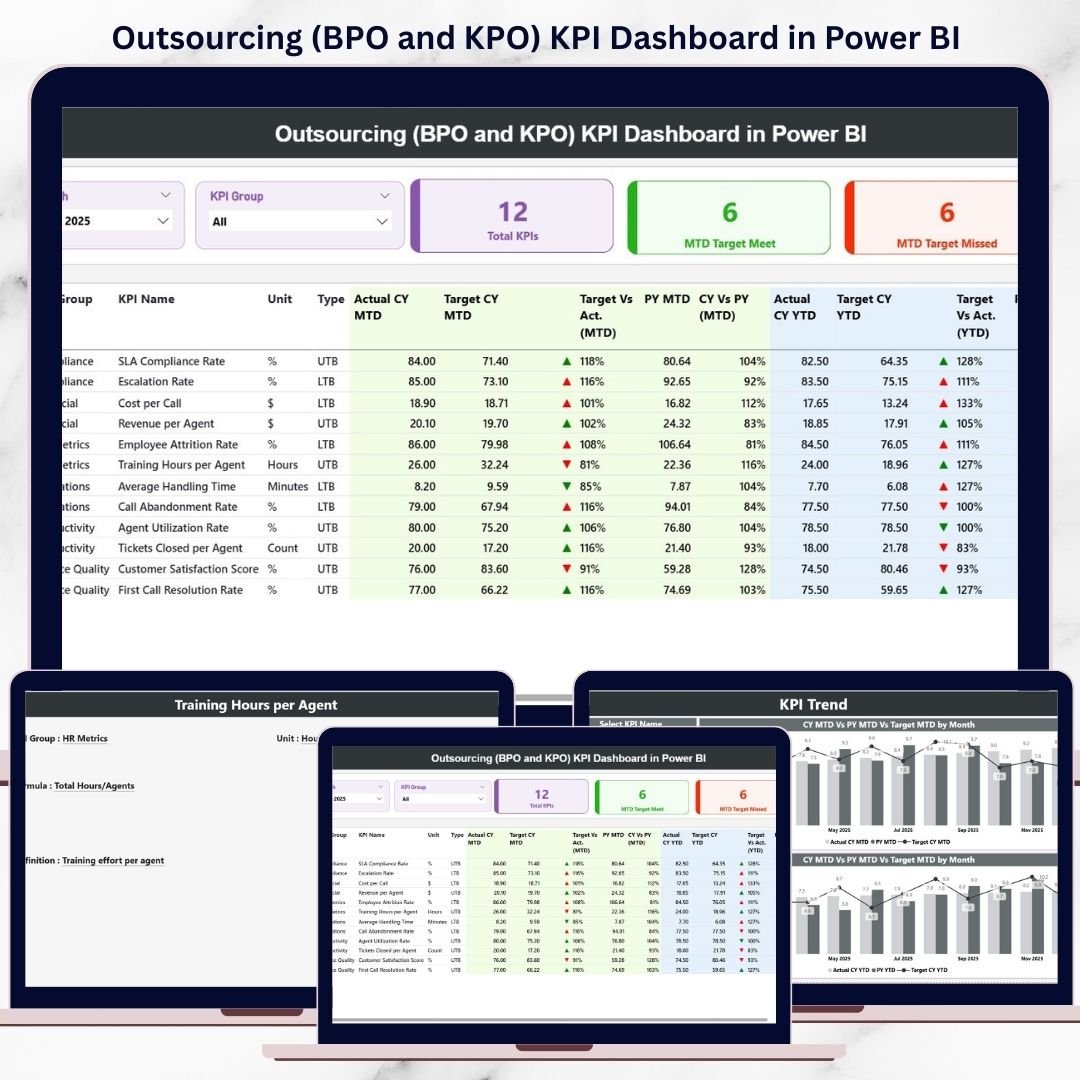
In today’s highly competitive outsourcing industry, performance transparency is no longer optional—it is critical. Business Process Outsourcing (BPO) and Knowledge Process Outsourcing (KPO) organizations handle large teams, multiple clients, strict SLAs, and demanding productivity targets. Outsourcing (BPO and KPO) KPI Dashboard in Power BI However, many outsourcing firms still rely on static Excel reports, manual calculations, and delayed reviews. As a result, performance gaps, SLA risks, and quality issues often surface too late.
Outsourcing (BPO and KPO) KPI Dashboard in Power BI That is exactly why the Outsourcing (BPO and KPO) KPI Dashboard in Power BI becomes a game-changing solution 🚀.
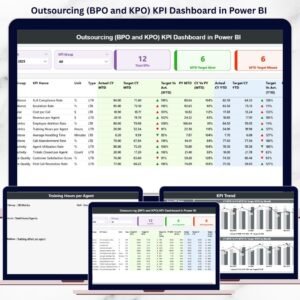
Outsourcing (BPO and KPO) KPI Dashboard in Power BI This ready-to-use Power BI dashboard converts raw operational data into clear, interactive, and actionable insights. Instead of switching between multiple reports for productivity, quality, finance, and SLAs, managers and leaders can monitor everything from one centralized Power BI dashboard. Moreover, the dashboard provides real-time MTD (Month-to-Date) and YTD (Year-to-Date) visibility, visual performance indicators, and trend analysis to support faster and smarter decisions.
Built using Excel as a data source and Power BI for analytics, this dashboard combines ease of data entry with enterprise-grade visualization—making it ideal for modern outsourcing organizations.
⭐ Key Features of Outsourcing (BPO and KPO) KPI Dashboard in Power BI
📊 Centralized Outsourcing Performance Monitoring
Track operational, quality, financial, and SLA KPIs in one interactive dashboard.
⏱️ MTD & YTD Performance Tracking
Monitor short-term and long-term performance with automatic calculations.
🎯 Target vs Actual vs Previous Year Comparison
Instantly identify performance gaps and improvement areas.
📈 Interactive KPI Trend Analysis
Analyze historical performance using MTD and YTD combo charts.
⚠️ Visual Performance Indicators (Icons)
Green ▲ and Red ▼ icons highlight target met and target missed KPIs instantly.
🎛️ Dynamic Slicers & Drill-Through
Filter by month, KPI group, or KPI name and drill into KPI definitions easily.
📦 What’s Inside the Outsourcing (BPO and KPO) KPI Dashboard in Power BI
This professionally designed Power BI file includes 3 powerful analytical pages, supported by structured Excel input sheets.
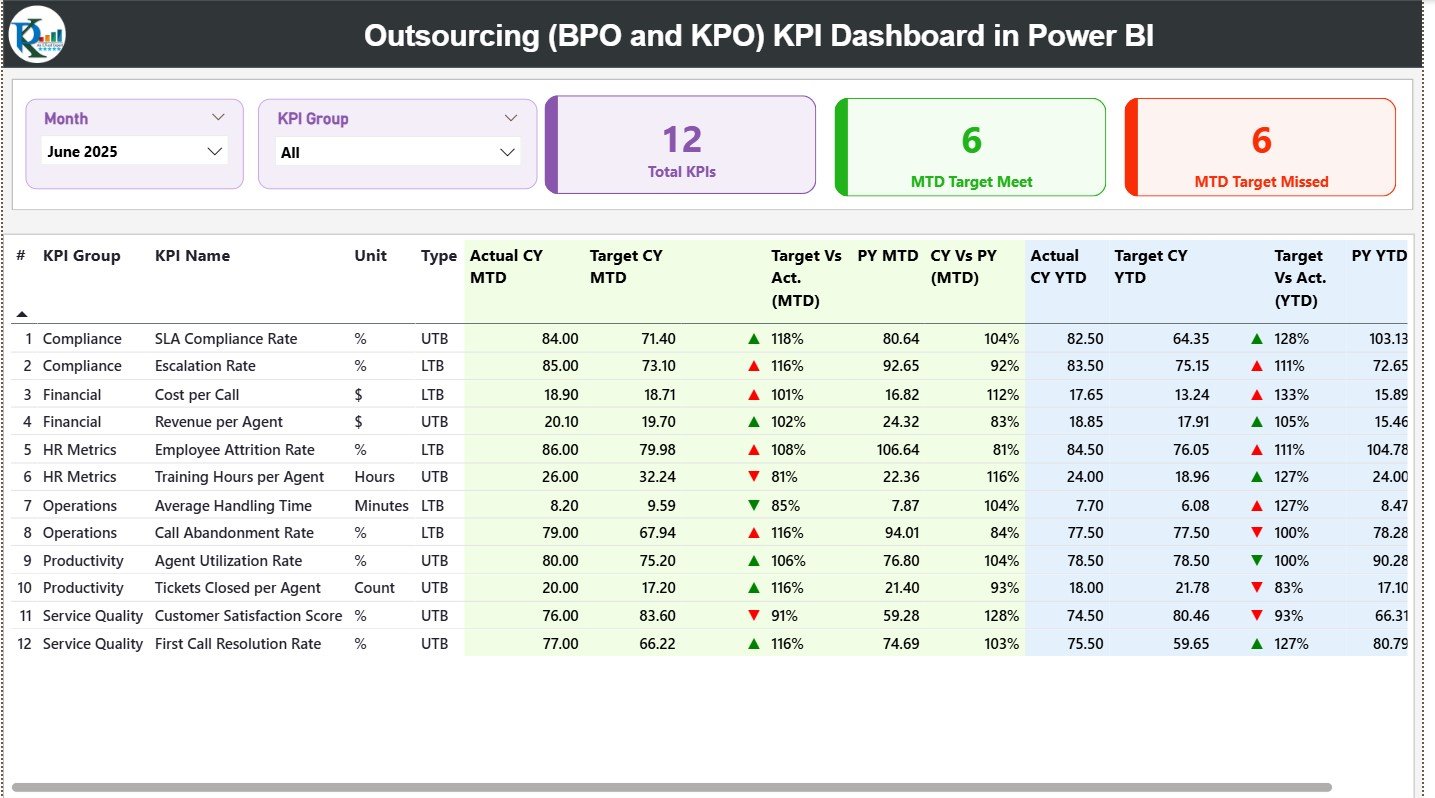
📊 Summary Page
The main performance overview page featuring:
-
Month slicer
-
KPI Group slicer
🔹 KPI Cards
-
Total KPIs Count
-
MTD Target Met Count
-
MTD Target Missed Count
🔹 Detailed KPI Table
Displays:
-
KPI Number, Group, Name, Unit, Type (LTB/UTB)
-
Actual CY MTD, Target CY MTD, MTD Icon
-
Target vs Actual (MTD %), PY MTD, CY vs PY (MTD %)
-
Actual CY YTD, Target CY YTD, YTD Icon
-
Target vs Actual (YTD %), PY YTD, CY vs PY (YTD %)
This layout provides complete KPI visibility in one view.
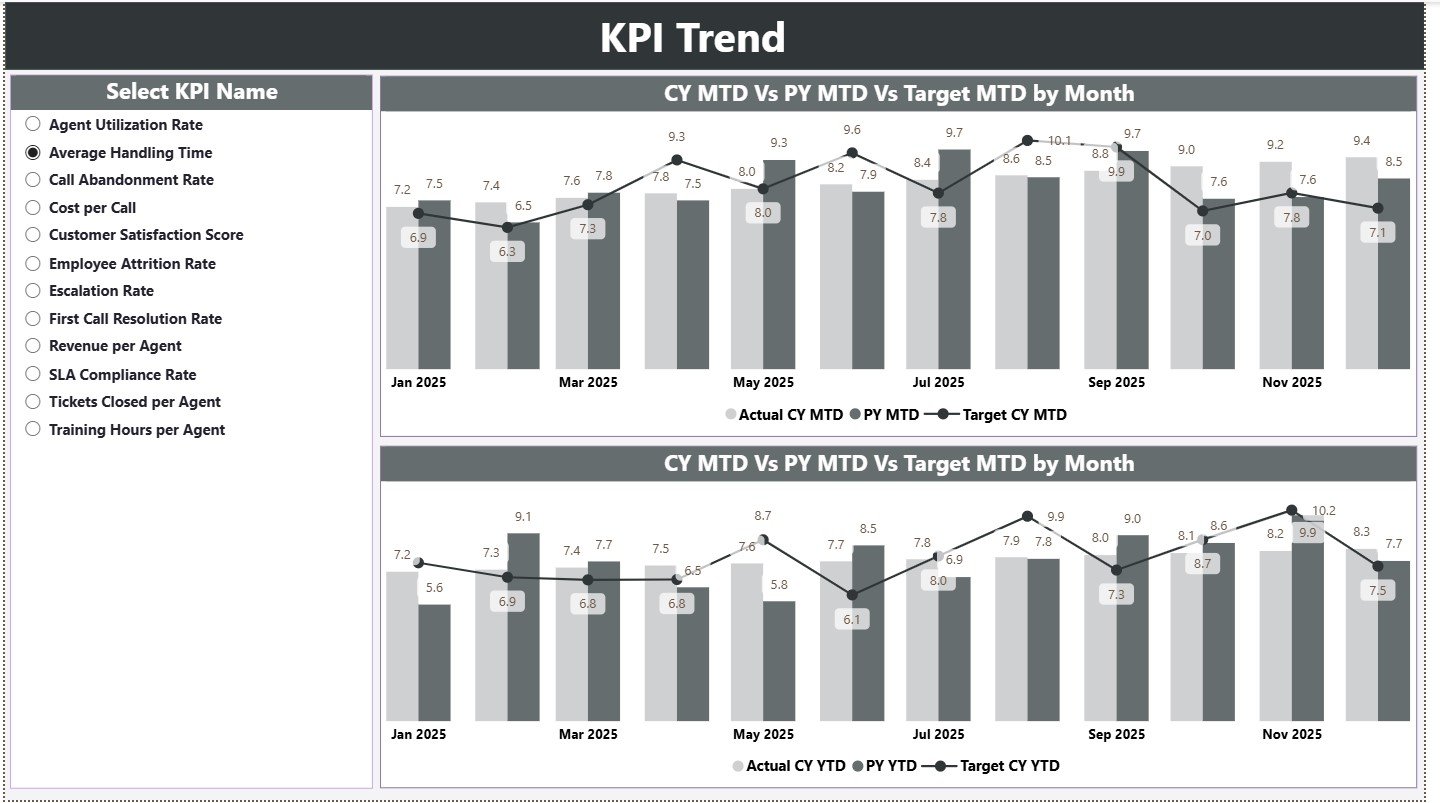
📈 KPI Trend Page
Designed for deep performance analysis.
🔹 KPI Name Slicer
Select a KPI to analyze performance trends.
🔹 MTD Trend Combo Chart
-
Current Year Actual
-
Target
-
Previous Year
🔹 YTD Trend Combo Chart
-
Current Year Actual
-
Target
-
Previous Year
These visuals help managers understand performance patterns instead of isolated numbers.
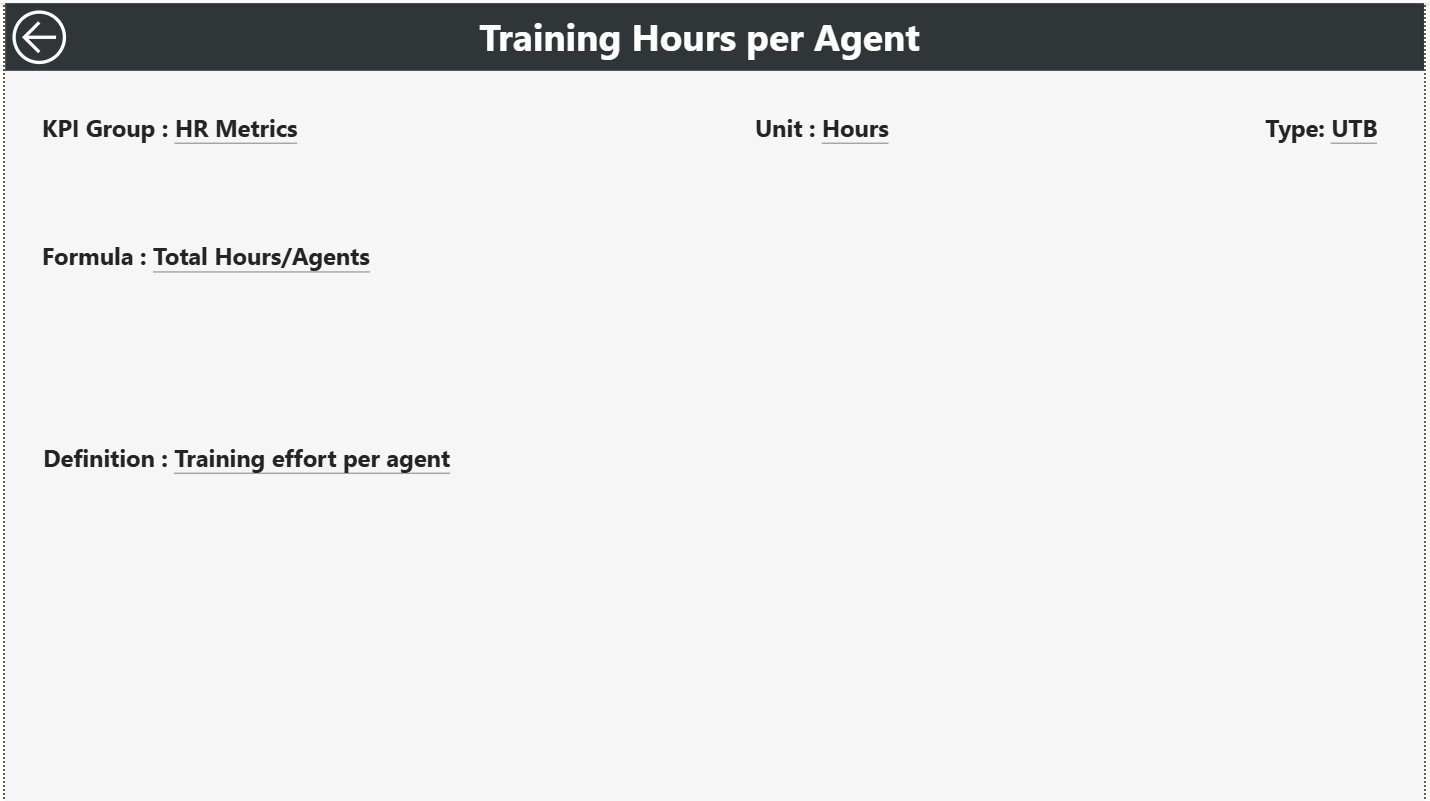
📘 KPI Definition Page (Drill-Through)
A hidden drill-through page that provides clarity and governance.
🔹 Displays:
-
KPI Formula
-
KPI Definition
Users can drill through from the Summary Page and return easily using the Back button.
🛠️ How to Use the Outsourcing KPI Dashboard in Power BI
Using this dashboard is simple and scalable:
1️⃣ Enter Actual KPI values in the Input Actual Excel sheet
2️⃣ Enter Target KPI values in the Input Target Excel sheet
3️⃣ Maintain KPI logic in the KPI Definition sheet
4️⃣ Refresh Power BI to update visuals
5️⃣ Use slicers, icons, and trend charts for analysis
Because calculations and visuals are automated, reporting becomes faster and more reliable.
👥 Who Can Benefit from This Outsourcing KPI Dashboard
This dashboard is ideal for:
📞 BPO & KPO Operations Managers
📦 Delivery & Account Managers
🎯 Quality & Compliance Teams
💰 Finance & Billing Teams
📊 Process Excellence Teams
👔 Senior Leadership
Any outsourcing organization focused on SLA compliance and performance improvement will benefit from this dashboard.


Reviews
There are no reviews yet.