The wind energy sector is growing rapidly as organizations shift toward clean, renewable, and sustainable power generation. Wind Energy KPI Scorecard in Excel However, managing wind energy operations efficiently requires continuous monitoring of energy output, turbine availability, downtime, and overall plant performance. Without a structured reporting system, decision-makers often struggle to identify underperformance, energy losses, or operational risks at the right time.
Wind Energy KPI Scorecard in Excel That is exactly why the Wind Energy KPI Scorecard in Excel becomes a powerful and practical solution 📊🌱.
Wind Energy KPI Scorecard in Excel This ready-to-use Excel scorecard converts raw wind energy data into clear, structured, and actionable insights. Instead of working with multiple spreadsheets or static reports, wind energy operators and plant managers can track Month-to-Date (MTD) and Year-to-Date (YTD) performance from one centralized scorecard. Because everything is built in Microsoft Excel, the scorecard remains flexible, cost-effective, and easy to use—without the need for expensive software or advanced technical skills.
Designed specifically for wind farms, renewable energy companies, and operations teams, this scorecard helps organizations move from reactive monitoring to proactive performance management.
⭐ Key Features of Wind Energy KPI Scorecard in Excel
📊 Centralized KPI Monitoring
Track all critical wind energy KPIs in one structured scorecard.
📅 MTD & YTD Performance Analysis
Monitor short-term monthly results and long-term yearly performance together.
🎯 Actual vs Target Comparison
Instantly identify whether energy output and operational KPIs meet targets.
📈 Trend Analysis with Charts
Analyze performance patterns, seasonality, and long-term trends.
🧭 User-Friendly Excel Design
Simple dropdowns and visuals make analysis easy for all users.
🧩 Fully Customizable KPIs
Add, modify, or adjust KPIs based on plant or project requirements.
📦 What’s Inside the Wind Energy KPI Scorecard in Excel
This professionally designed Excel workbook includes four well-structured worksheets, each serving a specific purpose:
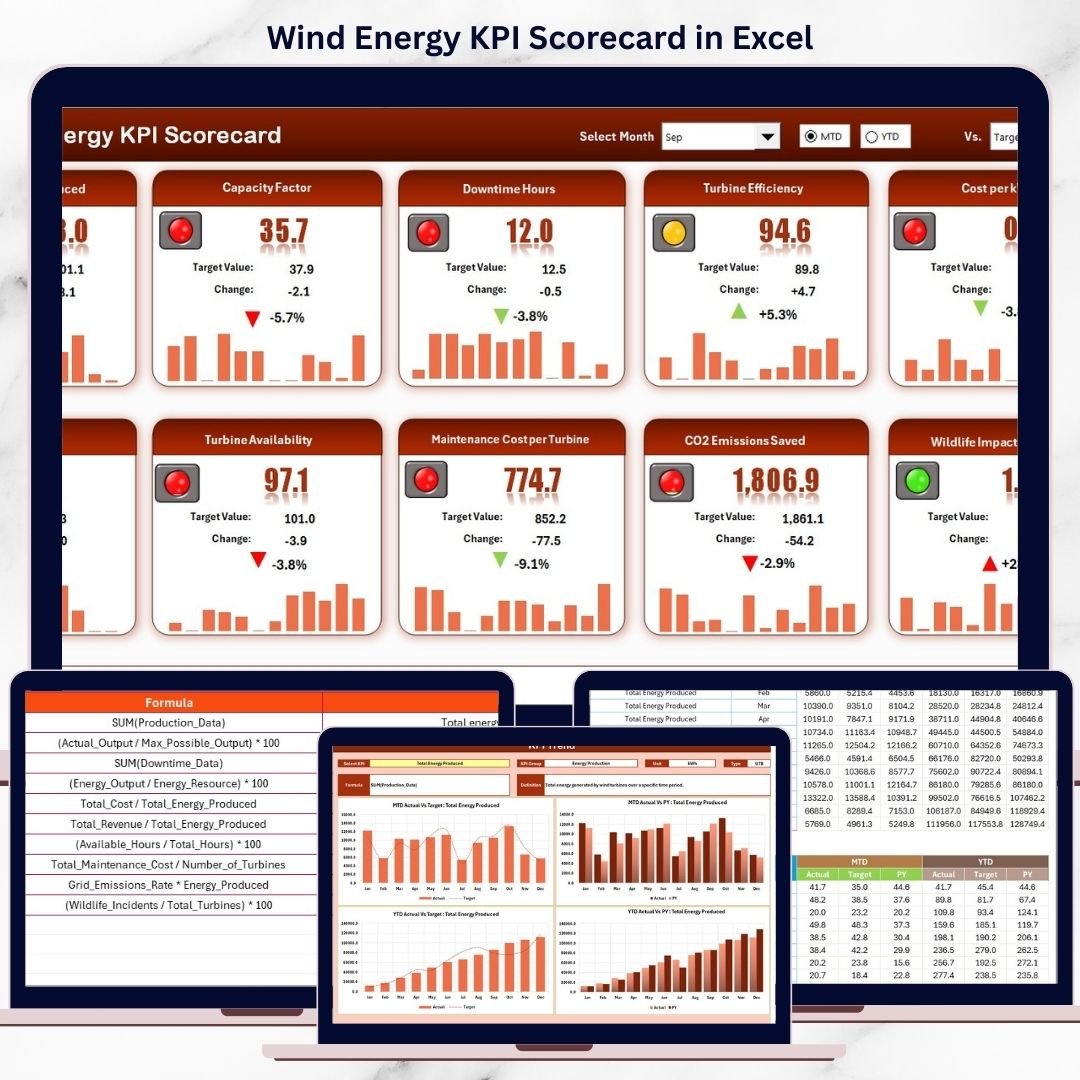
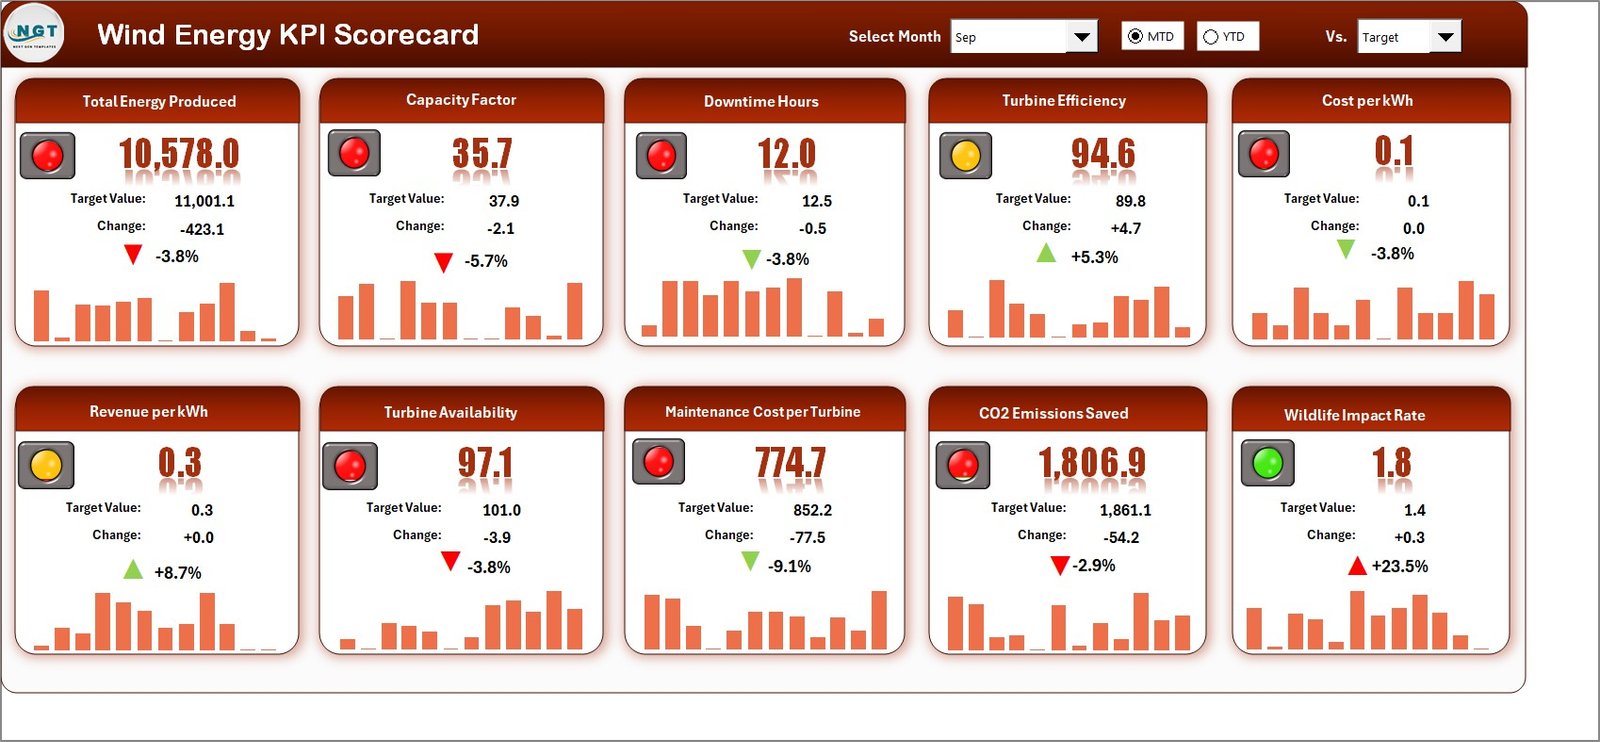
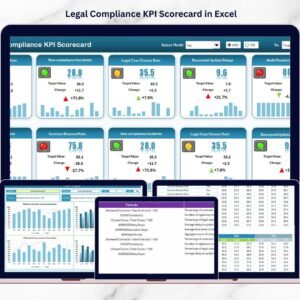
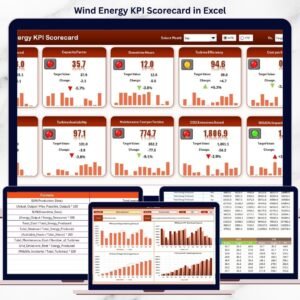
📊 Scorecard Sheet
The main performance dashboard that displays:
-
Month selection dropdown
-
MTD and YTD view selection
-
Actual vs Target KPI values
-
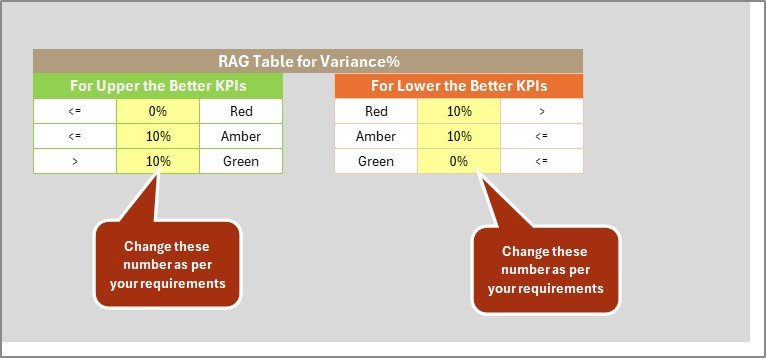
Color-coded indicators and conditional formatting for quick insights
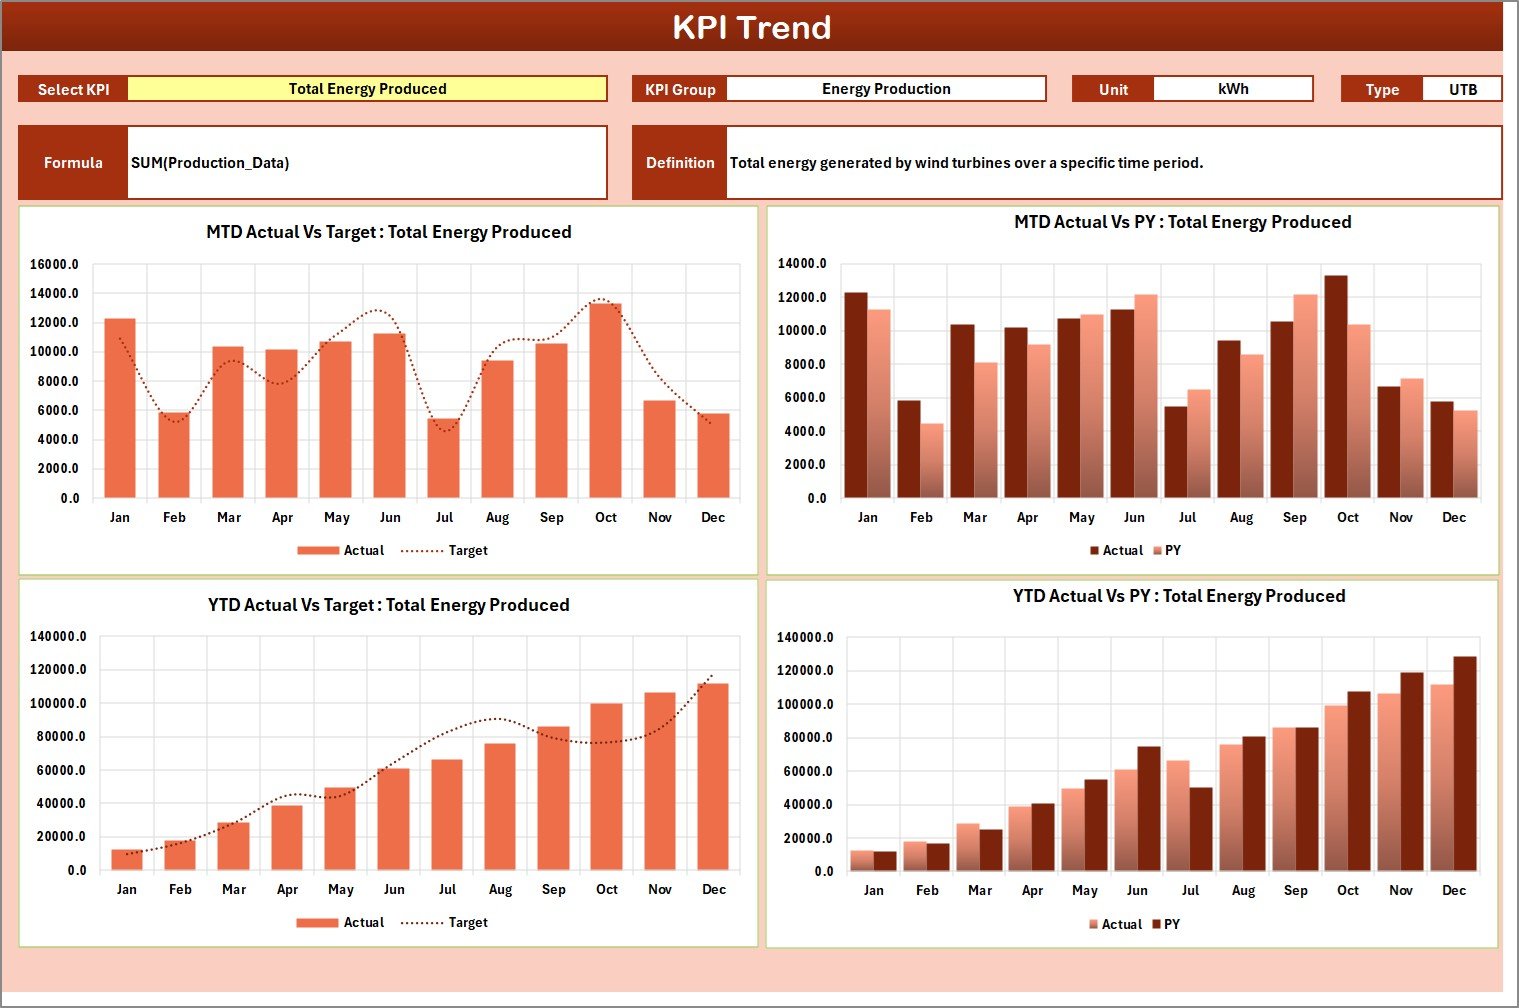
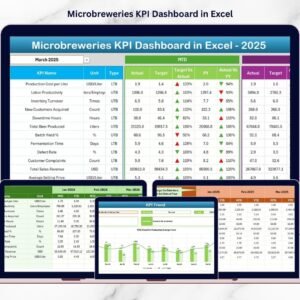
📈 KPI Trend Sheet
Supports in-depth KPI analysis with:
-
KPI selection dropdown (cell C3)
-
KPI group, unit, type (LTB/UTB), formula, and definition
-
MTD and YTD trend charts comparing Actual, Target, and Previous Year values
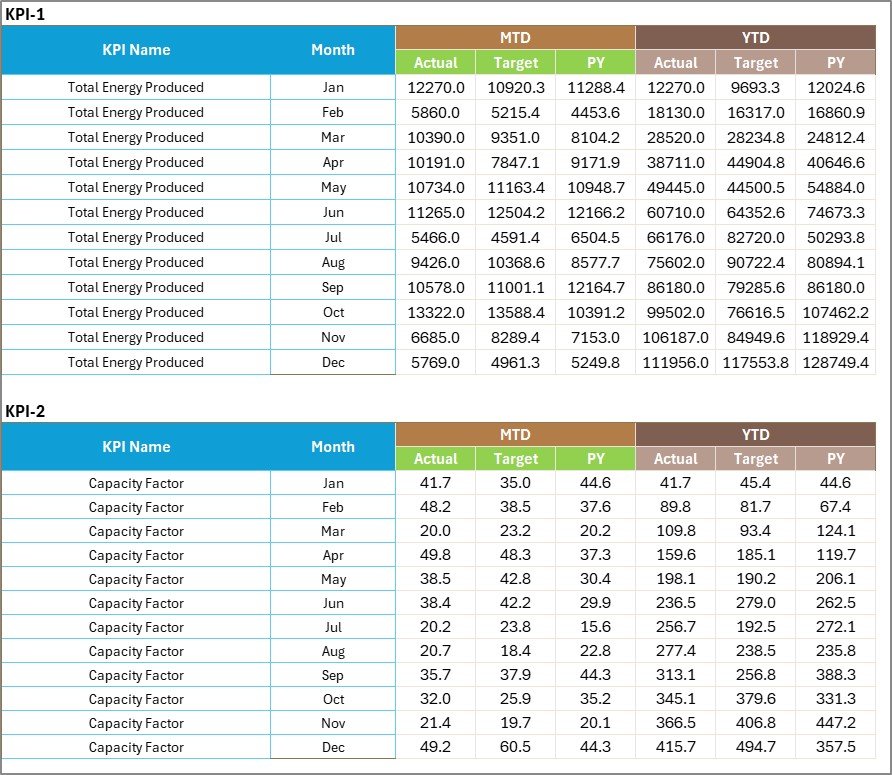
📝 Input Data Sheet
The centralized data entry sheet where users input:
-
Actual KPI values
-
Target KPI values
-
Monthly operational data
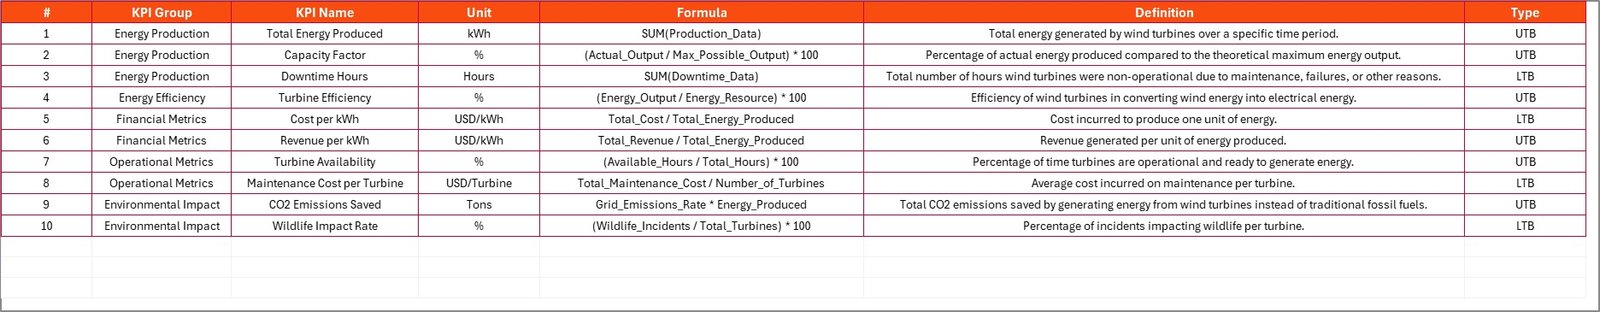
📘 KPI Definition Sheet
Acts as a governance and reference page containing:
-
KPI Name
-
KPI Group
-
Unit of measurement
-
KPI Formula
-
KPI Definition
This structure ensures clarity, consistency, and transparency across teams.
🛠️ How to Use the Wind Energy KPI Scorecard in Excel
Using the scorecard is simple and efficient:
1️⃣ Enter actual and target data in the Input Data sheet
2️⃣ Select the reporting month
3️⃣ Choose MTD or YTD view
4️⃣ Review KPI performance and indicators
5️⃣ Analyze trends and take corrective actions
Because calculations and visuals update automatically, teams save time and reduce manual errors.
👥 Who Can Benefit from This Wind Energy KPI Scorecard in Excel
This scorecard is ideal for:
🌬️ Wind Farm Managers
⚙️ Operations & Maintenance Teams
📊 Renewable Energy Analysts
🏭 Plant Heads
📈 Energy Planning Teams
🌱 Sustainability & Reporting Teams
Whether managing a single wind farm or multiple sites, this scorecard adapts easily to your operational needs.


Reviews
There are no reviews yet.