Managing finance and accounting performance has become more complex than ever. Organizations must track revenue, costs, profitability, cash flow, and efficiency in real time. Finance and Accounting KPI Dashboard in Power BI However, many finance teams still rely on static Excel reports, delayed files, and manual calculations. As a result, insights arrive late, risks remain hidden, and decision-making becomes reactive.
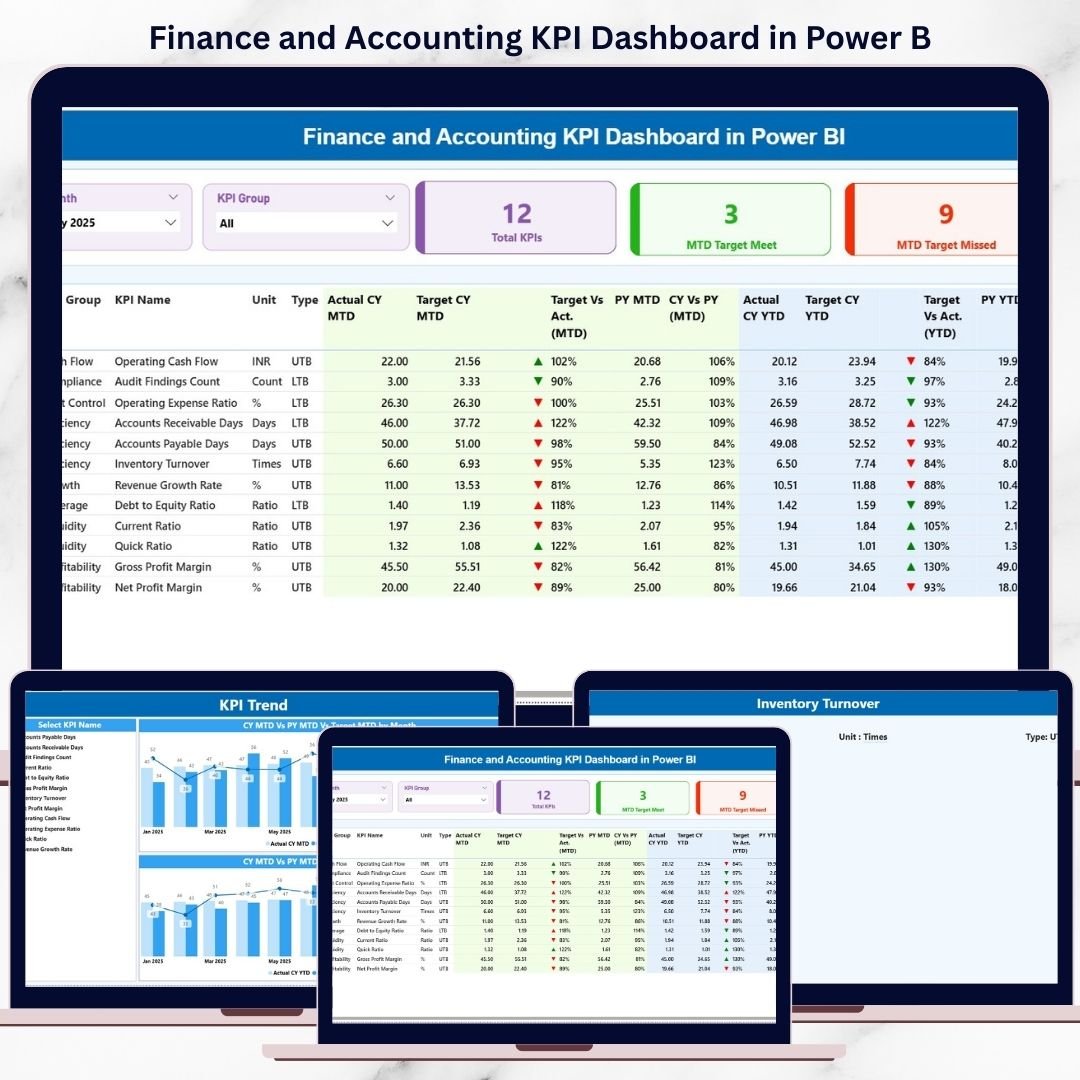
Finance and Accounting KPI Dashboard in Power BI That is exactly why the Finance and Accounting KPI Dashboard in Power BI becomes a critical solution for modern financial management 🚀.
Finance and Accounting KPI Dashboard in Power BI This ready-to-use Power BI dashboard transforms raw financial data into interactive, visual, and actionable insights. Instead of reviewing multiple spreadsheets, finance leaders can monitor Month-to-Date (MTD) and Year-to-Date (YTD) performance from one centralized dashboard. Because Power BI supports slicers, KPI cards, icons, and drill-through analysis, users gain clarity instantly and act with confidence.
Built with Excel as the data source and Power BI as the analytics engine, this dashboard keeps data entry simple while delivering enterprise-grade reporting.
⭐ Key Features of Finance and Accounting KPI Dashboard in Power BI
📊 Centralized Financial KPI Visibility
Track all finance and accounting KPIs from one interactive Power BI dashboard.
📅 MTD & YTD Performance Tracking
Monitor short-term monthly results and long-term yearly performance together.
🎯 Target vs Actual Comparison
Instantly identify target achievements and misses using KPI icons and percentages.
📈 Previous Year Comparison
Analyze year-over-year financial performance to measure growth and stability.
🎛️ Interactive Slicers
Filter results by Month and KPI Group for focused analysis.
🔍 Drill-Through KPI Definitions
Access KPI formulas and definitions directly from the dashboard for transparency.
📦 What’s Inside the Finance and Accounting KPI Dashboard in Power BI
This professionally designed Power BI file includes three powerful analytical pages; each created for a specific purpose:
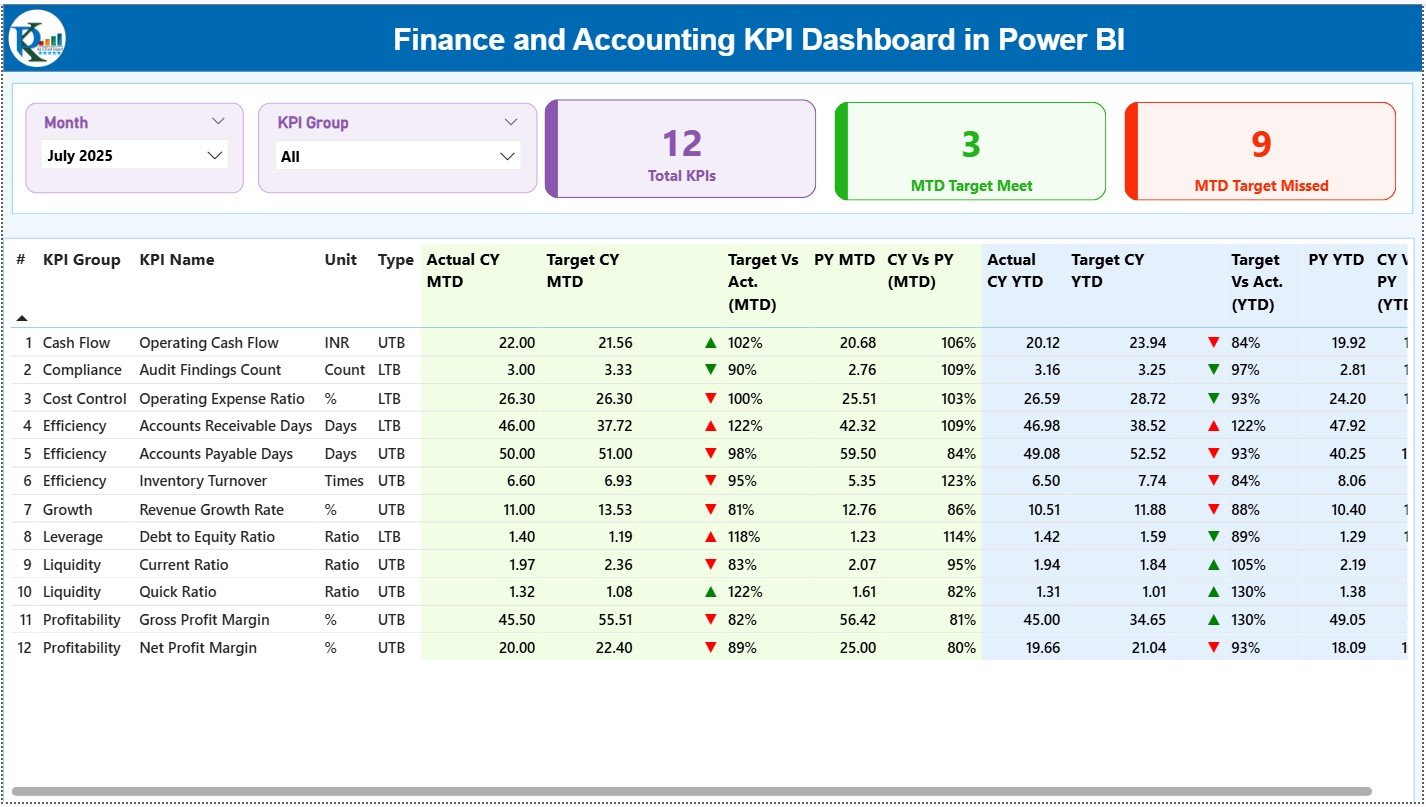
📊 Summary Page
The main performance overview page featuring:
-
Month slicer and KPI Group slicer
-
KPI cards showing Total KPIs, MTD Target Met, and MTD Target Missed
-
A detailed KPI table with MTD and YTD metrics
-
Actual, Target, and Previous Year values
-
Green ▲ and Red ▼ icons for instant performance interpretation
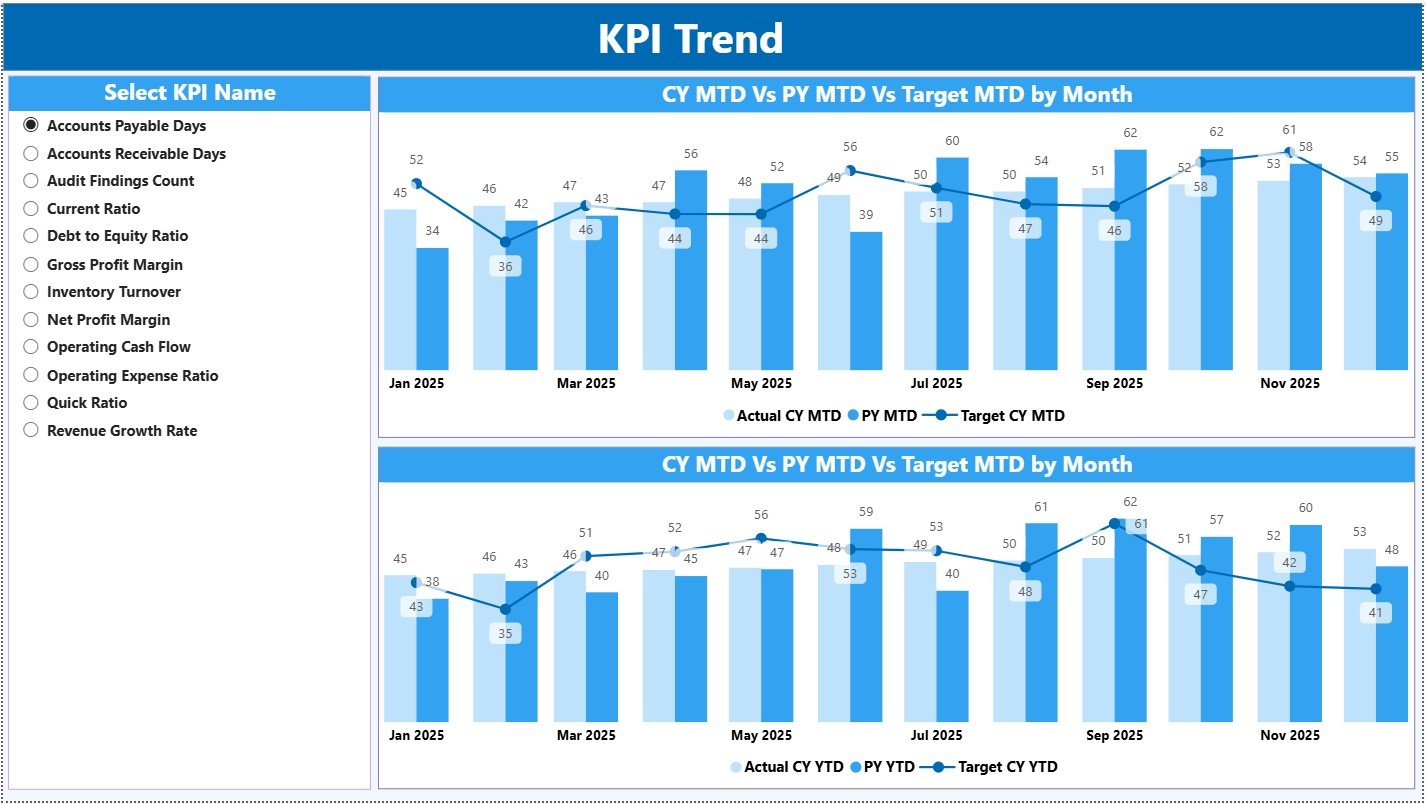
📈 KPI Trend Page
Designed for deep trend analysis with:
-
KPI Name slicer
-
MTD Trend Combo Chart (Actual, Target, PY)
-
YTD Trend Combo Chart (Actual, Target, PY)
These visuals help users identify trends, seasonality, and performance gaps quickly.
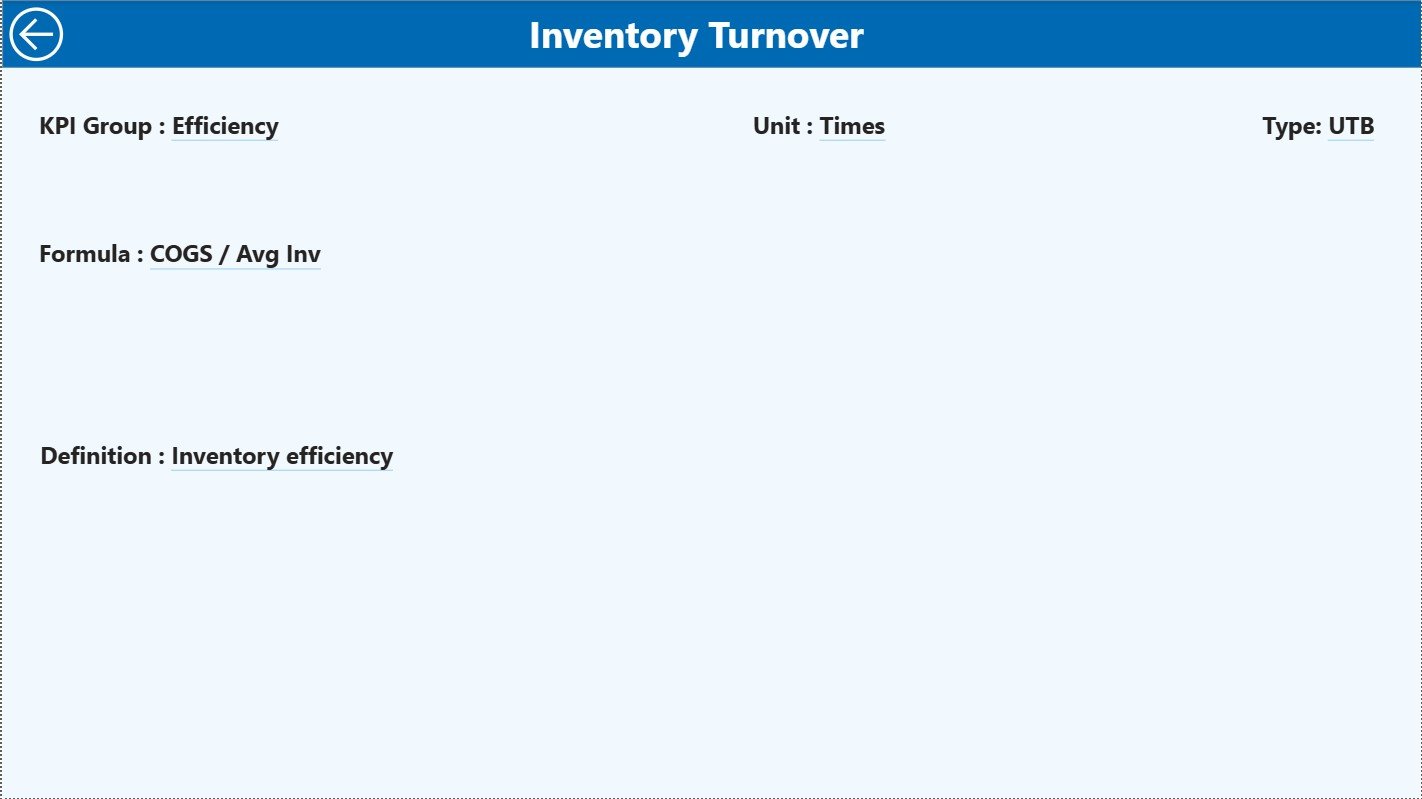
📘 KPI Definition Page (Drill-Through)
A hidden governance page that displays:
-
KPI Formula
-
KPI Definition
-
KPI Group
-
Unit of Measurement
-
KPI Type (LTB / UTB)
Users can drill through from the Summary Page and return easily using the Back button.
🛠️ How to Use the Finance and Accounting KPI Dashboard in Power BI
Using this dashboard is simple and efficient:
1️⃣ Enter Actual MTD and YTD values in the Input Actual Excel sheet
2️⃣ Enter Target MTD and YTD values in the Input Target sheet
3️⃣ Maintain KPI details in the KPI Definition sheet
4️⃣ Refresh the Power BI dashboard
5️⃣ Instantly view updated KPIs, trends, and insights
Because calculations and visuals update automatically, finance teams save time and reduce manual errors.
👥 Who Can Benefit from This Finance and Accounting KPI Dashboard in Power BI
This dashboard is ideal for:
💼 Finance Managers
📊 Accounting Teams
🏢 CFOs & Controllers
📈 Financial Analysts
👔 Business Owners
📋 Senior Leadership
Whether you manage a small business or a large enterprise, this dashboard scales easily with your reporting needs.


Reviews
There are no reviews yet.