
Managing a vacation rental business is not just about bookings—it’s about occupancy optimization, revenue control, cost efficiency, and guest experience. When data is spread across booking platforms, spreadsheets, and manual reports, it becomes difficult to understand what’s working and what’s hurting profitability. As a result, decisions often become reactive instead of strategic.
That is exactly why the Vacation Rental KPI Dashboard in Google Sheets becomes an essential performance management tool.
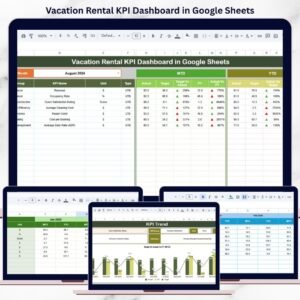
This ready-to-use dashboard transforms raw rental data into a structured, visual, and actionable reporting system. It helps vacation rental owners, property managers, hospitality teams, and investors track key KPIs such as occupancy, revenue, costs, and performance trends—all from one interactive Google Sheets dashboard. Instead of juggling multiple files, you gain a single source of truth that updates automatically and supports smarter decisions.
Because the dashboard is built entirely in Google Sheets, it offers cloud-based access, real-time collaboration, automatic calculations, and zero software cost.
✨ Key Features of the Vacation Rental KPI Dashboard in Google Sheets
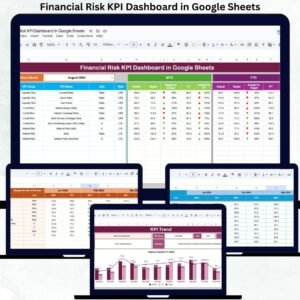
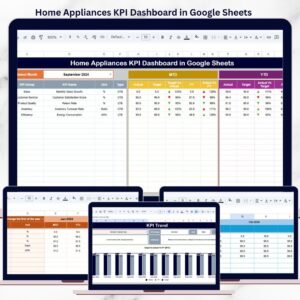
📊 1. MTD & YTD Performance Tracking
Monitor both Month-to-Date and Year-to-Date performance effortlessly. Select a month and watch all KPIs refresh instantly.
🎯 2. Target vs Actual & Previous Year Comparison
Compare actual results against targets and last year’s performance to measure growth, seasonality, and goal achievement.
📈 3. Visual Performance Indicators
Conditional formatting with up/down arrows highlights improvement or decline, making performance status clear at a glance.
📉 4. KPI Trend Transparency
Understand how each KPI behaves over time with a dedicated KPI Trend sheet that explains definitions and formulas.
🤝 5. Google Sheets-Based Collaboration
Work seamlessly with your team using shared access, version control, and real-time updates.
📦 What’s Inside the Vacation Rental KPI Dashboard in Google Sheets
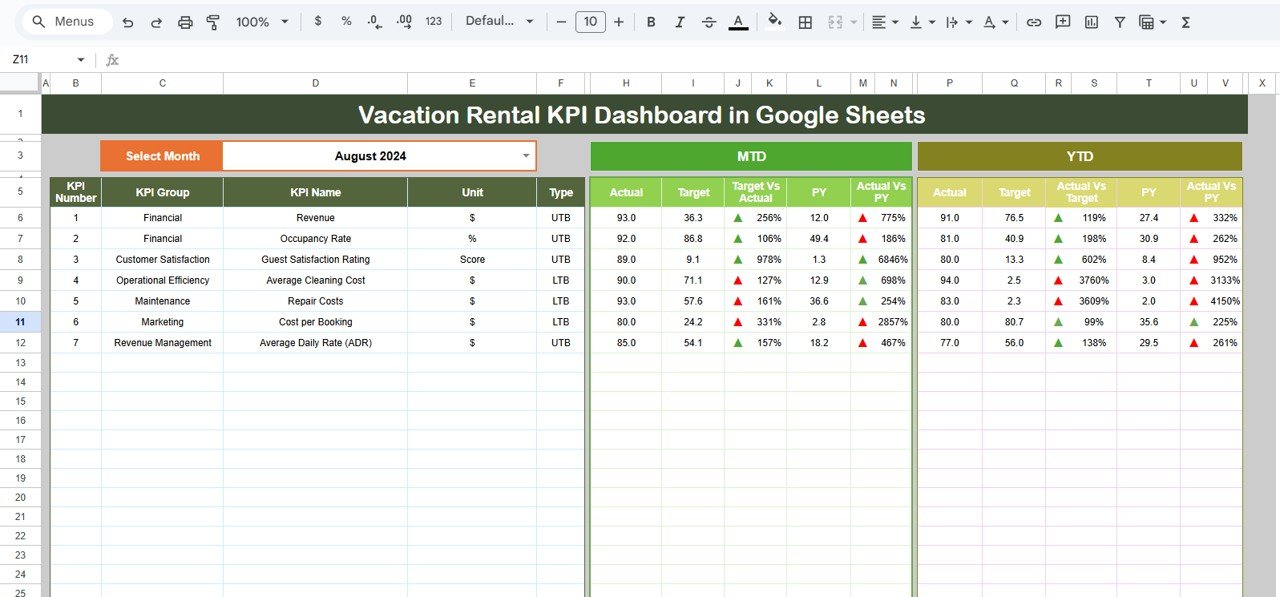
🖥️ Dashboard Sheet Tab – KPI Performance Overview
This is the main reporting page where all KPIs are displayed.
📌 Month Selection
-
Month dropdown available in cell D3
-
Selecting a month updates all KPI values automatically
📌 KPI Metrics Displayed
-
MTD Actual, Target, Previous Year
-
Target vs Actual comparison
-
Previous Year vs Actual comparison
All comparisons use conditional formatting arrows for clarity.
📌 YTD Performance
-
YTD Actual, Target, Previous Year
-
Variance indicators highlight long-term performance
This structure supports both short-term and annual performance tracking.
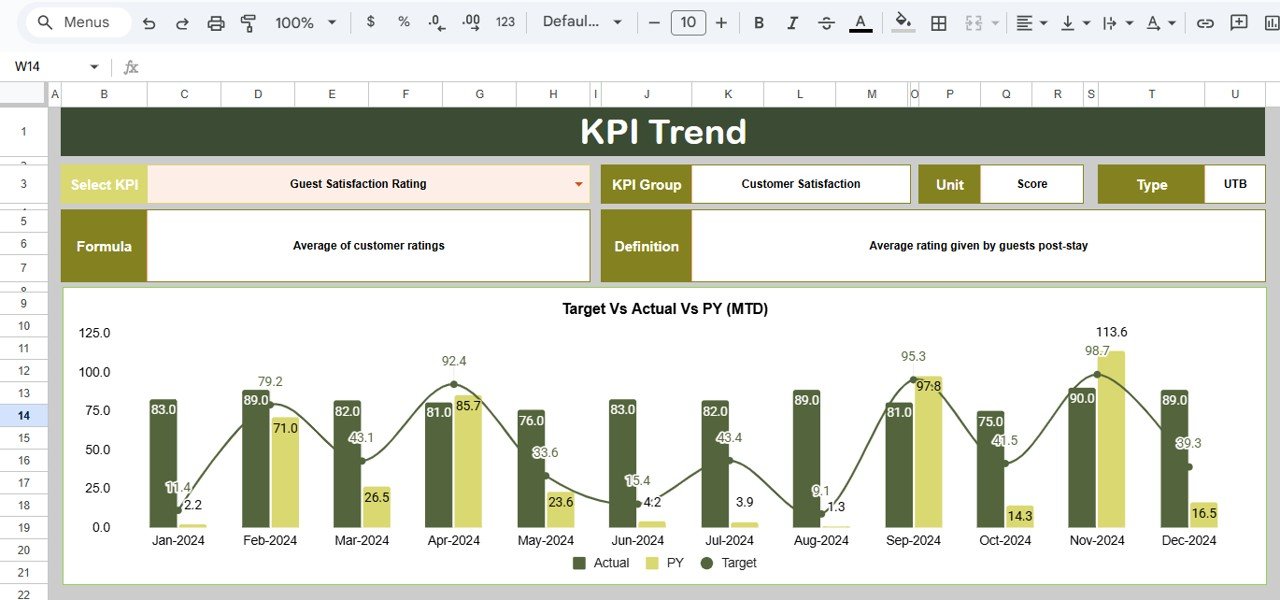
📊 KPI Trend Sheet Tab
This sheet provides a deeper understanding of each KPI.
🔍 KPI Selection
-
Select a KPI from the dropdown in cell C3
📘 KPI Information Displayed
-
KPI Group
-
Unit of Measurement
-
KPI Type (Lower the Better / Upper the Better)
-
KPI Formula
-
KPI Definition
This improves KPI transparency and governance.
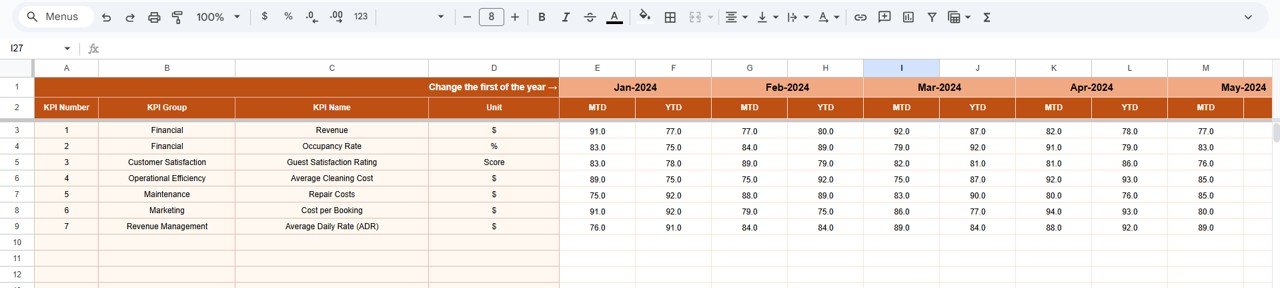
📋 Actual Number Sheet Tab
This sheet is used to enter actual performance data.
-
Enter MTD and YTD actual values
-
Change the month using cell E1
-
Enter the first month of the year to align YTD calculations
All dashboards and visuals update automatically.
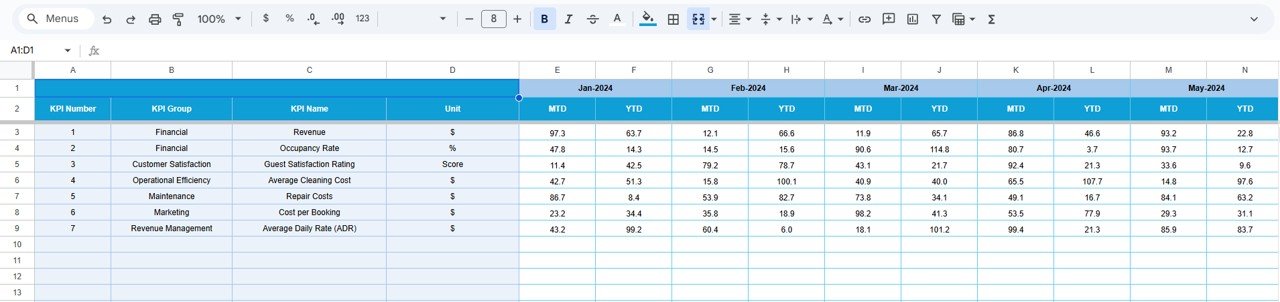
🎯 Target Sheet Tab
This sheet stores planned performance goals.
-
Monthly MTD targets
-
Cumulative YTD targets
Targets help teams evaluate performance objectively.
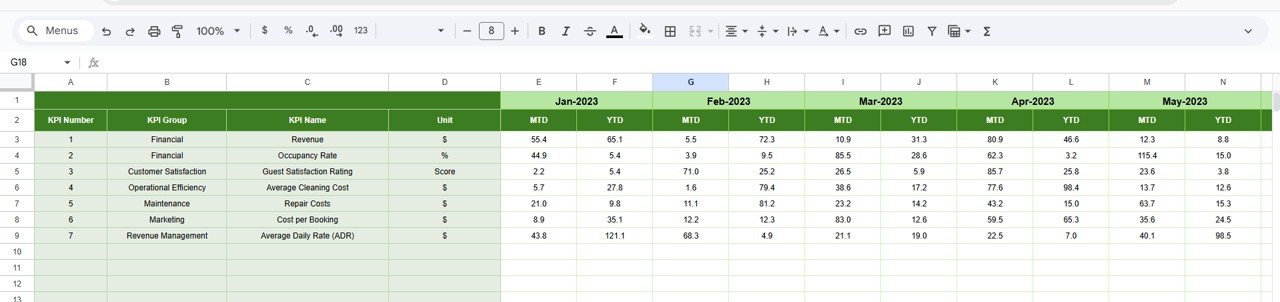
📆 Previous Year Number Sheet Tab
This sheet captures historical data.
-
Enter last year’s MTD and YTD values
-
Enable year-over-year comparison
This helps identify growth trends and seasonality.
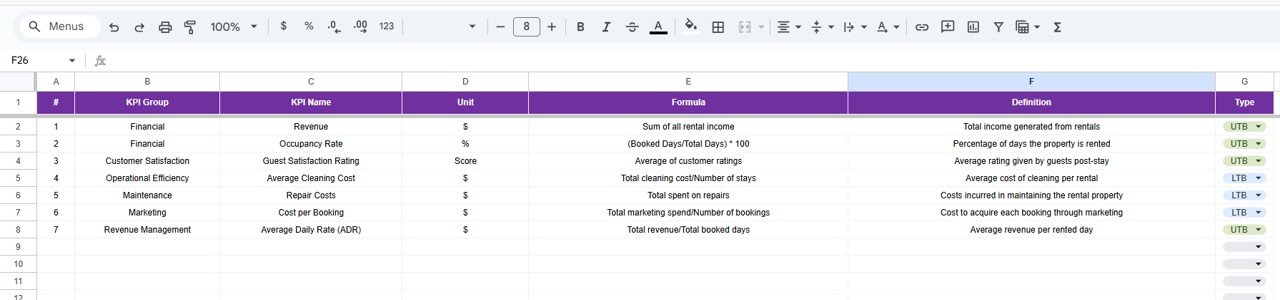
📘 KPI Definition Sheet Tab
The KPI master sheet ensures consistency.
-
KPI Name
-
KPI Group
-
Unit
-
Formula
-
KPI Definition
-
KPI Type (LTB / UTB)
🎯 Who Can Benefit from This Vacation Rental KPI Dashboard
🏠 Vacation Rental Owners
Track profitability, occupancy, and performance effortlessly.
🏨 Property Managers
Monitor operational efficiency and cost control.
📊 Hospitality Teams
Understand trends and optimize guest experience.
💼 Real Estate Investors
Evaluate property performance and ROI.
🚀 Growing Rental Businesses
Scale operations with data-driven clarity.
### Click here to read the Detailed blog post
Watch the step-by-step video tutorial:


Reviews
There are no reviews yet.