Manufacturing Operations KPI Dashboard operate in a fast-moving, cost-sensitive, and performance-driven environment. However, when production data stays scattered across Excel files, emails, and manual reports, decision-making becomes slow and risky. As a result, plant managers and leadership teams struggle to identify issues early and improve performance consistently.
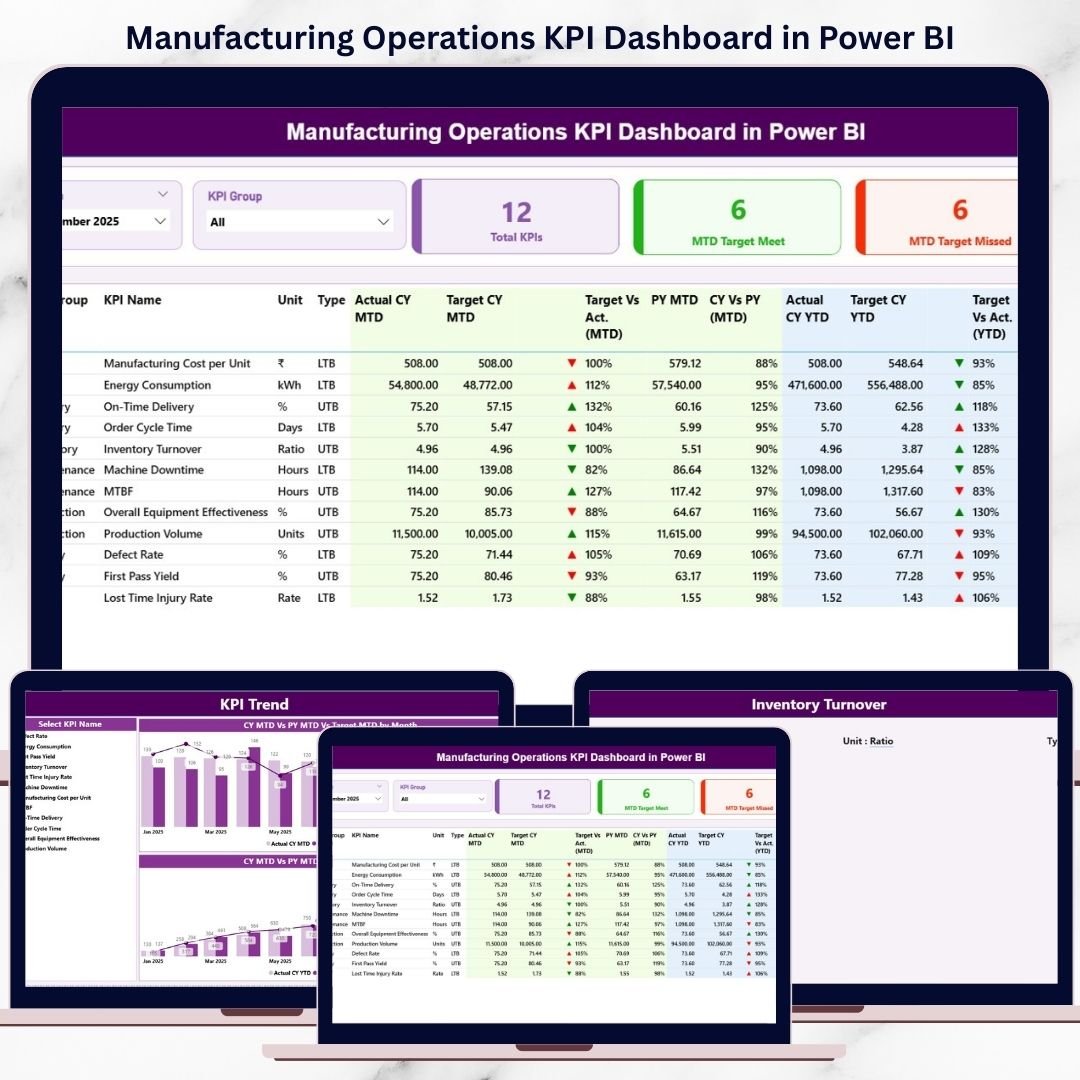
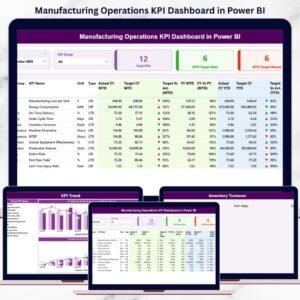
The Manufacturing Operations KPI Dashboard in Power BI is a ready-to-use, interactive analytics solution designed to track manufacturing KPIs in one centralized, visual, and automated dashboard. Instead of reviewing static reports, you gain real-time visibility into MTD, YTD, Target vs Actual, and Previous Year performance—all in one powerful Power BI report.
This dashboard helps manufacturing teams shift from reactive firefighting to proactive, data-driven operations management.
🚀 Key Features of Manufacturing Operations KPI Dashboard in Power BI
📊 Centralized KPI Monitoring – Track all manufacturing KPIs in one Power BI dashboard
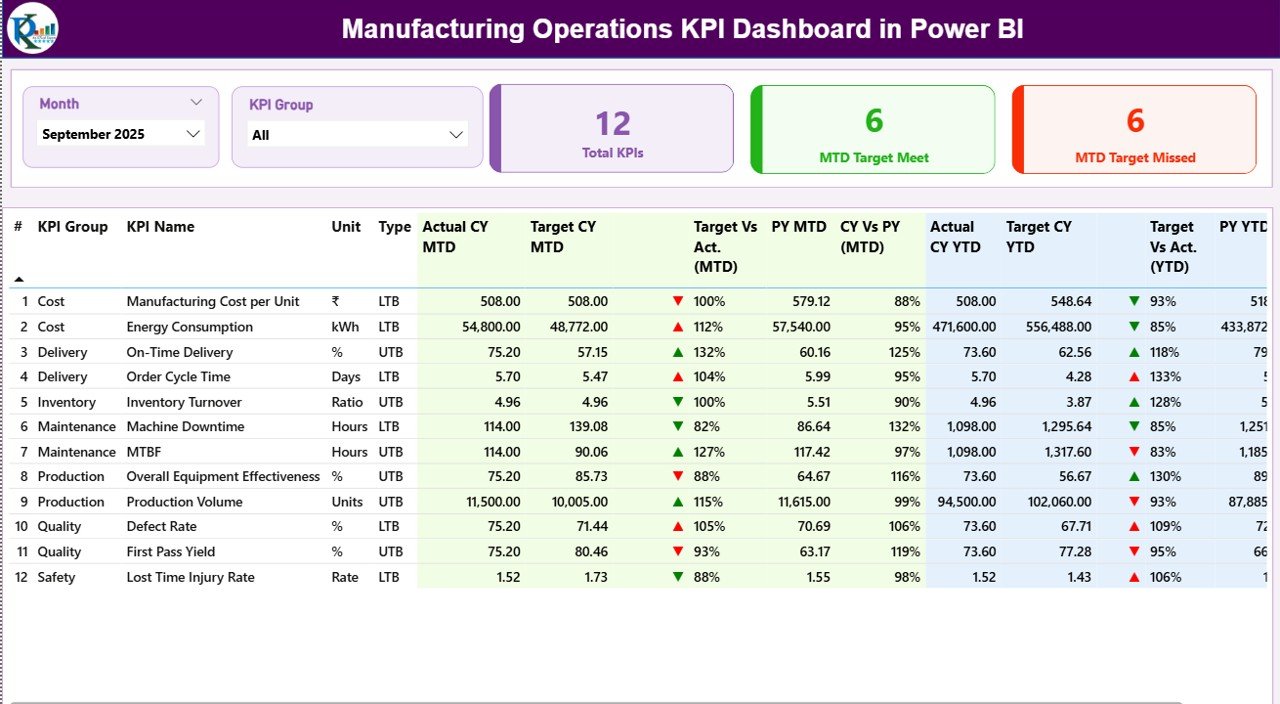
📅 Month & KPI Group Slicers – Analyze performance dynamically
🎯 Actual vs Target Analysis – Instantly identify gaps
📈 Current Year vs Previous Year Comparison – Measure improvement clearly
🧮 MTD & YTD Performance Tracking – Monitor short-term and long-term results
🚦 Visual Status Indicators – Green ▲ and Red ▼ icons for quick decisions
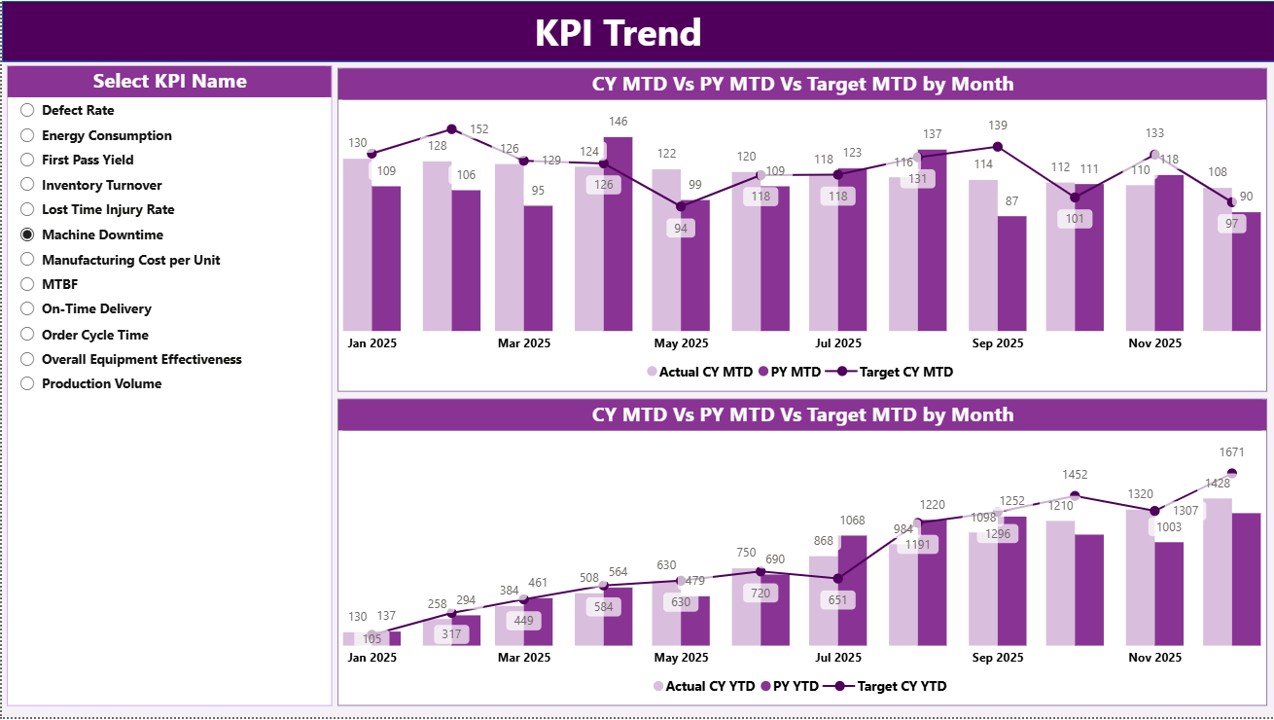
📉 KPI Trend Analysis – Understand performance patterns over time
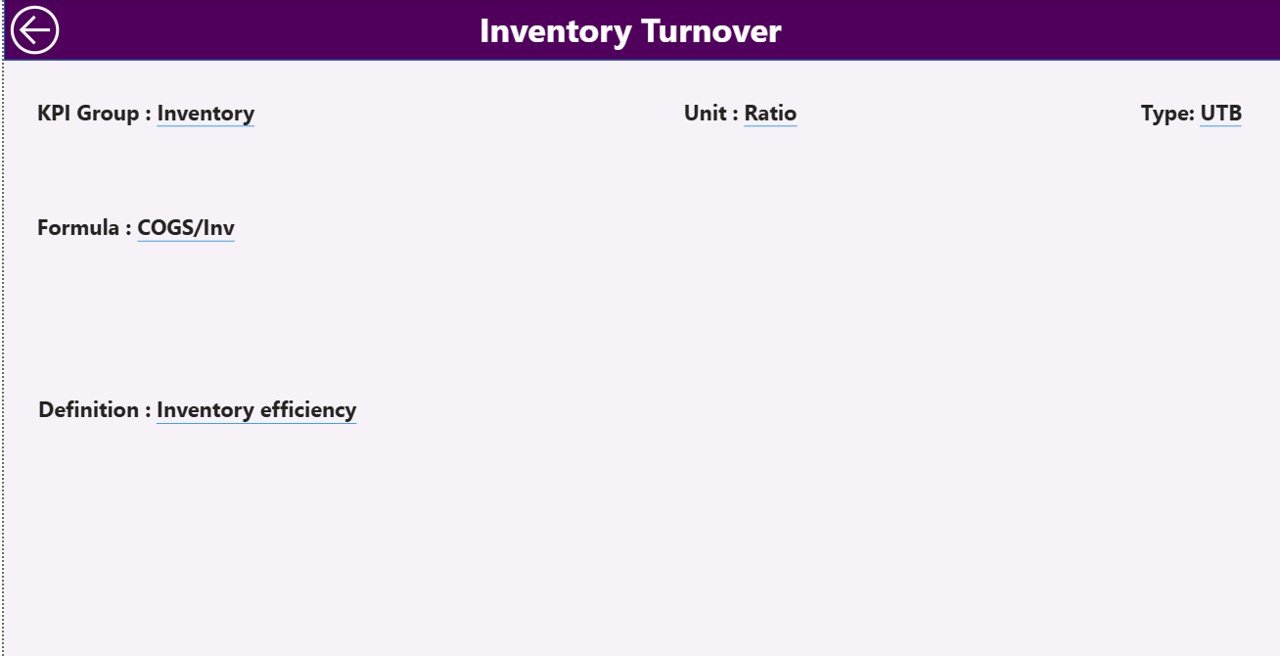
🔎 Drill-Through KPI Definitions – Full clarity on formulas and logic
🔄 Excel-Based Data Source – Simple updates, no technical complexity
📦 What’s Inside the Manufacturing Operations KPI Dashboard in Power BI
📁 Power BI (.pbix) Dashboard File with professional manufacturing layout
📊 Summary Page – Overall KPI performance snapshot
📈 KPI Trend Page – KPI-wise MTD & YTD trend analysis
📘 KPI Definition Page (Drill-Through) – KPI formula, definition, and type
📄 Excel Data File containing:
-
Input_Actual Sheet
-
Input_Target Sheet
-
KPI Definition Sheet
Everything is structured for clarity, scalability, and ease of maintenance.
🧠 How to Use the Manufacturing Operations KPI Dashboard in Power BI
1️⃣ Update Actual KPI values in the Excel Input_Actual sheet
2️⃣ Update Target values in the Input_Target sheet
3️⃣ Maintain KPI details in the KPI Definition sheet
4️⃣ Open the Power BI file
5️⃣ Click Refresh
6️⃣ Select Month and KPI Group using slicers
7️⃣ Review performance on the Summary Page
8️⃣ Analyze trends on the KPI Trend Page
9️⃣ Drill-through to understand KPI definitions instantly
No advanced Power BI skills are required. If you can refresh Power BI, you can use this dashboard confidently.
👥 Who Can Benefit from This Manufacturing Operations KPI Dashboard in Power BI
🏭 Plant Managers & Factory Heads – Monitor operational health
📊 Operations & Performance Analysts – Track KPI trends
🧪 Quality & Production Teams – Identify inefficiencies early
⚙️ Continuous Improvement Teams – Support Lean & Six Sigma initiatives
💼 Senior Management & Executives – Get instant performance visibility
This dashboard works perfectly for small manufacturing units as well as large multi-plant operations.
🔗 Click here to read the Detailed Blog Post
🎥 Visit our YouTube channel to learn step-by-step video tutorials
https://www.youtube.com/@PKAnExcelExpert


Reviews
There are no reviews yet.