In today’s fast-growing sustainable agriculture market, organic fertilizer businesses must track performance with clarity, speed, and accuracy. However, relying on manual spreadsheets or scattered reports often leads to delays, errors, and missed opportunities. That is exactly why the Organic Fertilizers KPI Dashboard in Excel becomes a powerful decision-making tool.
This ready-to-use Excel dashboard converts complex operational, production, cost, quality, sales, and sustainability data into clear, visual, and actionable insights. Instead of switching between multiple sheets, users can monitor all critical KPIs from one centralized and interactive dashboard. As a result, managers gain better control, reduce reporting time, and make confident, data-driven decisions.
Designed with simplicity and flexibility in mind, this dashboard works perfectly for both small and large organic fertilizer businesses. Moreover, it requires no advanced technical skills—just basic Excel knowledge.
Key Features of Organic Fertilizers KPI Dashboard in Excel 🌱📊
🚀 Centralized KPI Monitoring
Track all organic fertilizer KPIs in one structured dashboard instead of managing multiple files.
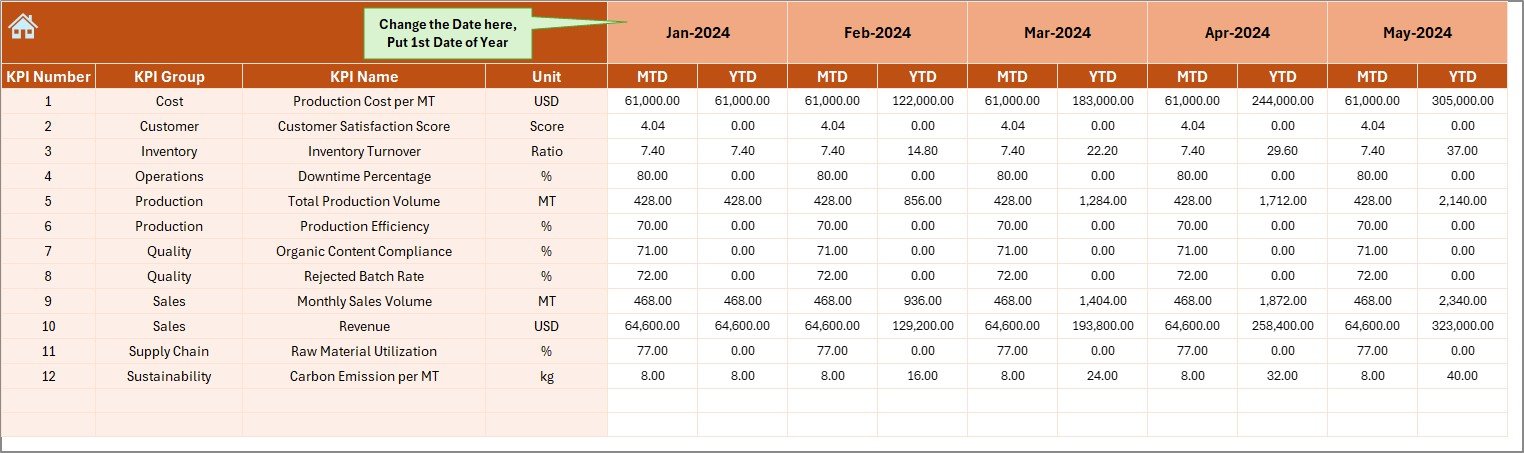
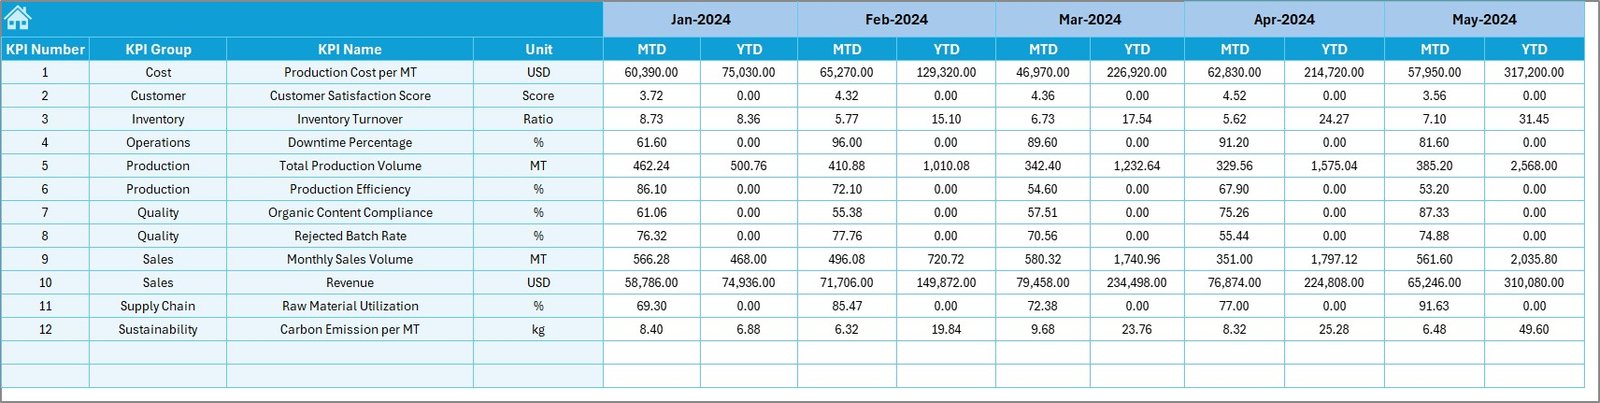
📅 MTD & YTD Performance Tracking
Analyze Month-to-Date and Year-to-Date results side by side for better short-term and long-term planning.
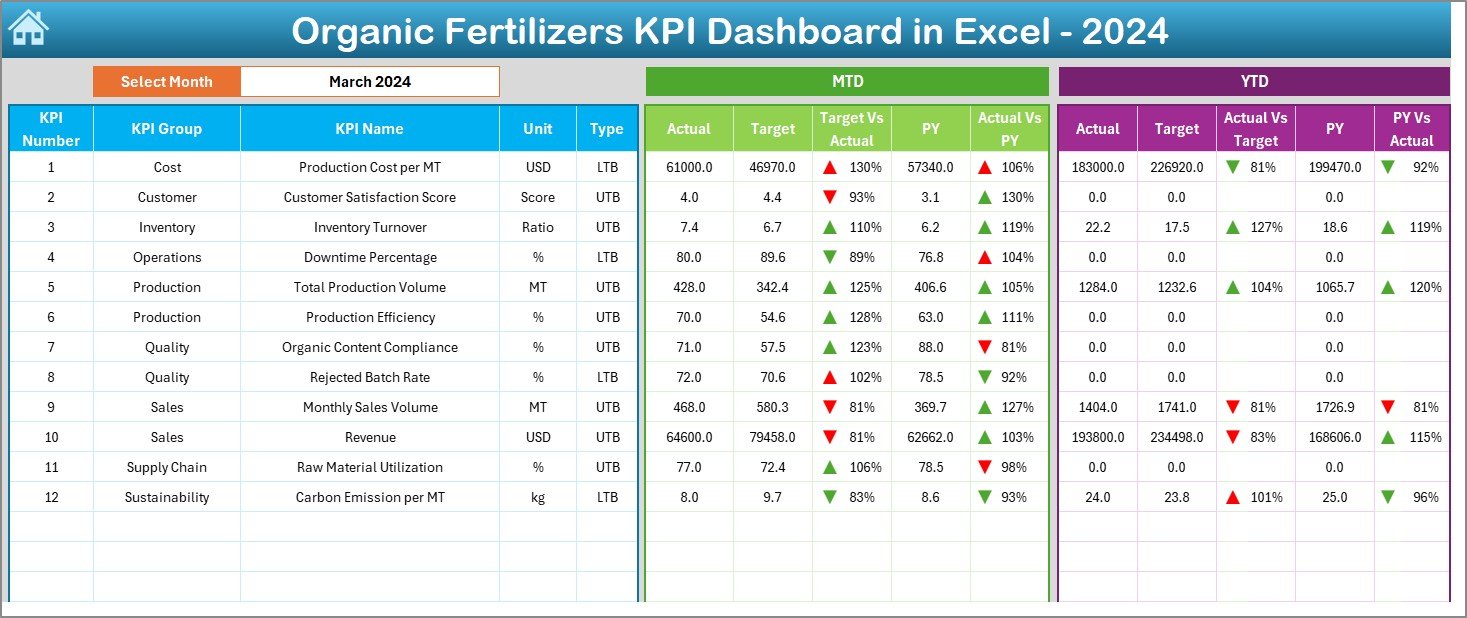
🎯 Target vs Actual Comparison
Instantly identify performance gaps using Target vs Actual and Previous Year vs Actual indicators.
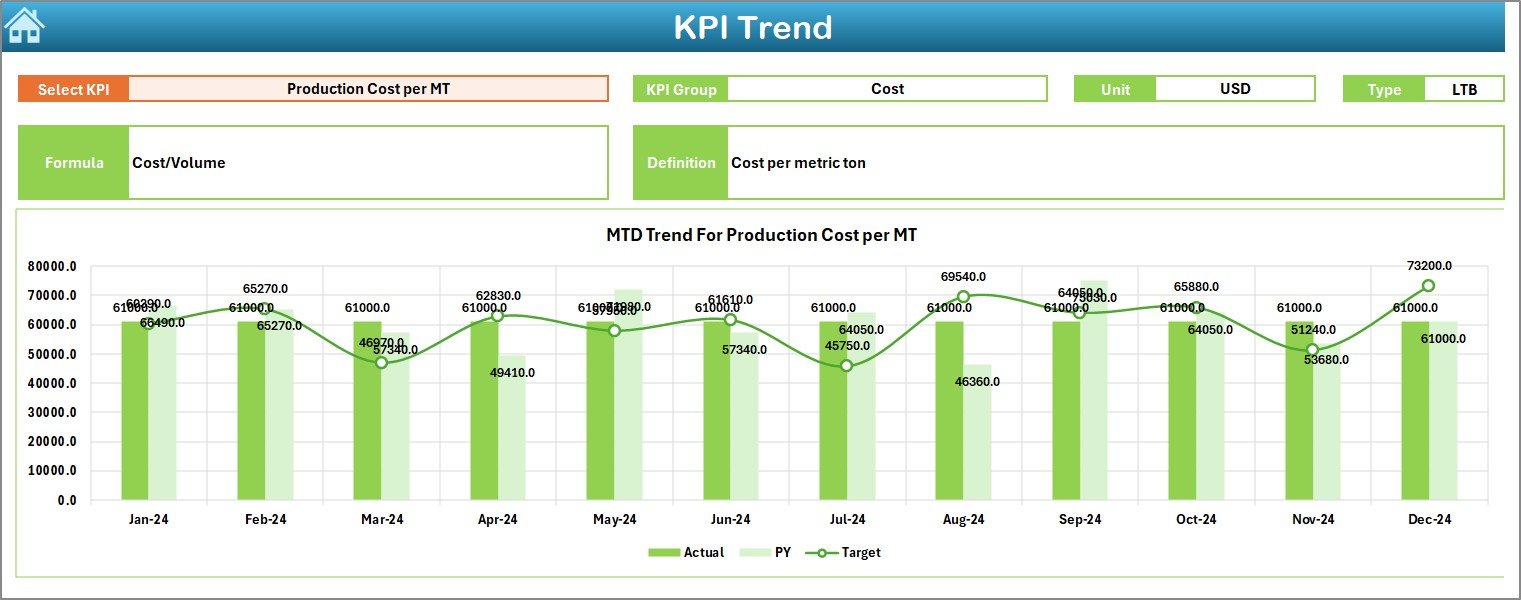
📈 Interactive Trend Analysis
Analyze monthly KPI trends with Actual, Target, and Previous Year comparisons for both MTD and YTD.
🎛️ Dynamic Month Selection
Change the reporting month using a simple dropdown and see the entire dashboard update instantly.
🔺 Visual Performance Indicators
Conditional formatting arrows and color signals highlight improvement or decline at a glance.
🧩 Fully Customizable KPIs
Easily add, modify, or remove KPIs without using macros or complex formulas.
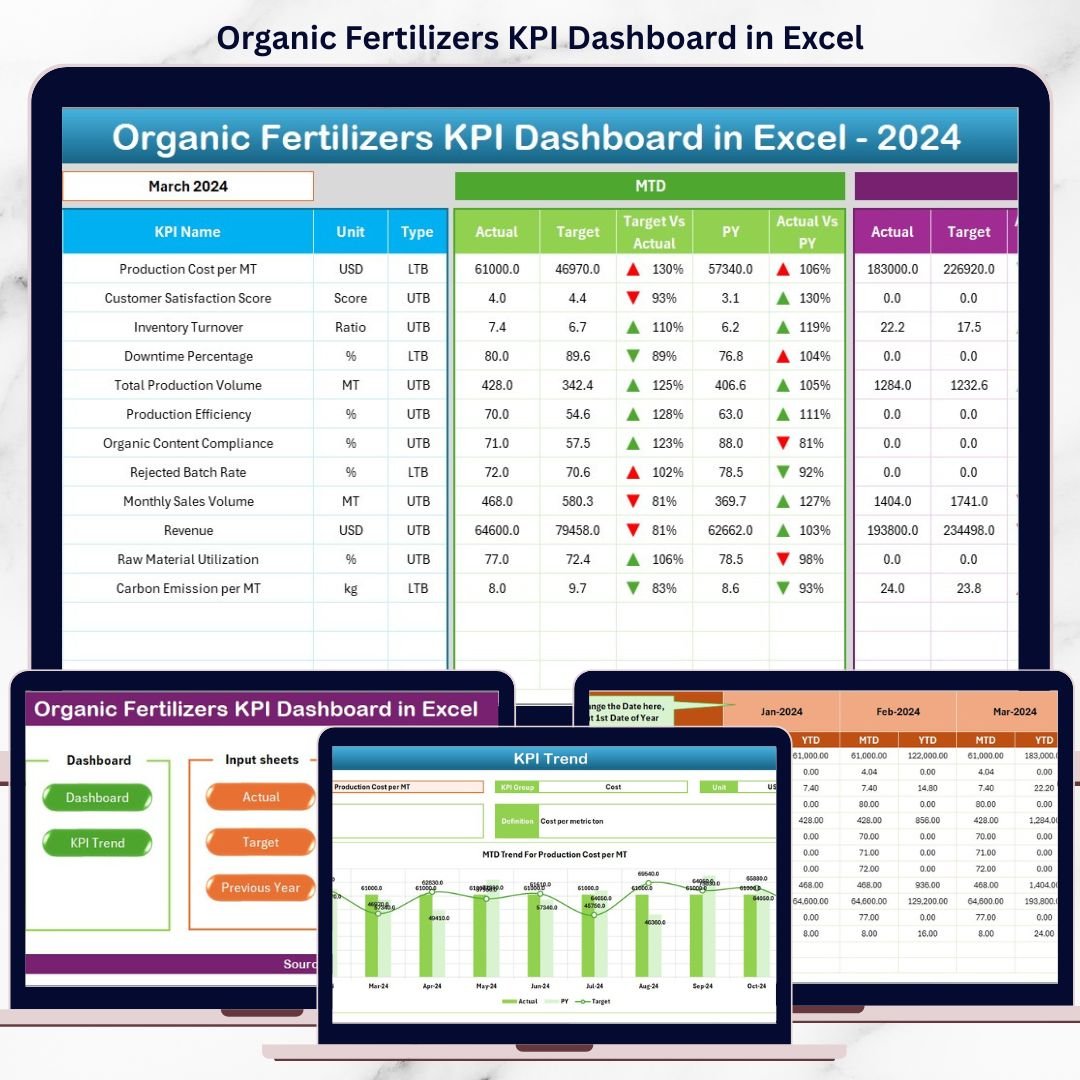
What’s Inside the Organic Fertilizers KPI Dashboard in Excel 📂📈
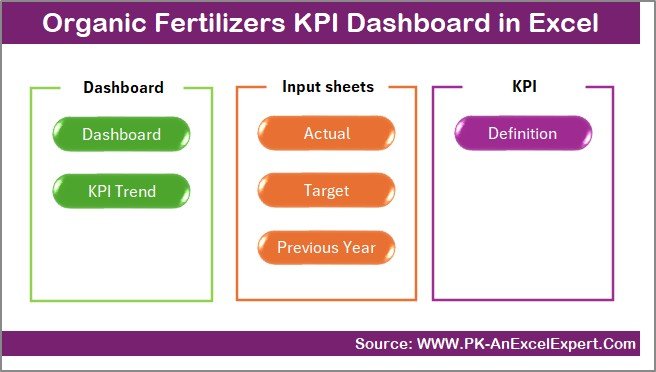
This dashboard includes 7 professionally designed worksheets, each serving a specific purpose:
📌 Summary Page – A clean index page with navigation buttons for one-click access to all sheets.
📌 Dashboard Sheet – The main analytical view showing all KPIs with MTD & YTD comparisons.
📌 Trend Sheet – KPI-wise trend analysis with interactive selection and detailed KPI information.
📌 Actual Numbers Sheet – Centralized input sheet for entering actual performance data.
📌 Target Sheet – Define monthly and yearly targets aligned with business goals.
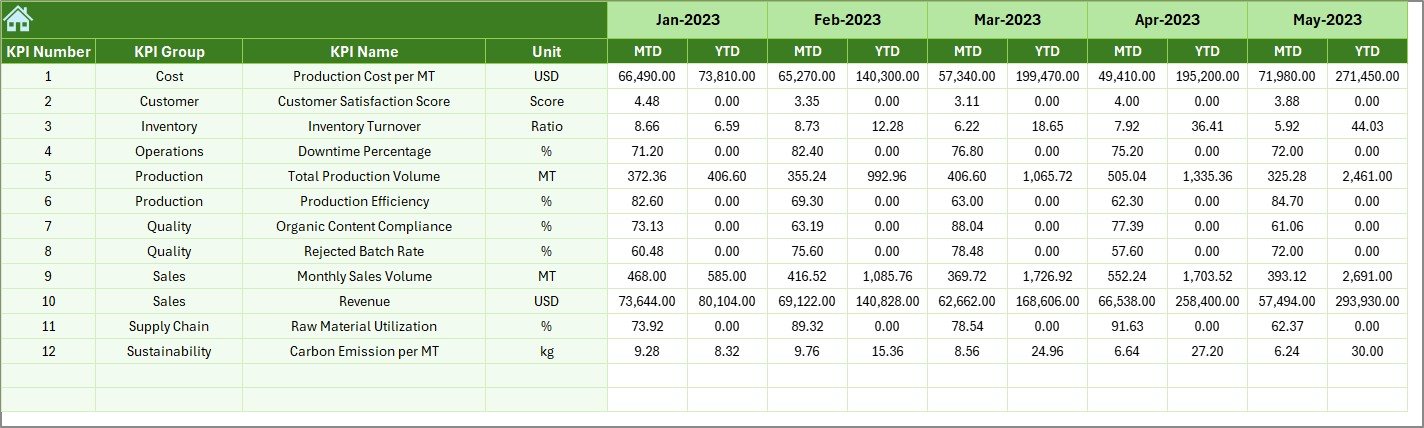
📌 Previous Year Sheet – Store last year’s data for accurate year-over-year analysis.
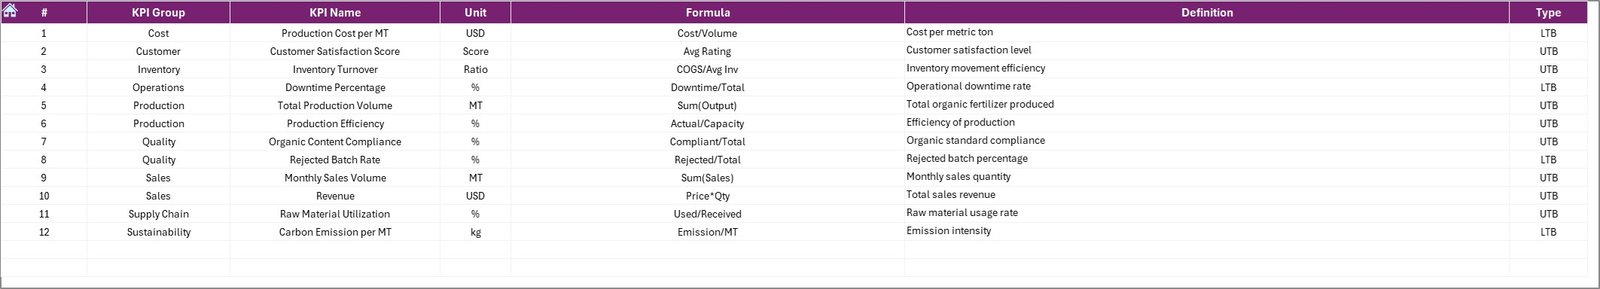
📌 KPI Definition Sheet – Maintain clarity with KPI name, group, unit, formula, and definition.
Because of this structured layout, the dashboard remains easy to understand, scalable, and audit-ready.
How to Use the Organic Fertilizers KPI Dashboard in Excel 🛠️📘
Using this dashboard is simple and straightforward:
1️⃣ Enter actual performance data in the Actual Numbers Sheet
2️⃣ Define targets in the Target Sheet
3️⃣ Add previous year values for comparison
4️⃣ Select the reporting month from the dropdown
5️⃣ Instantly view updated KPIs, comparisons, and trends
Because calculations and visuals are automated, you spend less time preparing reports and more time analyzing performance.
Who Can Benefit from This Organic Fertilizers KPI Dashboard 👨🌾🏭
This dashboard is ideal for:
🌿 Organic fertilizer manufacturers
🌿 Agricultural cooperatives
🌿 Sustainability & ESG managers
🌿 Operations managers
🌿 Finance and planning teams
🌿 Farm input suppliers
Whether you manage production, cost control, quality compliance, or sustainability reporting, this dashboard adapts perfectly to your needs.
Click here to read the Detailed blog post
Watch the step-by-step video tutorial:
Visit our
YouTube channel to learn step-by-step video tutorials


Reviews
There are no reviews yet.