


Soil testing services form the backbone of modern agriculture, construction, environmental monitoring, and land development. Every day, laboratories process hundreds of samples, track accuracy levels, meet turnaround commitments, and ensure regulatory compliance. Soil Testing Services KPI Dashboard in Power BI However, when performance data sits in disconnected Excel files or manual reports, teams lose visibility, accountability, and control.
Soil Testing Services KPI Dashboard in Power BI That is exactly why the Soil Testing Services KPI Dashboard in Power BI becomes a must-have performance intelligence solution 🚀.
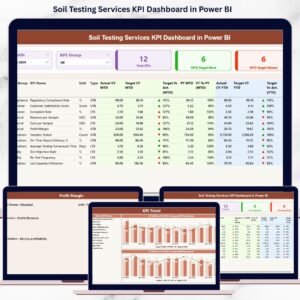
This ready-to-use Power BI dashboard converts raw soil testing data into clear KPIs, performance tables, and interactive trend charts, enabling laboratories and service providers to track targets, identify gaps, and improve operational efficiency—without complex systems or heavy IT dependency.
Built using Excel as the data source and Power BI for analytics, this dashboard delivers real-time clarity, standardized KPIs, and executive-ready insights for both technical and non-technical users.
Key Features of Soil Testing Services KPI Dashboard in Power BI
📊 Centralized KPI Monitoring
Track all soil testing performance metrics in one interactive dashboard.
🎯 MTD & YTD Target Tracking
Compare actuals vs targets for short-term and long-term control.
📈 Trend-Based Performance Analysis
Analyze KPI trends across months and years.
🔍 Clear KPI Status Indicators
Green ▲ and Red ▼ icons highlight performance instantly.
📘 KPI Definition Drill-Through
Eliminate confusion with clear formulas and definitions.
⚡ Excel + Power BI Architecture
Easy data updates with powerful visual analytics.
🧠 Decision-Ready Insights
Spot issues early and act before service quality drops.
What’s Inside the Soil Testing Services KPI Dashboard in Power BI
📊 Summary Page – Executive Performance Control Center

The Summary Page provides a complete snapshot of soil testing operations.
Top-Level Slicers
📅 Month Slicer
📂 KPI Group Slicer
KPI Cards Display
-
Total KPIs Count
-
MTD Target Met Count
-
MTD Target Missed Count
Detailed KPI Table Includes
-
KPI Number
-
KPI Group
-
KPI Name
-
Unit of Measurement
-
KPI Type (UTB / LTB)
MTD Metrics
-
Actual CY MTD
-
Target CY MTD
-
Target vs Actual %
-
PY MTD
-
CY vs PY %
-
Status Icons (▲ ▼)
YTD Metrics
-
Actual CY YTD
-
Target CY YTD
-
Target vs Actual %
-
PY YTD
-
CY vs PY %
This layout allows leaders to identify problem areas within seconds.
📈 KPI Trend Page – Performance Over Time
The KPI Trend Page supports deep-dive analysis.
Features Include
📌 KPI Name Slicer (left side)
📊 MTD Trend Chart (Actual, Target, PY)
📈 YTD Trend Chart (Actual, Target, PY)
This page answers critical questions like:
-
Are turnaround times improving?
-
Are quality KPIs stable month over month?
-
Are targets realistic or misaligned?
📘 KPI Definition Page – Governance & Transparency
The KPI Definition Page acts as a drill-through reference layer.
It displays:
-
KPI Formula
-
KPI Definition
-
Unit of Measurement
-
KPI Type (UTB / LTB)
This ensures consistent understanding across labs, managers, and leadership.
A back button enables smooth navigation to the main dashboard.
⚙️ How to Use the Soil Testing Services KPI Dashboard in Power BI
📝 Step 1: Update Actual & Target KPI values in Excel
🔄 Step 2: Refresh the Power BI dashboard
📊 Step 3: Use slicers to filter by month or KPI group
📈 Step 4: Review KPI status and trends
🎯 Step 5: Take corrective and preventive actions
No advanced Power BI skills required.
👥 Who Can Benefit from This Dashboard
🧪 Soil Testing Laboratories – Improve turnaround and accuracy
🌾 Agricultural Service Providers – Track advisory quality
🏗️ Construction & Material Testing Labs – Monitor compliance
🌍 Environmental Testing Agencies – Improve reporting discipline
📊 Operations & QA Teams – Strengthen accountability
💼 Business Owners & Directors – Gain executive-level visibility
🔍 Click here to read the Detailed blog post
📺 Visit our YouTube channel to learn step-by-step video tutorials
👉 Youtube.com/@PKAnExcelExpert


Reviews
There are no reviews yet.