Managing investments without a clear, structured view often leads to missed opportunities, delayed decisions, and unnecessary risks. That is why modern investors, portfolio managers, analysts, and finance teams rely on dashboards instead of scattered spreadsheets. The Investment Management Dashboard in Excel is a powerful, ready-to-use solution that transforms raw investment data into meaningful insights—helping you track performance, monitor risks, and maximize returns with confidence.
This professionally designed Excel dashboard gives you a centralized view of your entire investment portfolio. Instead of manually analyzing multiple files, you can instantly monitor invested amounts, current value, ROI, active investments, and trends across portfolios, regions, and investment types—all in one place.
✅ Key Features of Investment Management Dashboard in Excel
📌 Centralized Portfolio Tracking – Track all investments in one structured Excel dashboard without confusion.
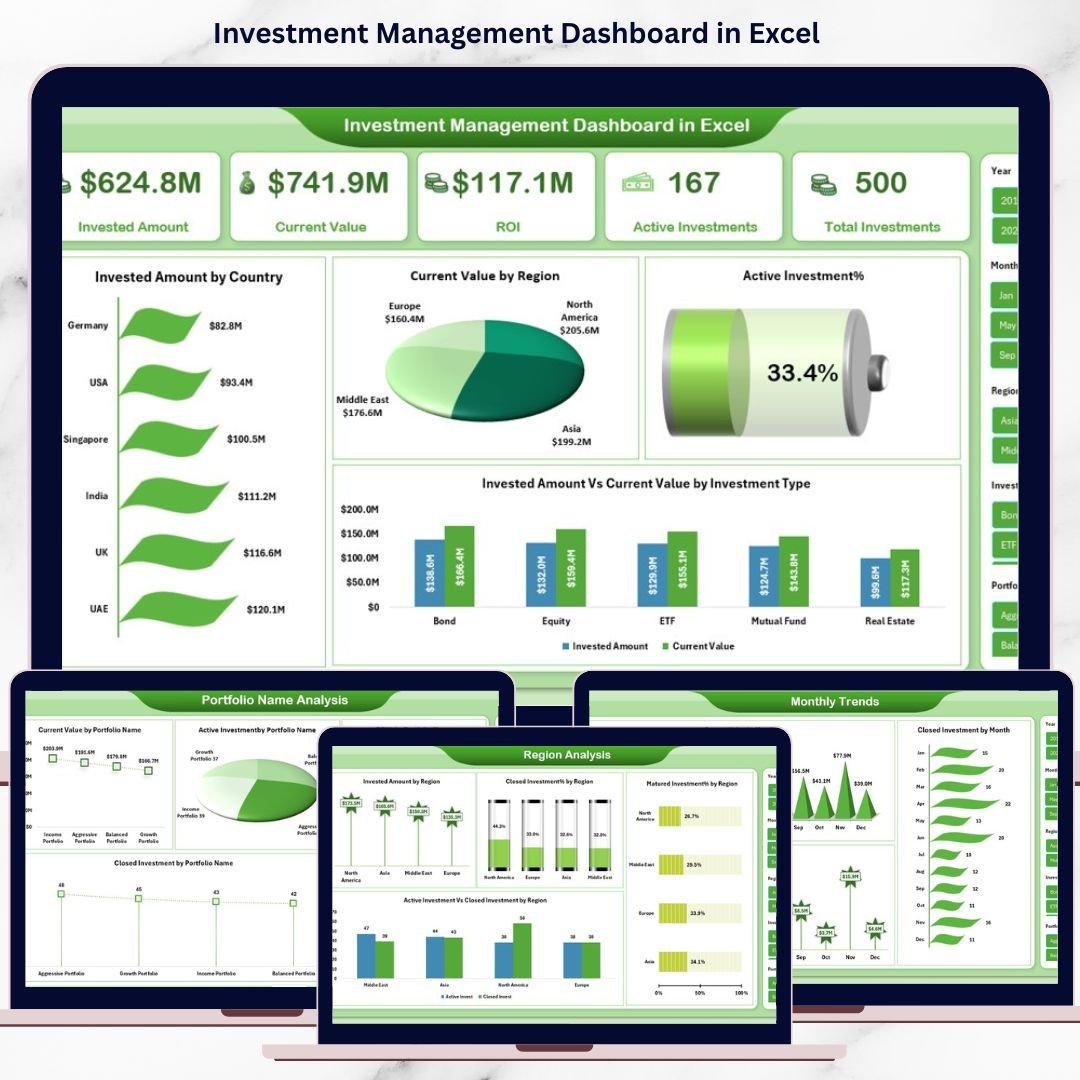
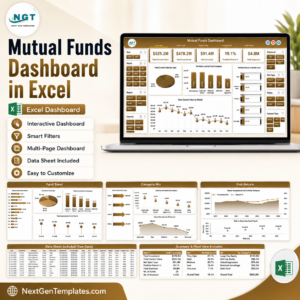
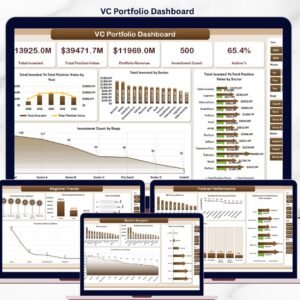
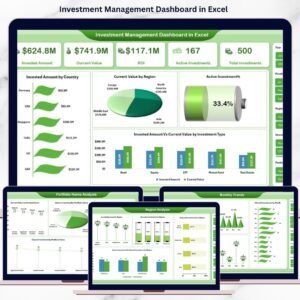
📌 Interactive Overview Page – Get a snapshot of invested amount, current value, ROI, active investments, and total investments.
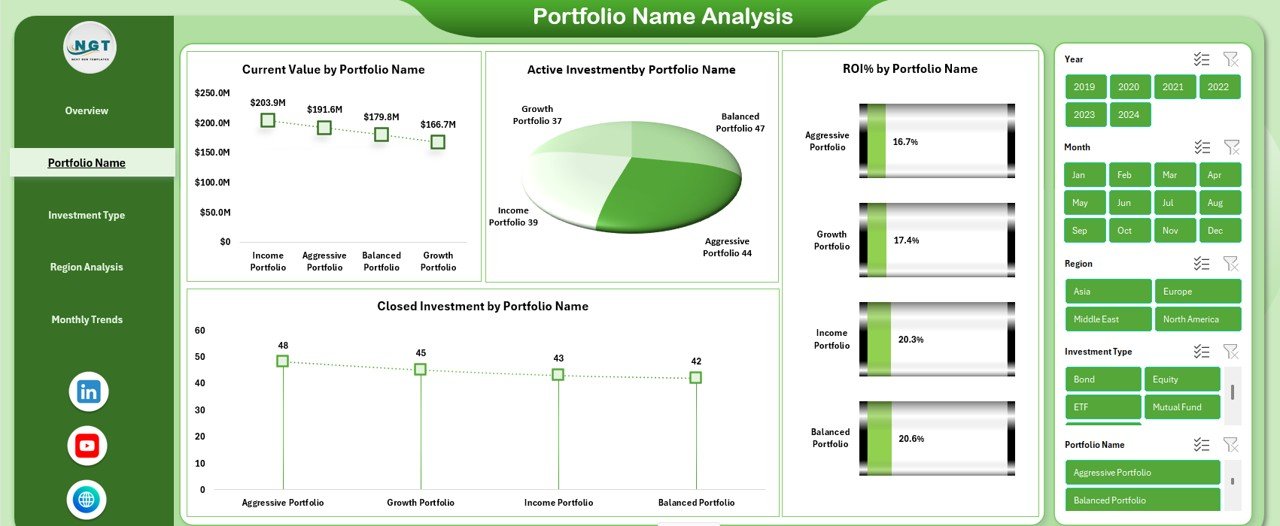
📌 Portfolio-Level Analysis – Analyze performance by portfolio name to identify top and underperforming portfolios.
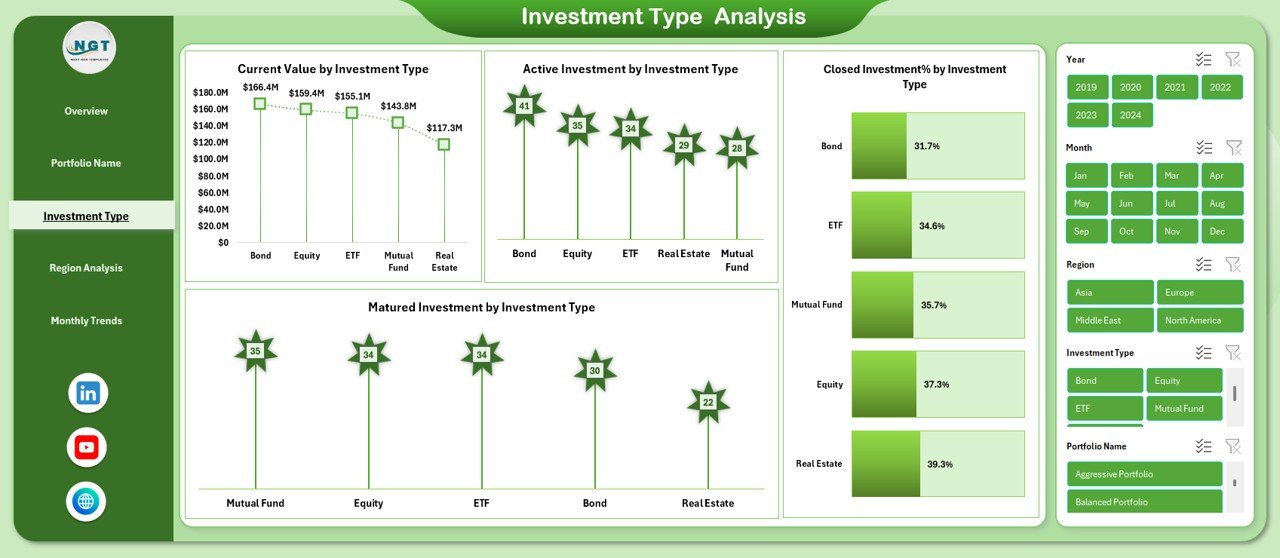
📌 Investment Type Analysis – Compare asset classes to understand which investment types deliver better returns.
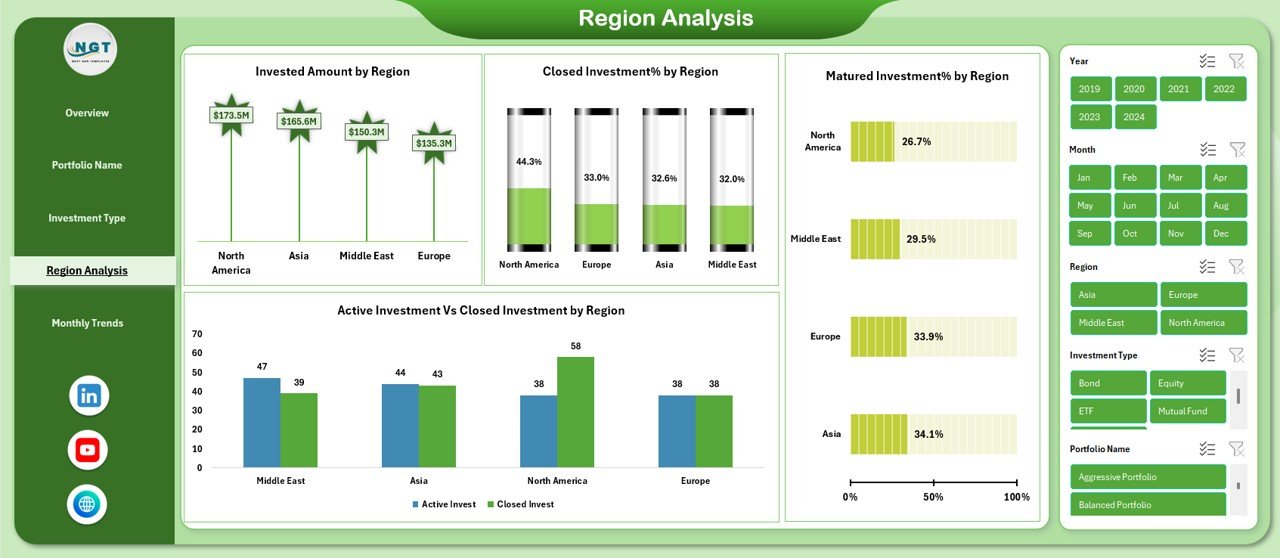
📌 Region-Wise Insights – Monitor regional exposure and performance to manage geographical risk effectively.
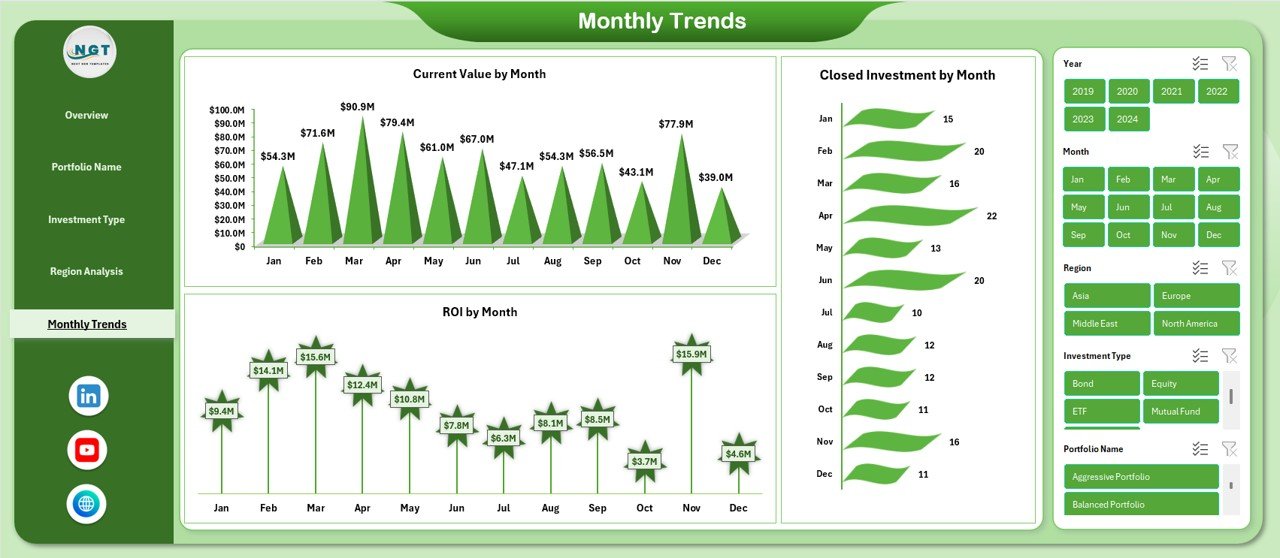
📌 Monthly Trend Analysis – Track growth, ROI, and closures over time to support forecasting and planning.
📌 Automated Calculations – ROI, percentages, and totals update automatically when data changes.
📌 Excel-Based & Customizable – Easily modify KPIs, charts, and layouts to match your investment strategy.

📦 What’s Inside the Investment Management Dashboard in Excel
This ready-to-use Excel file includes multiple professionally structured sheets designed for deep analysis and quick decision-making:
📊 Overview Sheet
-
Invested Amount
-
Current Value
-
ROI
-
Active Investments
-
Total Investments
-
Invested Amount by Country
-
Current Value by Region
-
Active Investment %
-
Invested Amount vs Current Value by Investment Type
📁 Portfolio Name Analysis
-
Current Value by Portfolio Name
-
Active Investment by Portfolio Name
-
Closed Investment by Portfolio Name
-
ROI % by Portfolio Name
📈 Investment Type Analysis
-
Current Value by Investment Type
-
Active Investment by Investment Type
-
Matured Investment by Investment Type
-
Closed Investment % by Investment Type
🌍 Region Analysis
-
Invested Amount by Region
-
Closed Investment % by Region
-
Active vs Closed Investment by Region
-
Matured Investment % by Region
📅 Monthly Trends
-
Current Value by Month
-
ROI by Month
-
Closed Investment by Month
Each sheet is logically designed to deliver clarity, accuracy, and actionable insights.
🛠️ How to Use the Investment Management Dashboard in Excel
Using this dashboard is simple—even if you are not an Excel expert:
1️⃣ Enter or paste your investment data into the structured Excel tables
2️⃣ Organize investments by portfolio, region, investment type, and date
3️⃣ Let built-in formulas calculate ROI, totals, and percentages automatically
4️⃣ Analyze performance using pivot tables and charts
5️⃣ Review insights instantly on interactive dashboard pages
Because Excel updates in real time, any data change reflects immediately across all sheets.
👥 Who Can Benefit from This Investment Management Dashboard in Excel
This dashboard is ideal for:
✔️ Individual investors managing personal portfolios
✔️ Portfolio and wealth managers
✔️ Financial analysts and consultants
✔️ Investment advisory firms
✔️ Finance teams and CFOs
✔️ Anyone seeking structured, data-driven investment decisions
Whether you manage a few investments or complex portfolios, this dashboard adapts to your needs.
Click here to read the Detailed blog post
Watch the step-by-step video tutorial:
Visit our YouTube channel to learn step-by-step video tutorials
YouTube.com/@PKAnExcelExpert


Reviews
There are no reviews yet.