
The mobile gaming industry moves at lightning speed. Every install, session, purchase, and ad impression generates data. However, data alone does not create winning games. Winning games come from tracking the right KPIs, spotting trends early, and taking fast action.
That is exactly why the Mobile Gaming KPI Dashboard in Power BI is a must-have performance intelligence tool 🚀.
This ready-to-use dashboard transforms raw mobile gaming data into clear KPIs, instant comparisons, and powerful trend insights, helping studios and publishers make smarter, faster, and more profitable decisions.
Built using Excel as the data source and Power BI for visualization, this dashboard allows gaming teams to monitor revenue, engagement, retention, growth, and performance KPIs in one centralized and interactive view—without complex technical setup.
🔑 Key Features of Mobile Gaming KPI Dashboard in Power BI
📊 Centralized Gaming KPI Monitoring
Track all critical mobile gaming KPIs in one structured Power BI dashboard.
📅 Dynamic Month & KPI Group Filters
Slice performance instantly by time period and KPI category.
🎯 Target vs Actual Performance Tracking
Quickly identify which KPIs meet targets and which require attention.
📈 MTD & YTD Performance Analysis
Monitor short-term campaign results and long-term business growth.
🔁 Current Year vs Previous Year Comparison
Understand growth trends and performance changes over time.
📉 Visual Trend Analysis with Combo Charts
Spot spikes, drops, and patterns using MTD and YTD trend visuals.
📘 LTB & UTB KPI Logic
Ensure accurate KPI evaluation with Lower-the-Better and Upper-the-better rules.
⚡ Excel + Power BI Integration
Simple Excel data entry combined with powerful Power BI analytics.
📂 What’s Inside the Mobile Gaming KPI Dashboard in Power BI
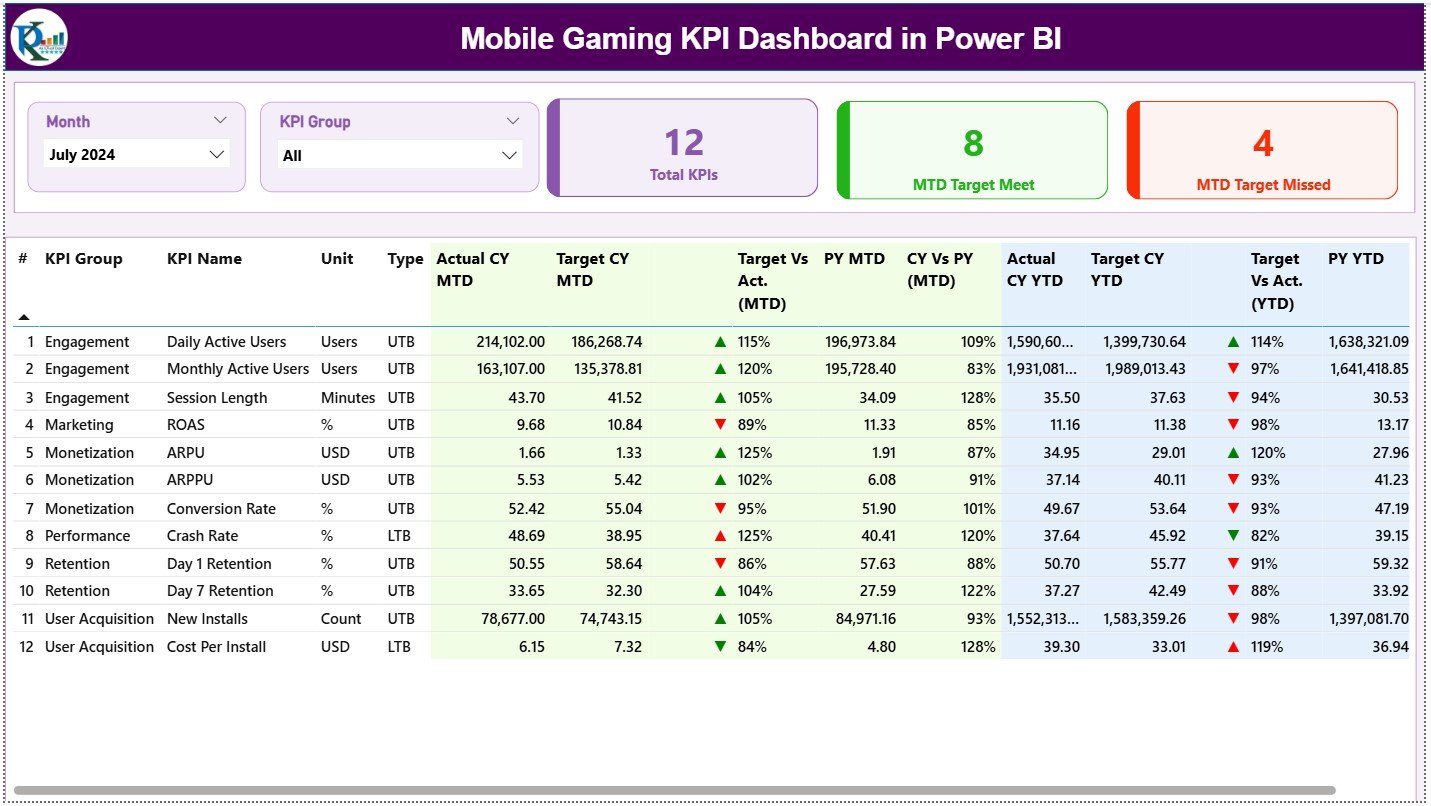
📌 Summary Page
The executive overview page showing overall KPI health at a glance.
Includes:
-
Month slicer
-
KPI Group slicer
-
KPI Cards
-
Detailed KPI performance table
KPI Cards Display:
-
Total KPIs Count
-
MTD Target Meet Count
-
MTD Target Missed Count
Detailed KPI Table Shows:
-
KPI Number, Group, Name, Unit, Type
-
MTD Actual, Target, Previous Year, % Variance
-
YTD Actual, Target, Previous Year, % Variance
-
Visual ▲ / ▼ performance indicators
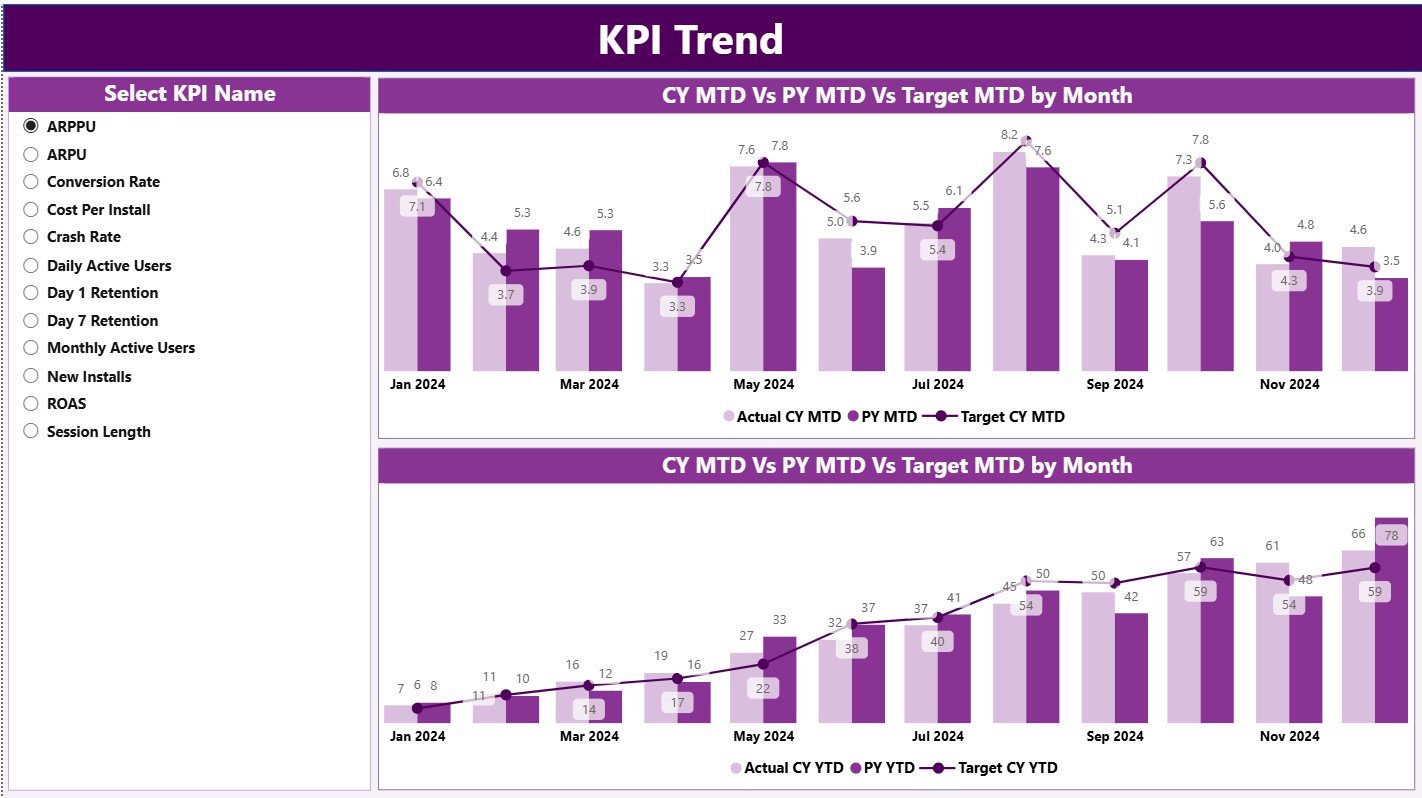
📈 KPI Trend Page
A focused analysis page for tracking KPI behavior over time.
Includes:
-
MTD Trend Combo Chart
-
YTD Trend Combo Chart
-
KPI Name slicer for instant KPI-level trend analysis
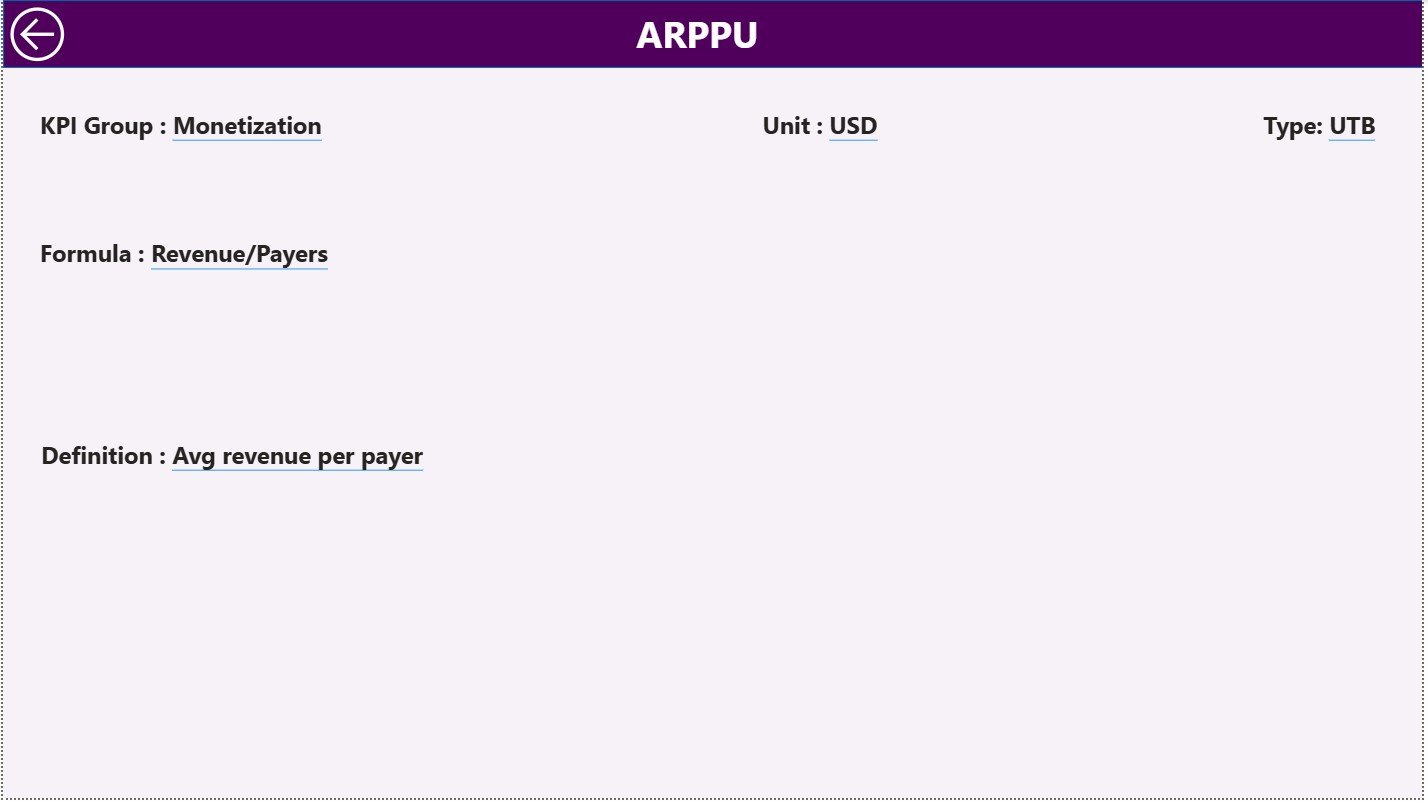
📘 KPI Definition Page
A drill-through reference page for KPI governance and clarity.
Displays:
-
KPI Formula
-
KPI Definition
-
KPI Unit
-
KPI Type (LTB / UTB)
This page ensures consistent interpretation across teams.
📑 Excel Data Structure
-
Input Actual Sheet – Actual MTD & YTD values
-
Input Target Sheet – Target MTD & YTD values
-
KPI Definition Sheet – KPI metadata and logic
⚙️ How to Use the Mobile Gaming KPI Dashboard in Power BI
📝 Step 1: Enter Data in Excel
Update actual and target KPI values in structured Excel sheets.
🔄 Step 2: Refresh Power BI
All visuals, KPIs, and calculations update automatically.
📊 Step 3: Analyze Performance
Use slicers, KPI tables, and icons to identify strong and weak areas.
📈 Step 4: Review Trends
Study MTD and YTD trends to understand performance direction.
🎯 Step 5: Optimize Strategy
Improve monetization, retention, and engagement using data-driven insights.
👥 Who Can Benefit from This Mobile Gaming KPI Dashboard in Power BI
🎮 Game Studios & Publishers – Track business health and growth
📊 Gaming Analysts – Analyze performance without rebuilding reports
📣 Marketing Teams – Monitor acquisition, revenue, and campaign impact
🧠 Product Managers & Producers – Track engagement and retention KPIs
🏢 Leadership & Executives – Get instant, high-level performance visibility
🔍 Click here to read the Detailed blog post
📺 Visit our YouTube channel to learn step-by-step video tutorials
👉 Youtube.com/@PKAnExcelExpert


Reviews
There are no reviews yet.