Airline catering is one of the most critical yet complex operational areas in the aviation industry. Every meal served, every delivery made on time, and every cost controlled directly influences passenger satisfaction, brand perception, and airline profitability. However, when catering performance data is scattered across spreadsheets or tracked manually, teams lose visibility and decision-making becomes reactive.
That is exactly why the Airline Catering KPI Dashboard in Excel is designed as a powerful, ready-to-use performance management solution for airline catering teams.
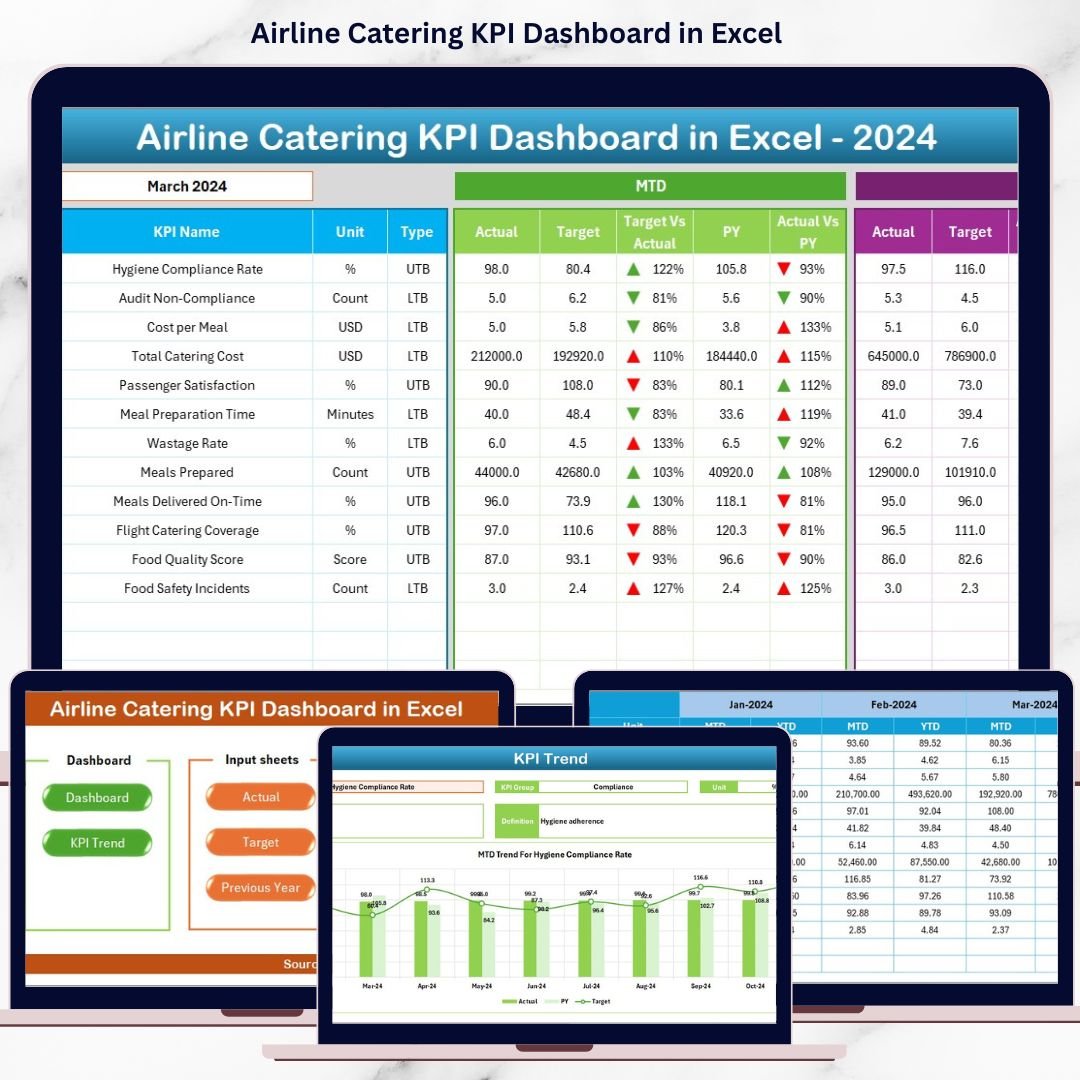
This professionally structured Excel dashboard converts raw catering data into clear KPIs, actionable insights, and trend analysis—without requiring any advanced technical skills or expensive BI tools. As a result, airline catering managers gain full control over performance, costs, quality, and service reliability.
🔑 Key Features of Airline Catering KPI Dashboard in Excel
🚀 Centralized KPI Monitoring
Track all airline catering KPIs in one structured and interactive dashboard instead of managing multiple disconnected files.
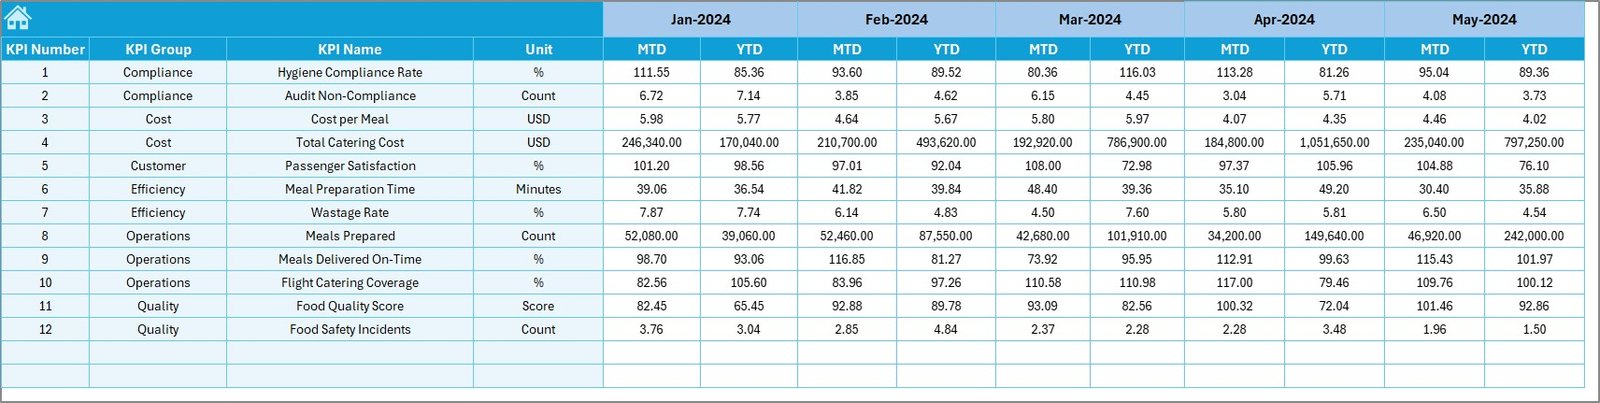
📅 MTD & YTD Performance Tracking
Analyze Month-to-Date and Year-to-Date actuals against defined targets and previous year benchmarks.
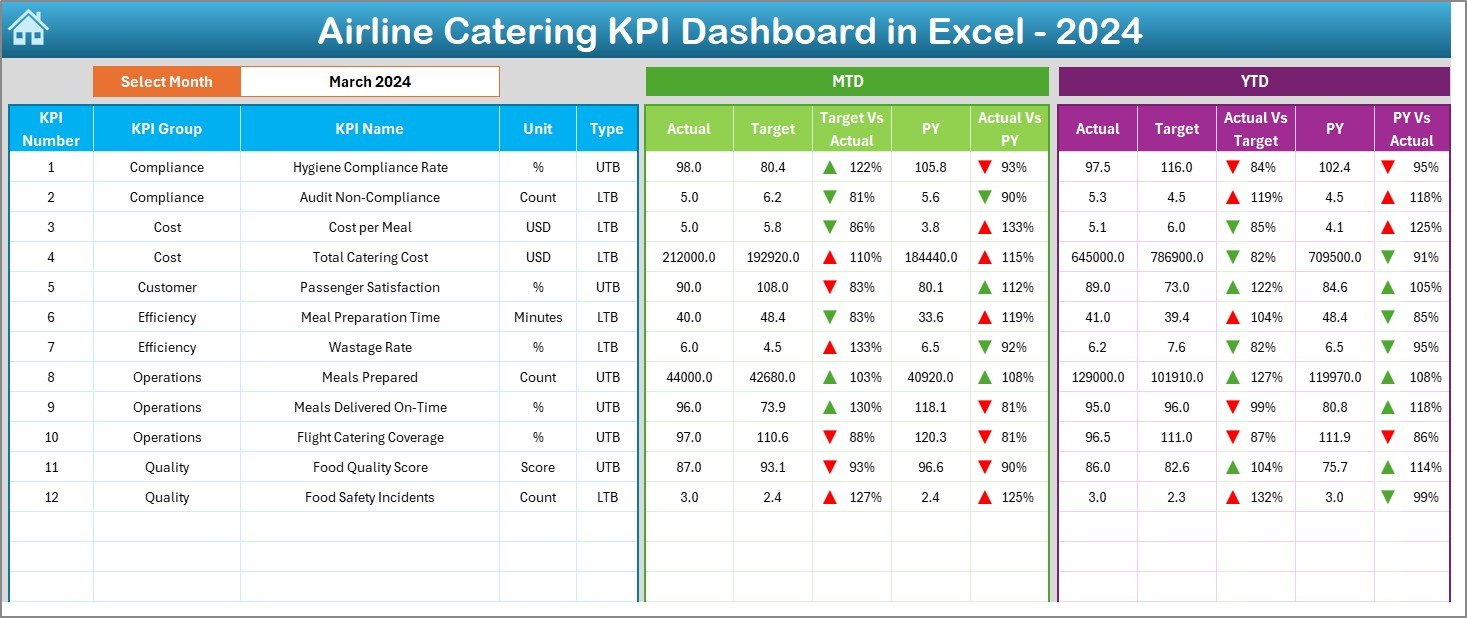
🎯 Target vs Actual & YoY Comparison
Instantly identify performance gaps using automated calculations and visual indicators.
📊 Conditional Formatting with Status Arrows
Up and down arrows highlight positive and negative performance for quick interpretation.
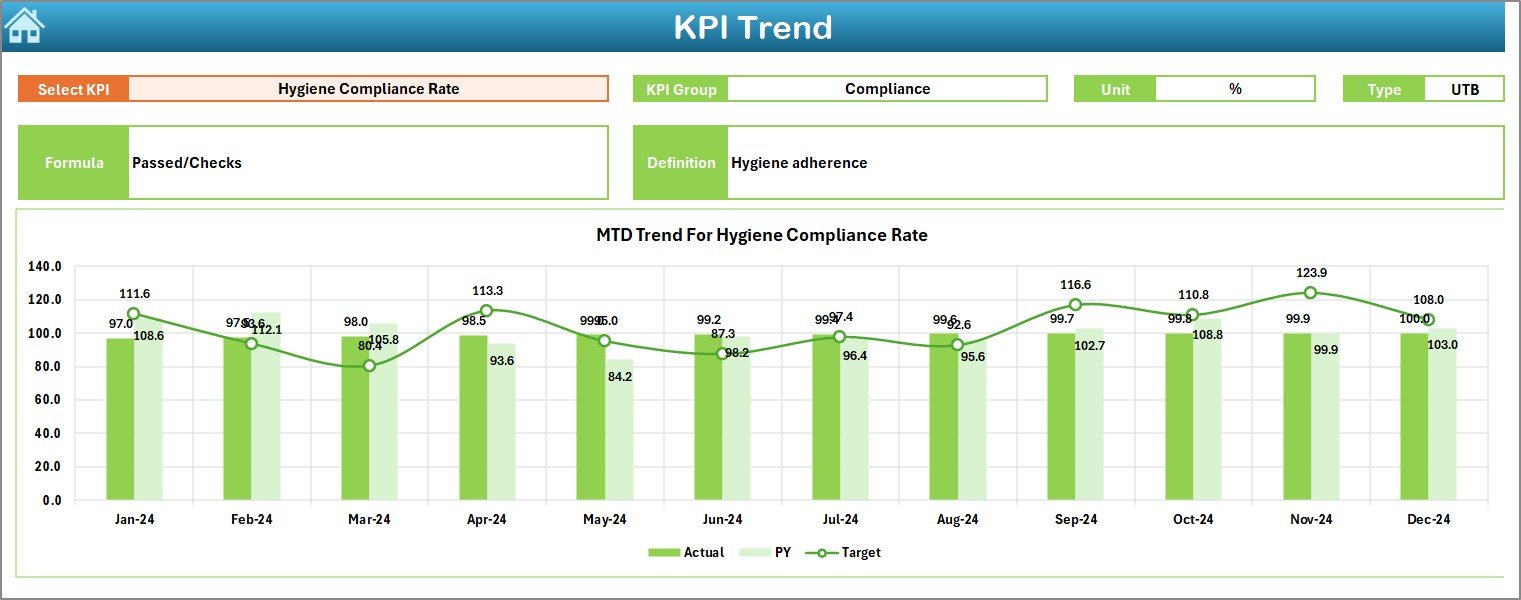
📈 Interactive KPI Trend Analysis
Monitor KPI-level trends across months to identify seasonality, risks, and improvement opportunities.
🧭 Smart Navigation System
Use the Summary Page with navigation buttons to move between sheets effortlessly.
💰 Cost-Effective Excel-Based Solution
No Power BI licenses or external tools required—fully built in Excel.
📦 What’s Inside the Airline Catering KPI Dashboard in Excel
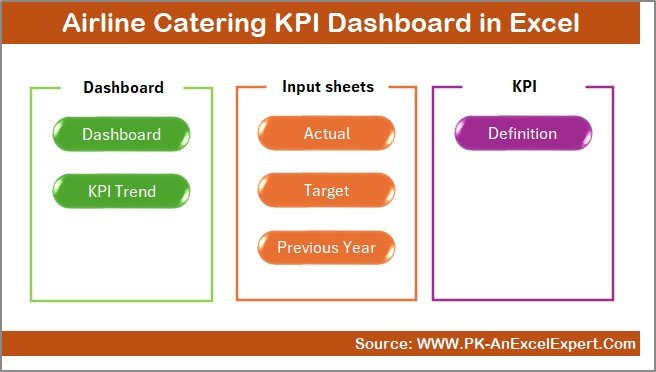
This dashboard includes 7 well-designed worksheets, each serving a specific purpose:
📌 Summary Page – Acts as an index with navigation buttons for fast access
📌 Dashboard Sheet – Displays all KPIs with MTD & YTD actuals, targets, PY values, and comparisons
📌 Trend Sheet – KPI-wise deep analysis with MTD and YTD trend charts
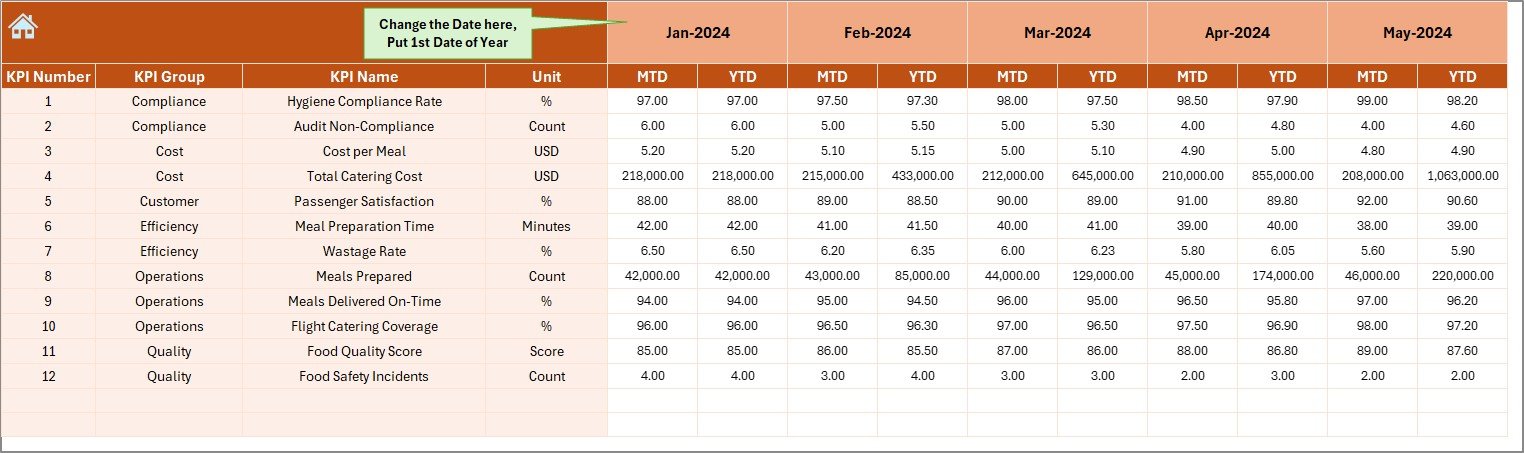
📌 Actual Numbers Sheet – Structured input for monthly MTD and YTD actual values
📌 Target Sheet – Enter monthly and cumulative performance targets
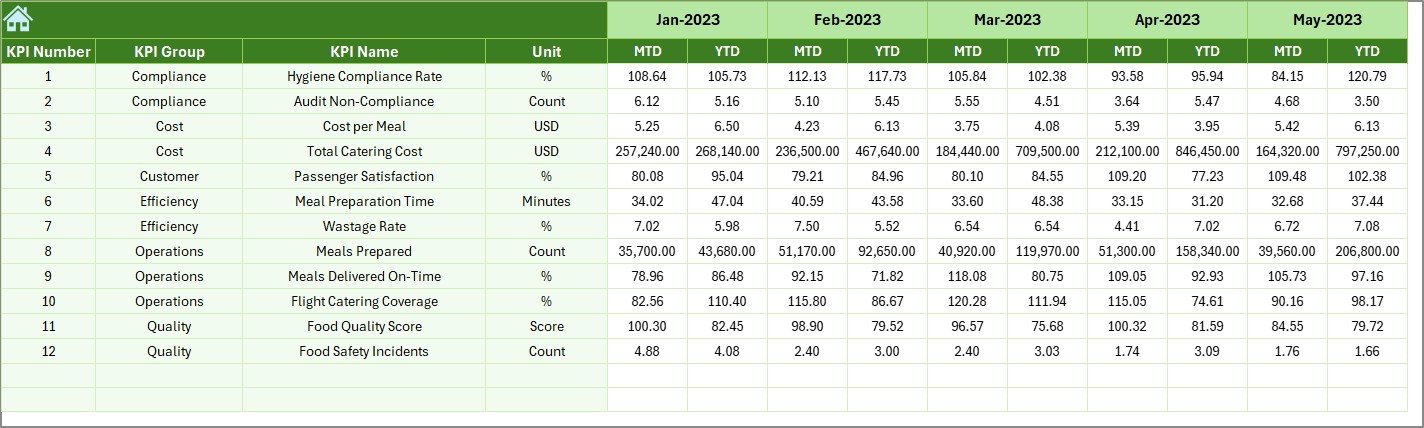
📌 Previous Year Sheet – Capture historical MTD and YTD data for YoY analysis
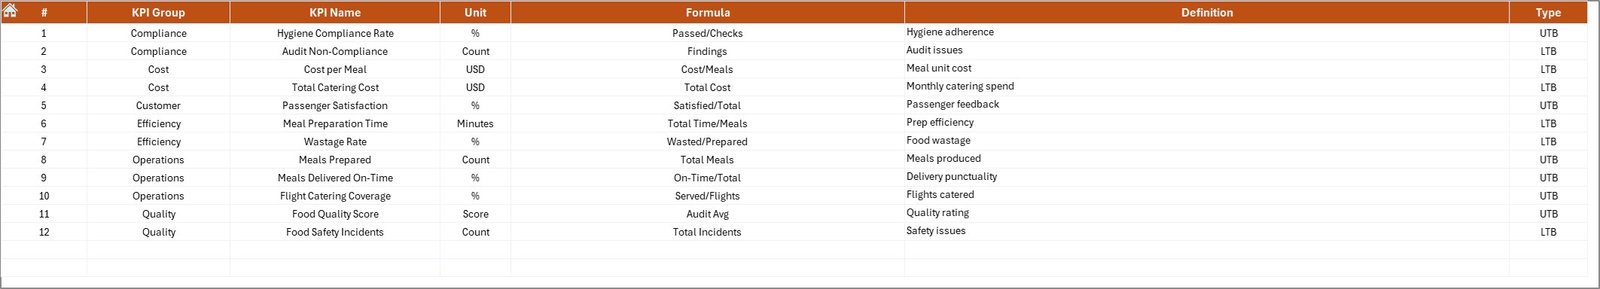
📌 KPI Definition Sheet – Stores KPI name, group, unit, formula, and definition
Together, these sheets create a complete airline catering performance management system.
🛠️ How to Use the Airline Catering KPI Dashboard in Excel
Using this dashboard is simple and intuitive:
1️⃣ Enter KPI definitions once in the KPI Definition Sheet
2️⃣ Input monthly actual data in the Actual Numbers Sheet
3️⃣ Set performance targets in the Target Sheet
4️⃣ Add historical data in the Previous Year Sheet
5️⃣ Select the month from the drop-down (cell D3)
6️⃣ Instantly view updated KPIs, trends, and comparisons
Because all calculations are automated, users only focus on data entry and decision-making.
👥 Who Can Benefit from This Airline Catering KPI Dashboard in Excel
✈️ Airline Catering Managers
📊 Airline Operations & Performance Teams
🍽️ In-Flight Catering Service Providers
📈 Aviation Operations Analysts
🏢 Airline Management & Leadership Teams
🧾 Cost Control & Quality Assurance Teams
Anyone responsible for catering efficiency, cost control, service quality, or performance reporting will benefit from this dashboard.
Click here to read the detailed blog post
Watch the step-by-step video tutorial:
Visit our YouTube channel to learn step-by-step video tutorials
YouTube.com/@PKAnExcelExpert


Reviews
There are no reviews yet.