In today’s high-pressure financial landscape, treasury teams cannot afford delays, errors, or blind spots. Cash flow volatility, liquidity risks, funding gaps, and missed targets can quickly impact business stability. That is exactly why the Treasury Management KPI Dashboard in Power BI is designed—to give treasury and finance leaders instant visibility, absolute control, and confident decision-making from one powerful dashboard.
This ready-to-use dashboard converts complex treasury data into clear, interactive, and actionable insights. Instead of managing multiple Excel files and manual reports, you get a centralized performance command center that tracks Month-to-Date (MTD), Year-to-Date (YTD), target vs actual, and year-on-year treasury KPIs with precision. As a result, treasury teams can shift their focus from reporting to strategy, optimization, and risk mitigation.
🚀 Key Features of Treasury Management KPI Dashboard in Power BI
📊 Centralized Treasury KPI Monitoring
Track all critical treasury KPIs—cash, liquidity, funding, and performance metrics—in one interactive Power BI dashboard.
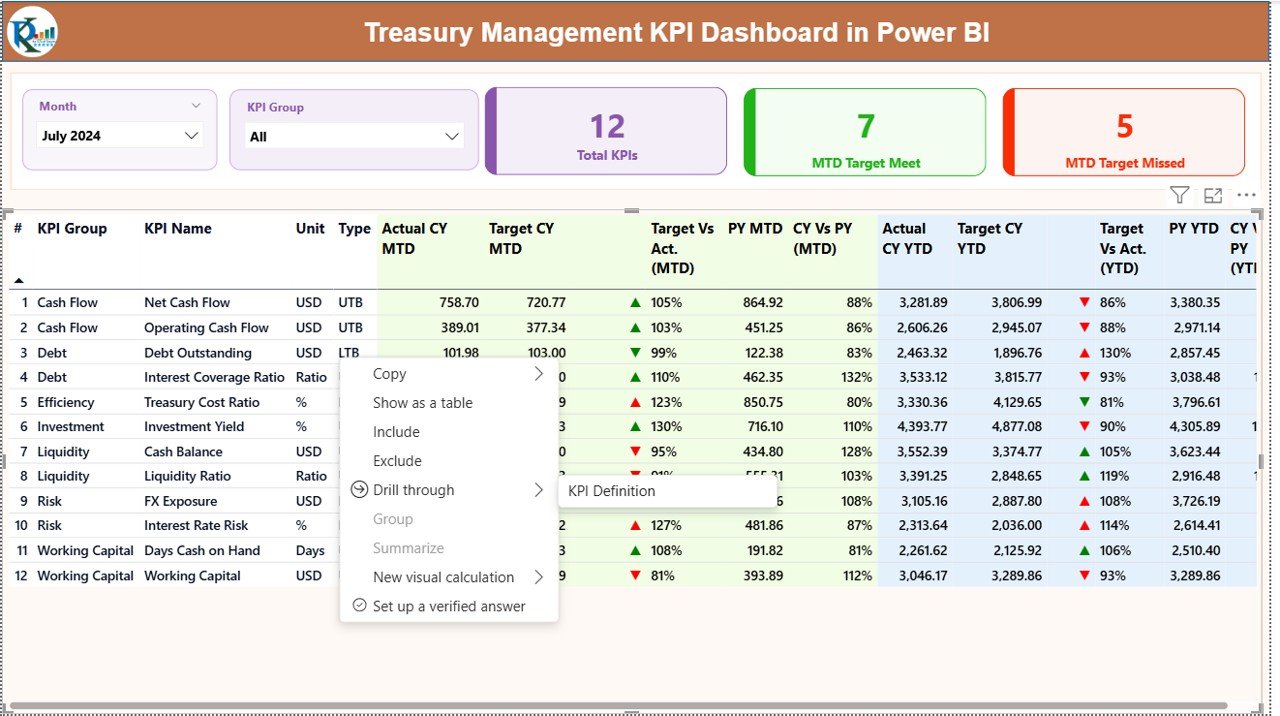
📅 Dynamic Month & KPI Group Slicers
Instantly filter data by month and KPI group to analyze specific treasury segments without manual recalculation.
📈 MTD & YTD Performance Tracking
Monitor short-term and long-term treasury performance side by side for better financial control.
🎯 Target vs Actual Analysis
Quickly identify overperformance and underperformance using percentage variance and visual indicators.
🔄 Year-on-Year Comparison
Compare current year performance with previous year results to spot trends and risks early.
📌 Visual Performance Indicators
Green and red icons instantly highlight KPIs that meet or miss targets, saving valuable analysis time.
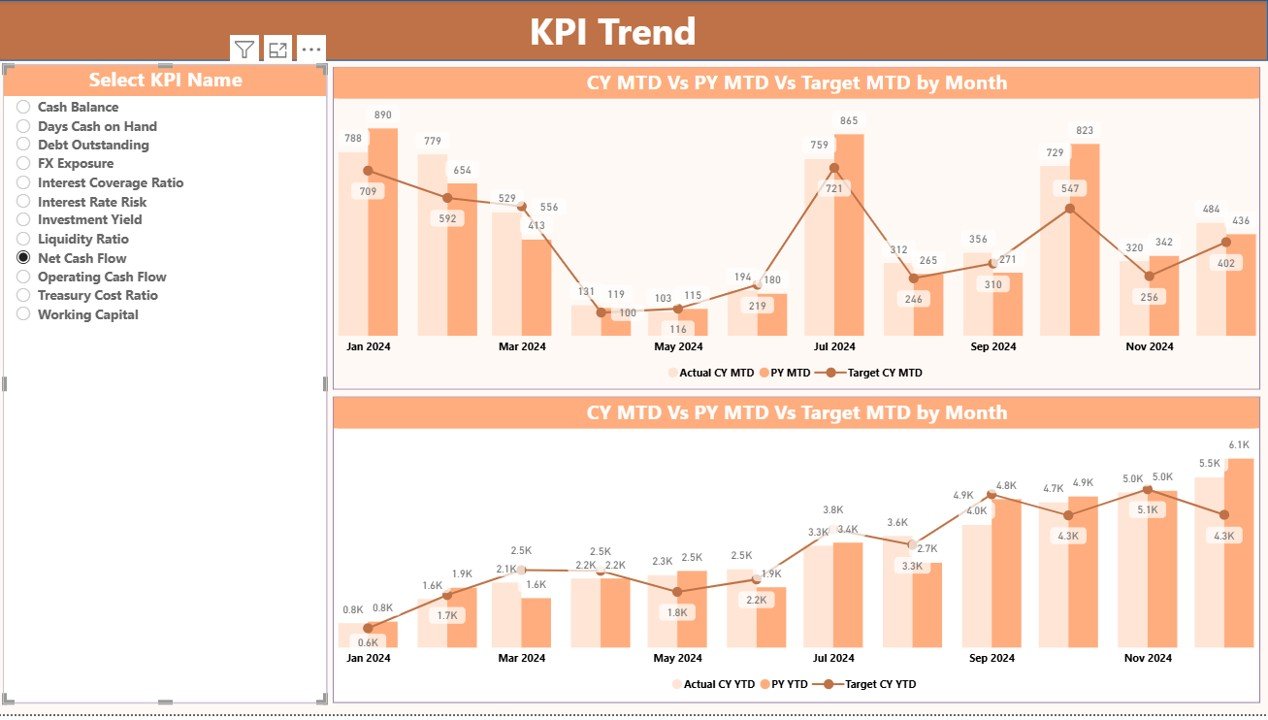
📉 Interactive Trend Analysis
Combo charts display MTD and YTD trends for deeper insights into treasury performance patterns.
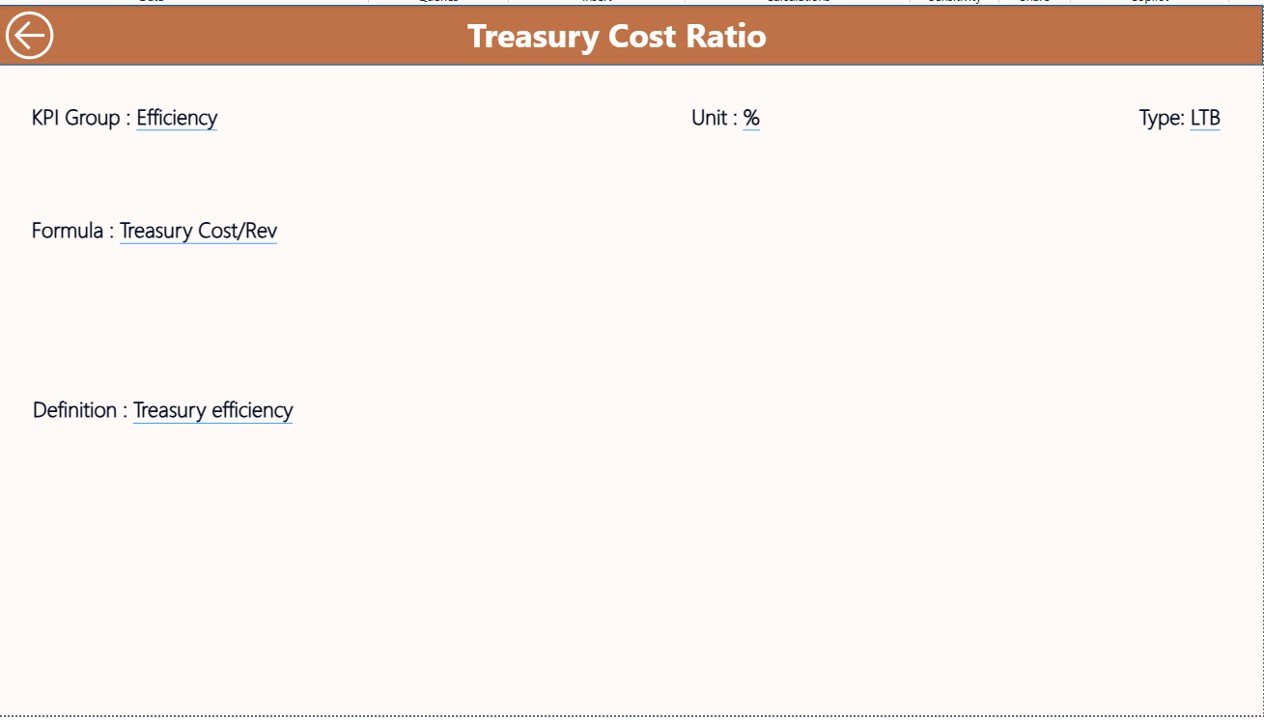
📘 Built-In KPI Definitions
Ensure clarity and consistency with a dedicated KPI definition page that explains formulas, units, and KPI types.
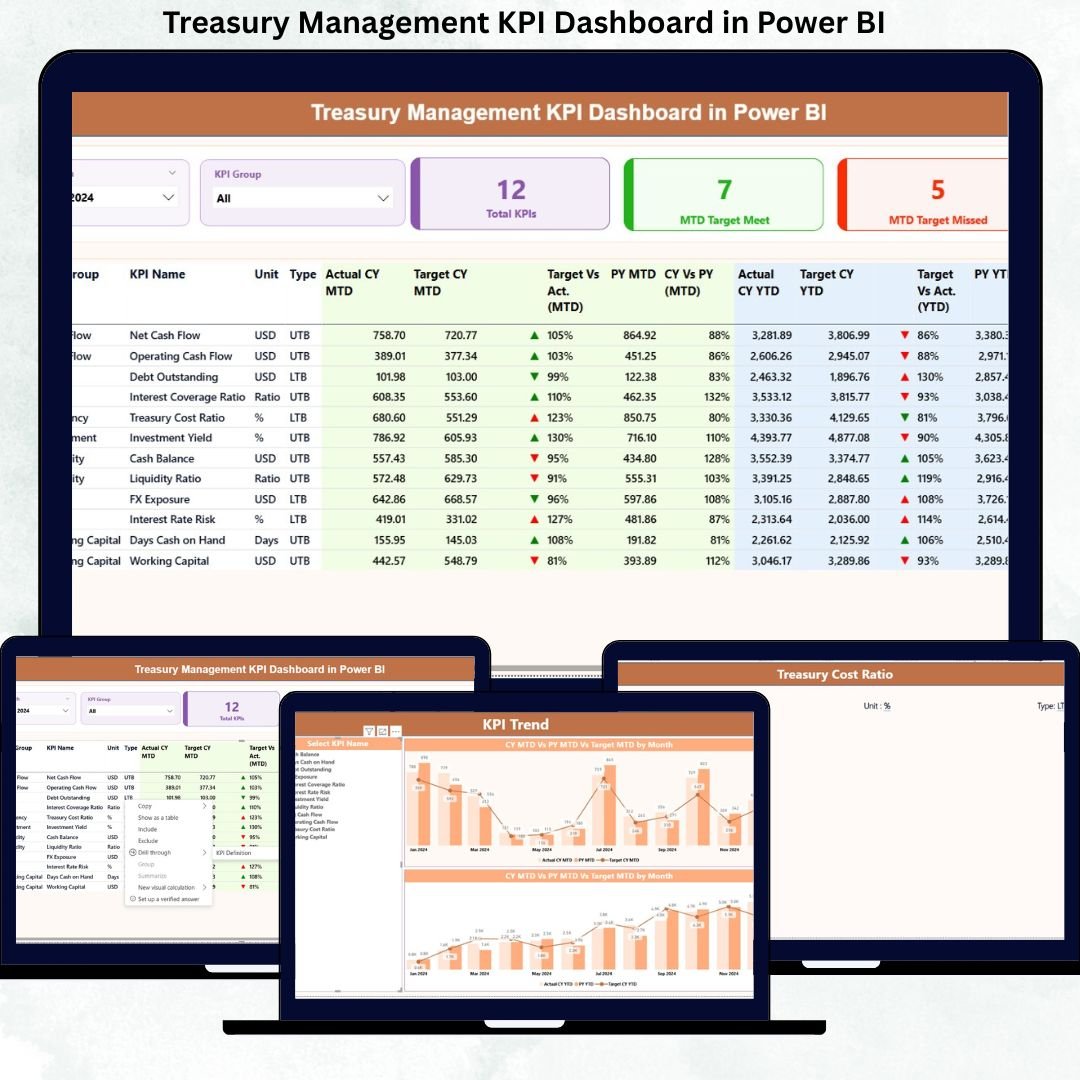
📦 What’s Inside the Treasury Management KPI Dashboard
This Power BI solution includes three professionally designed dashboard pages, each serving a specific analytical purpose:
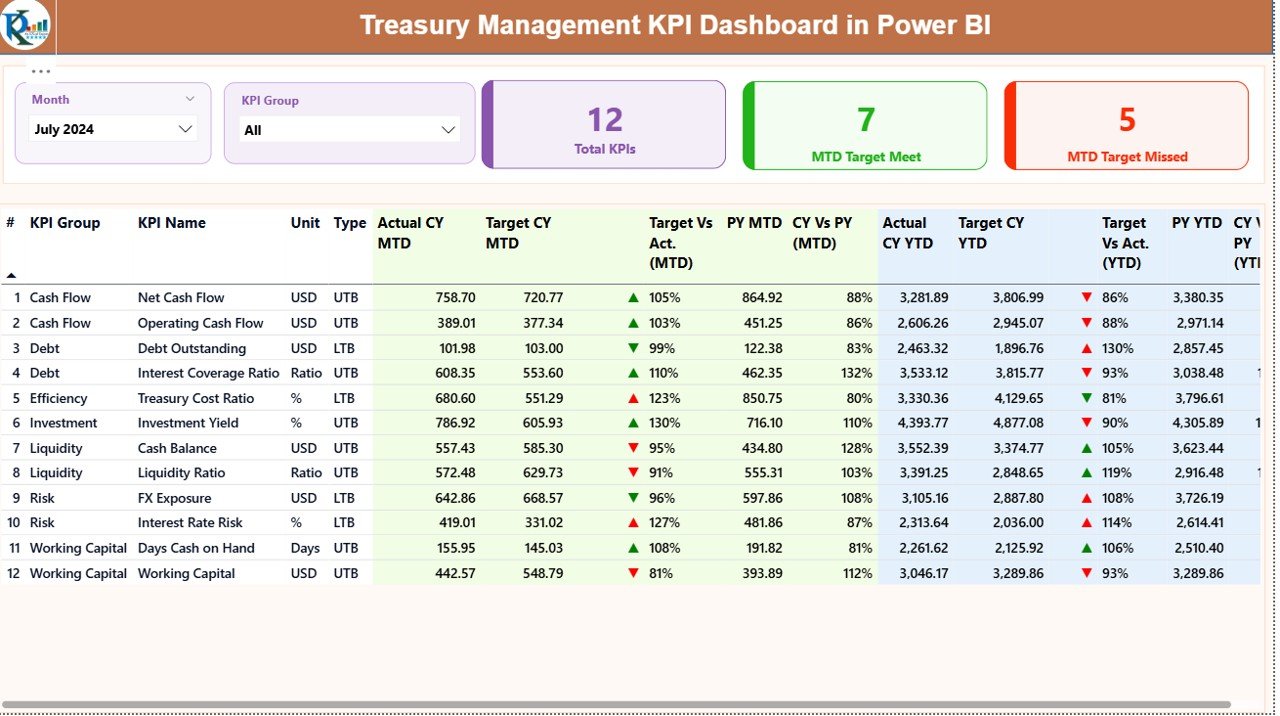
✔ Summary Page – Your main control center showing KPI cards, detailed MTD and YTD tables, target comparisons, and performance icons.
✔ KPI Trend Page – Interactive MTD and YTD combo charts with KPI-wise trend analysis for forecasting and planning.
✔ KPI Definition Page – Drill-through page displaying KPI formulas, definitions, units, and whether the KPI is Lower-the-Better or Upper-the-Better.
Additionally, the dashboard is powered by a structured Excel data model, including:
-
Actual performance input sheet
-
Target input sheet
-
KPI definition master sheet
This ensures easy updates, scalability, and long-term usability.
🛠️ How to Use the Treasury Management KPI Dashboard
1️⃣ Enter actual treasury performance data in the Excel input file.
2️⃣ Update monthly and YTD targets in the target sheet.
3️⃣ Maintain clear KPI definitions in the KPI master sheet.
4️⃣ Refresh the Power BI dashboard.
5️⃣ Use slicers to analyze performance by month or KPI group.
6️⃣ Monitor MTD, YTD, target achievement, and trends instantly.
No complex Power BI development knowledge is required—this dashboard is designed for plug-and-play usage.
🎯 Who Can Benefit from This Treasury Management KPI Dashboard
👨💼 Treasury Managers
📊 Finance Controllers
💼 CFOs & Finance Leaders
📈 Financial Analysts
⚠️ Risk Management Teams
🏢 Corporate Finance Departments
Whether you manage a mid-sized organization or a large enterprise, this dashboard adapts seamlessly to your treasury reporting needs.
Click here to read the Detailed blog post
Watch the step-by-step video tutorial:


Reviews
There are no reviews yet.