Running a successful TV channel today is not about intuition—it is about real-time performance tracking, clear targets, and fast decisions. When viewership data, revenue KPIs, and operational metrics remain scattered across Excel files, leadership loses visibility and momentum.
That is exactly why the TV Channels KPI Dashboard in Power BI is a must-have solution for modern broadcasters. 🚀
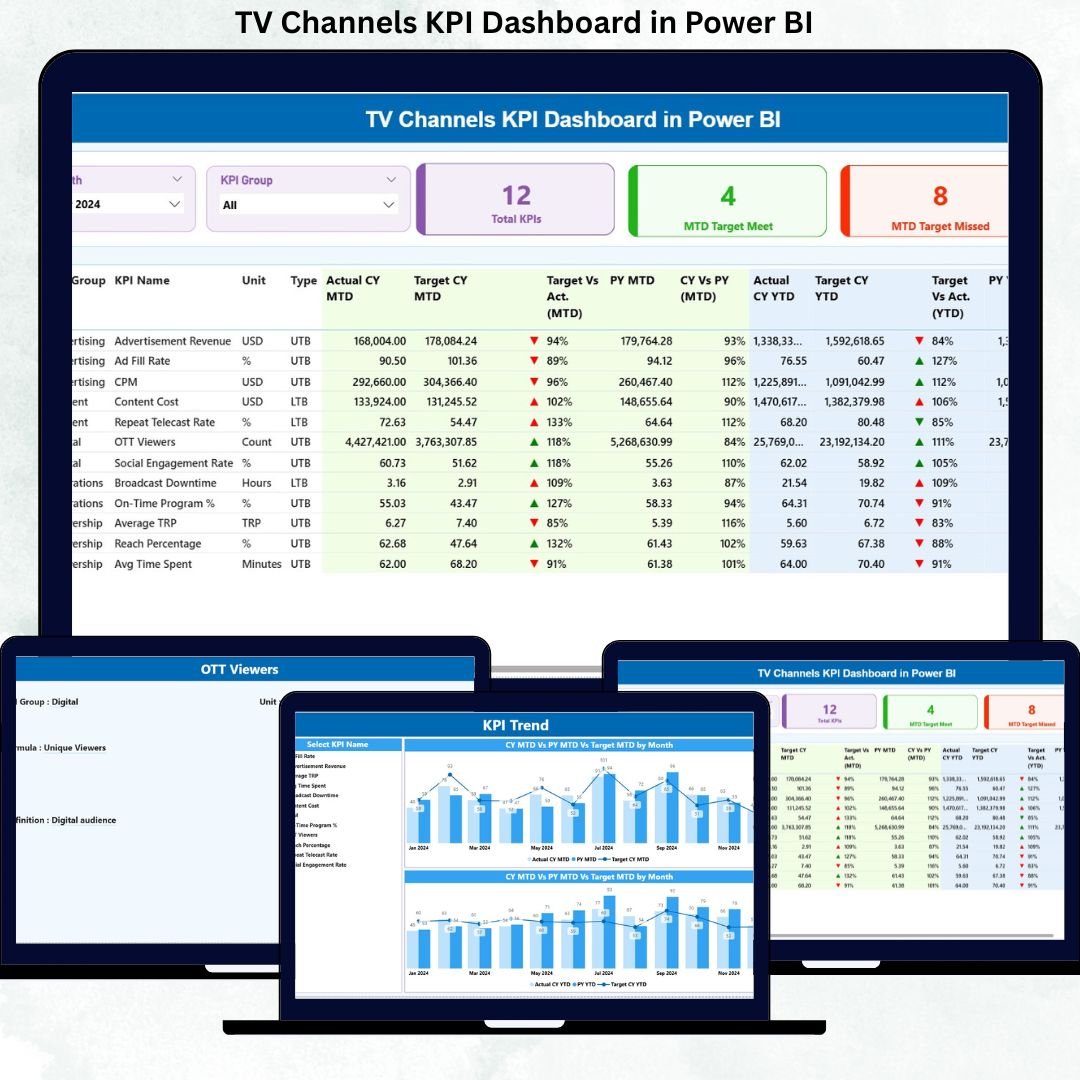
This ready-to-use dashboard converts raw Excel data into clear visuals, instant comparisons, and actionable insights—all in one powerful Power BI report.
Designed for media houses, broadcasting teams, and analytics professionals, this dashboard helps you track MTD and YTD performance, compare targets vs actuals, and identify trends before they impact results.
🔑 Key Features of TV Channels KPI Dashboard in Power BI
📊 Centralized KPI Monitoring
Track all TV channel KPIs—viewership, revenue, efficiency, and operations—in one interactive Power BI dashboard.
📅 Dynamic Month & KPI Group Filters
Slice data by month and KPI group to focus instantly on what matters most.
🎯 Target vs Actual Comparison
Identify performance gaps clearly with icons, percentages, and visual indicators.
📈 MTD & YTD Performance Tracking
Monitor short-term results while staying aligned with long-term goals.
🔁 Current Year vs Previous Year Analysis
Spot growth patterns and declines using CY vs PY comparisons.
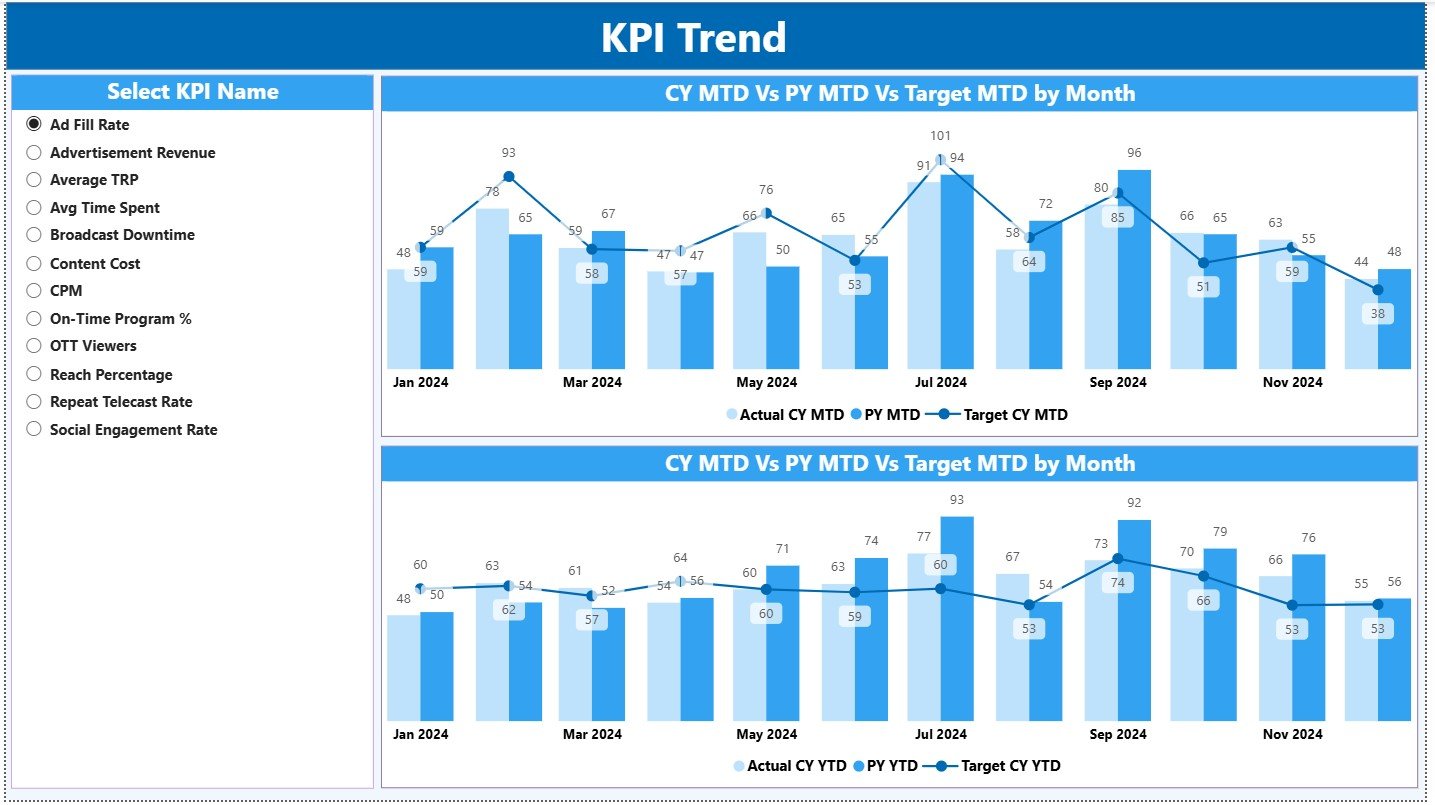
📉 Trend Analysis with Combo Charts
Analyze MTD and YTD trends through easy-to-read bar and line charts.
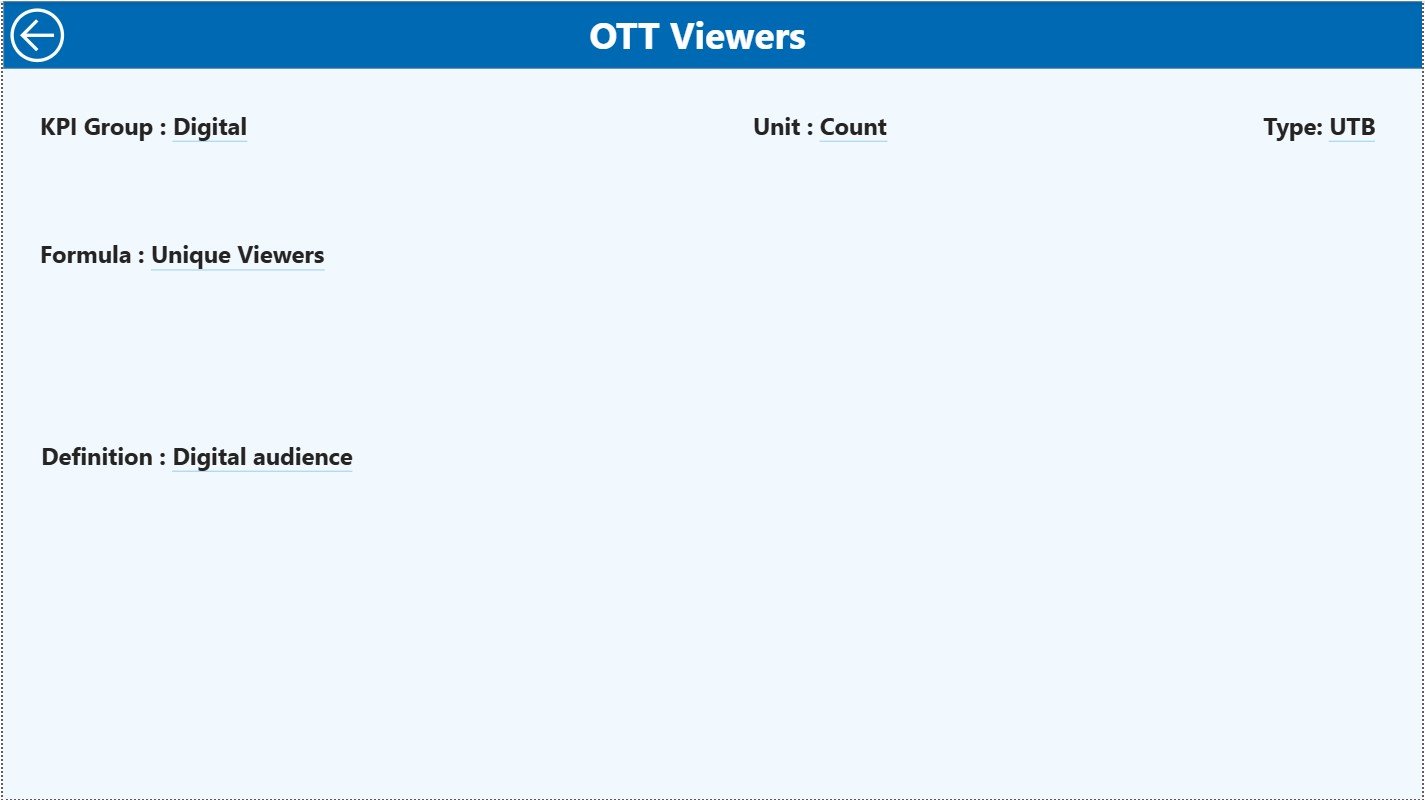
📘 Built-in KPI Definition Page
Avoid confusion with a dedicated page showing KPI formula, definition, unit, and logic.
⚡ Excel + Power BI Integration
Use Excel for data entry and Power BI for analytics—simple, flexible, and scalable.
📂 What’s Inside the TV Channels KPI Dashboard in Power BI
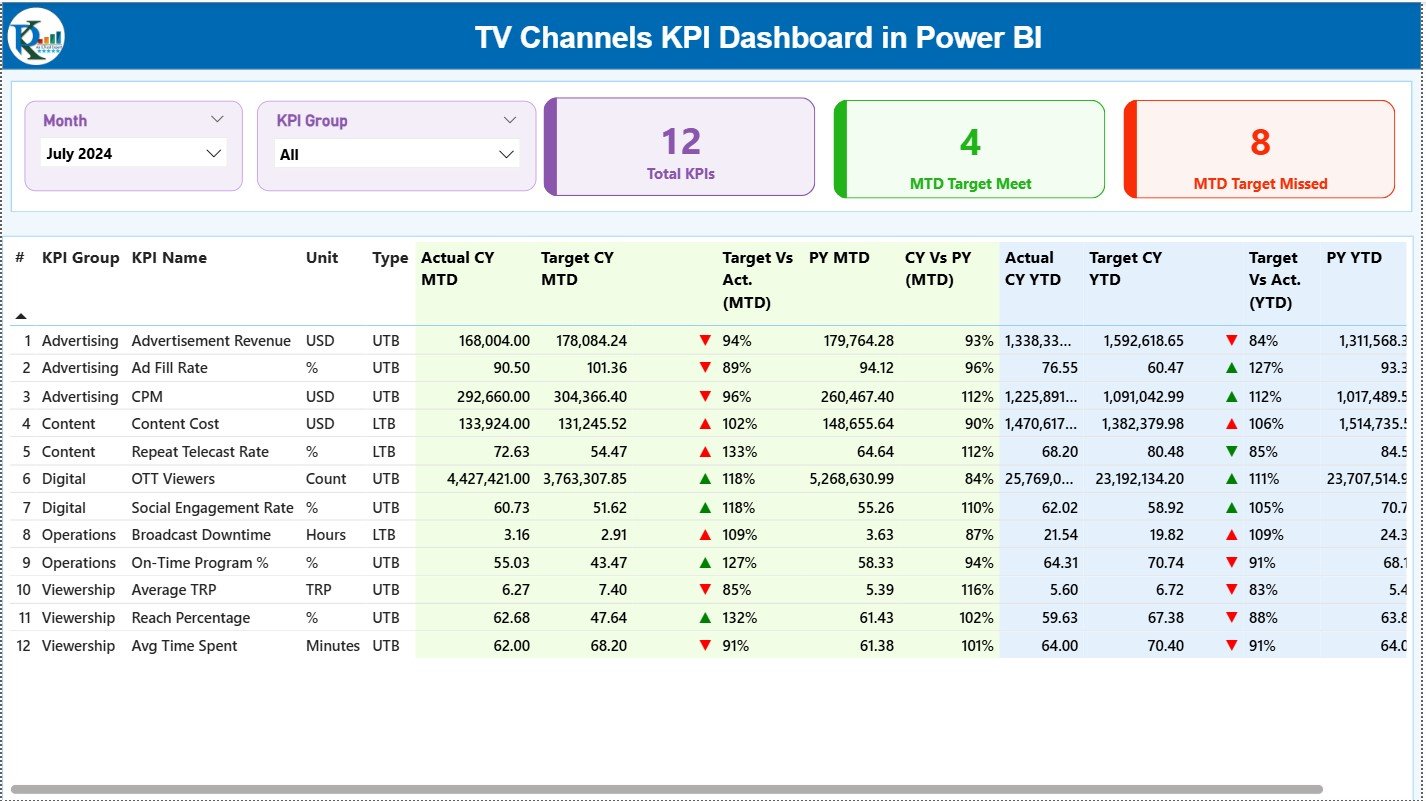
📄 Summary Page
Your performance command center with KPI cards, slicers, and a detailed KPI table showing MTD and YTD results.
📊 KPI Trend Page
Visualize KPI performance over time using combo charts for both MTD and YTD values.
📘 KPI Definition Page
Drill-through reference page displaying KPI logic, formula, unit, and LTB/UTB classification.
📑 Excel Data Structure
-
Input Actual Sheet
-
Input Target Sheet
-
KPI Definition Sheet
This structured design keeps data organized and easy to update.
⚙️ How to Use the TV Channels KPI Dashboard in Power BI
📝 Step 1: Enter Data in Excel
Update actual values, targets, and KPI definitions in structured Excel sheets.
🔗 Step 2: Connect Excel to Power BI
Refresh the Power BI model to pull the latest data automatically.
📊 Step 3: Analyze Performance
Use slicers, tables, and charts to evaluate MTD, YTD, and YoY performance instantly.
🎯 Step 4: Take Action
Identify underperforming KPIs early and optimize content, revenue, and operations.
👥 Who Can Benefit from This TV Channels KPI Dashboard in Power BI
📺 TV Channel Managers – Track overall channel performance with confidence
📊 Media Analysts – Analyze trends, targets, and performance gaps
💰 Finance & Revenue Teams – Monitor targets and advertising efficiency
📣 Programming & Content Teams – Evaluate content impact through KPIs
🏢 Executives & Leadership – Make data-driven strategic decisions fast
🔍 Click here to read the Detailed blog post
📺 Visit our YouTube channel to learn step-by-step video tutorials
👉 Youtube.com/@PKAnExcelExpert


Reviews
There are no reviews yet.