The global biofuels industry is under constant pressure. Governments demand higher renewable energy output. Sustainability targets grow stricter every year. At the same time, biofuel producers must control efficiency, costs, emissions, and production volumes—all without slowing operations.
That is exactly why the Biofuels KPI Dashboard in Excel becomes a mission-critical performance management tool.
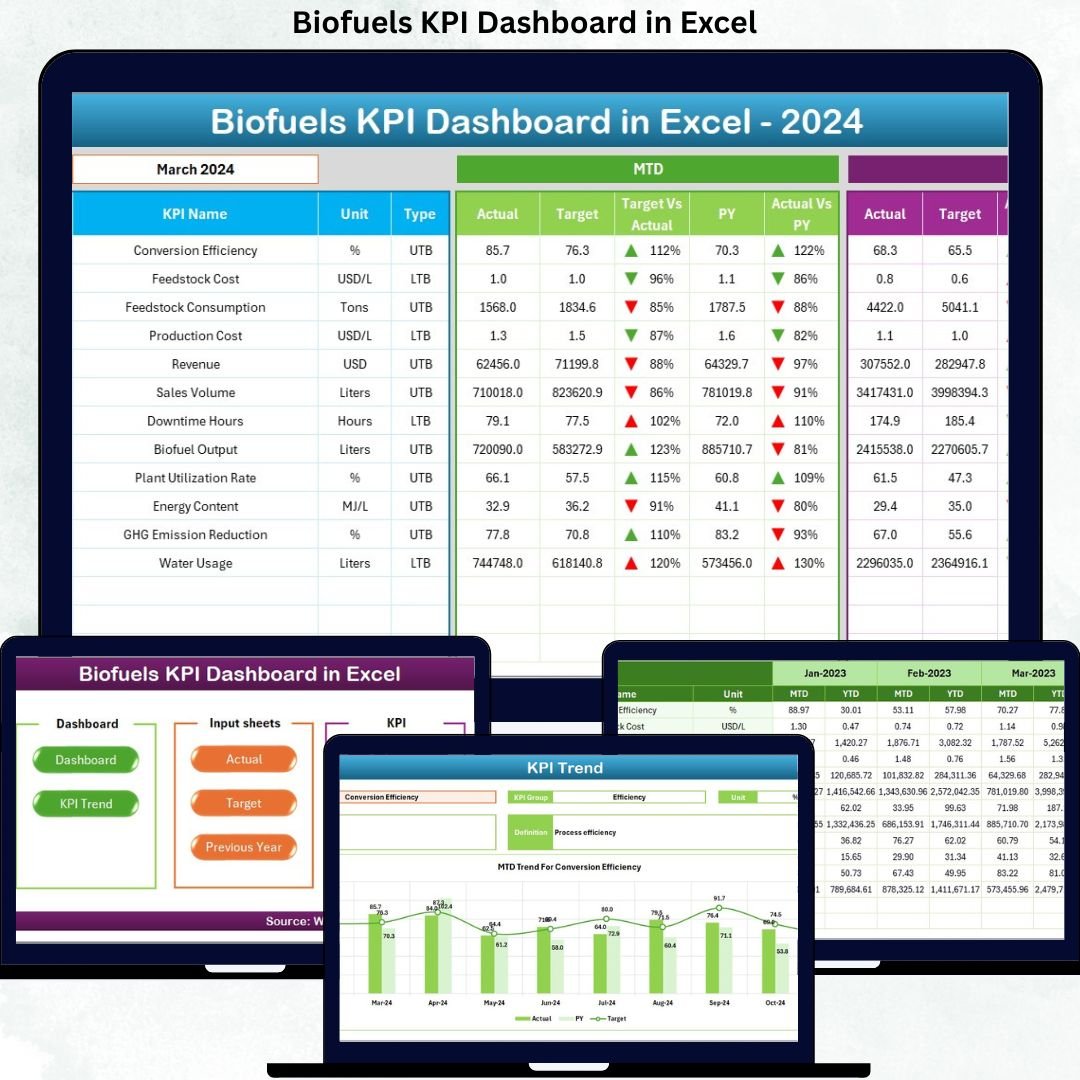
This ready-to-use Excel dashboard transforms complex biofuel data into clear KPIs, visual trends, and instant performance insights. Instead of wasting hours on manual reports and disconnected spreadsheets, your team gains one centralized dashboard that shows exactly what is working—and what needs attention.
Built entirely in Excel, this dashboard offers the perfect balance between power, simplicity, and flexibility, making it ideal for both operational teams and leadership.
🚀 Key Features of Biofuels KPI Dashboard in Excel
📊 Centralized KPI Monitoring
Track all biofuel production, efficiency, cost, and sustainability KPIs in one structured Excel dashboard.
🎯 MTD & YTD Performance Tracking
Monitor short-term operational performance and long-term trends simultaneously.
📈 Target vs Actual Analysis
Automatically compare actual results with planned targets to identify gaps early.
🔁 Previous Year Benchmarking
Measure real improvement using year-over-year performance comparisons.
🔼🔽 Visual Performance Indicators
Conditional formatting with up and down arrows highlights strong and weak KPIs instantly.
🧭 Smart Dashboard Navigation
One-click buttons allow smooth movement across dashboard, trend, and input sheets.
🧩 Fully Excel-Based Solution
No macros, no BI tools—easy to maintain, customize, and share.
⏱️ Time-Saving Automation
Reduce manual calculations and focus on operational insights instead.
📦 What’s Inside the Biofuels KPI Dashboard in Excel
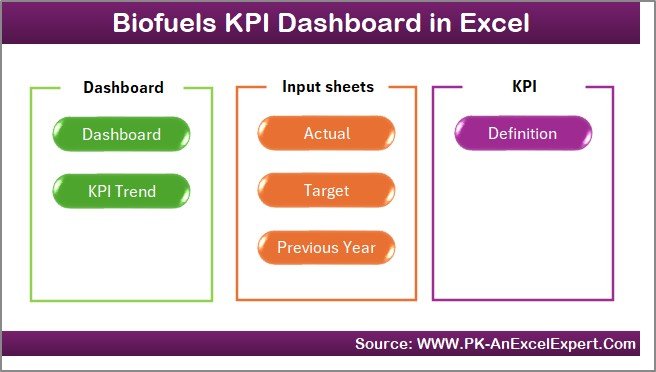
This product includes a professionally designed Excel file with 7 well-structured worksheets, each serving a specific purpose.
📌 Home Sheet – Navigation hub with one-click buttons
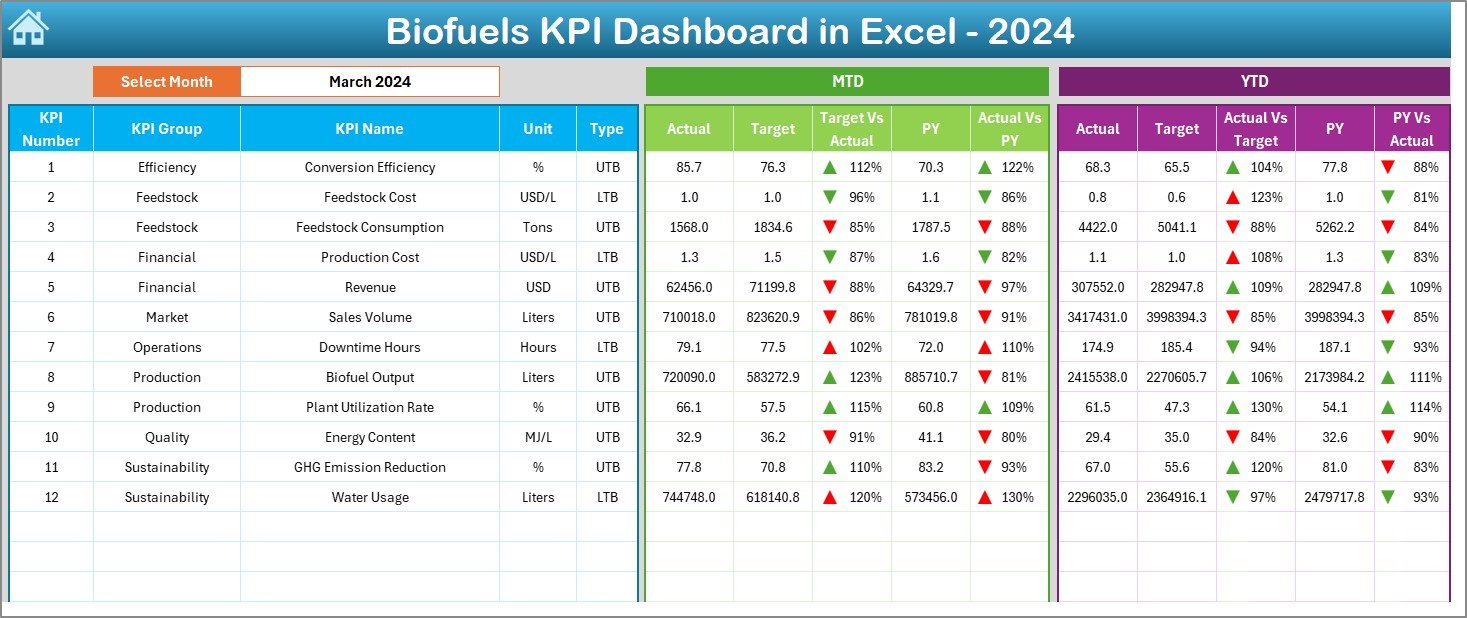
📊 Dashboard Sheet – Complete KPI overview with MTD & YTD metrics
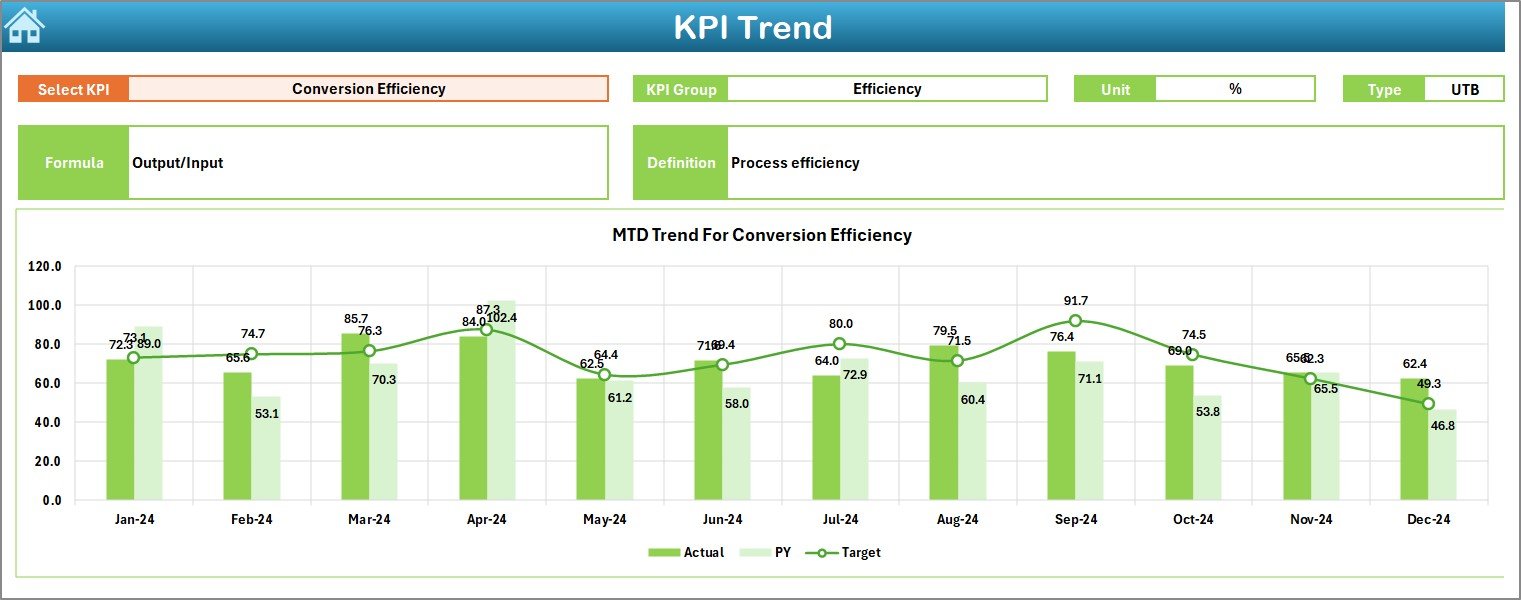
📈 KPI Trend Sheet – Detailed KPI-level trend analysis
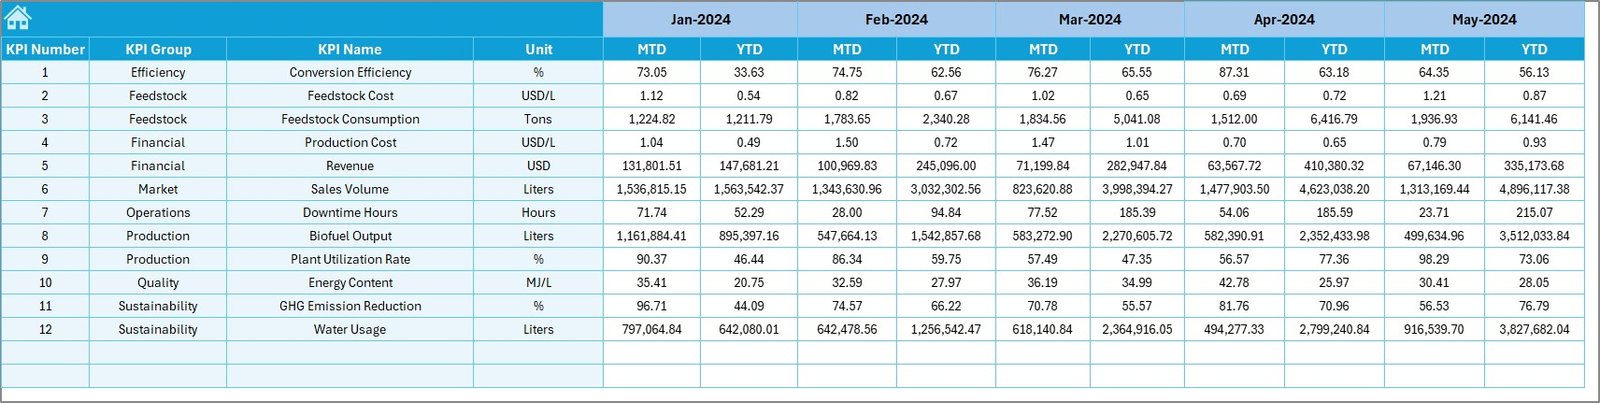
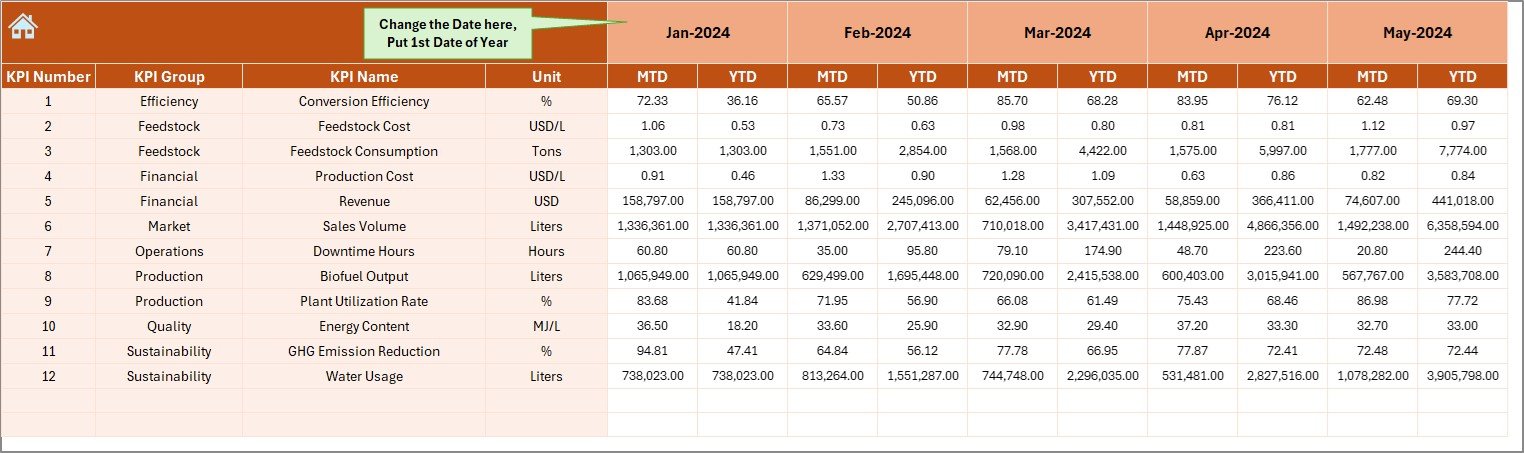
🧮 Actual Numbers Input Sheet – Enter real operational values
🎯 Target Sheet – Maintain planned performance targets
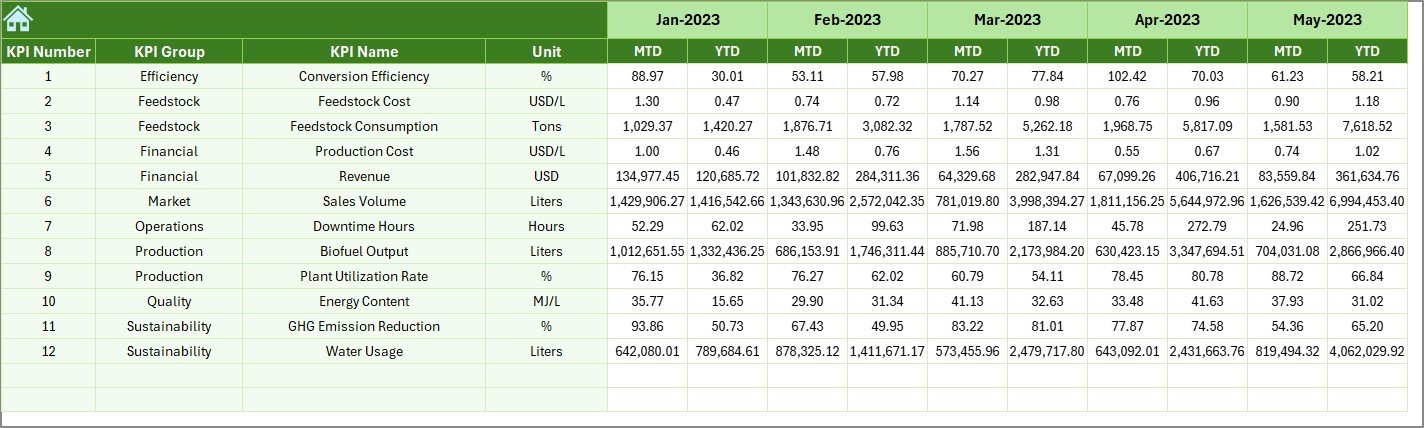
📅 Previous Year Number Sheet – Enable year-over-year comparison
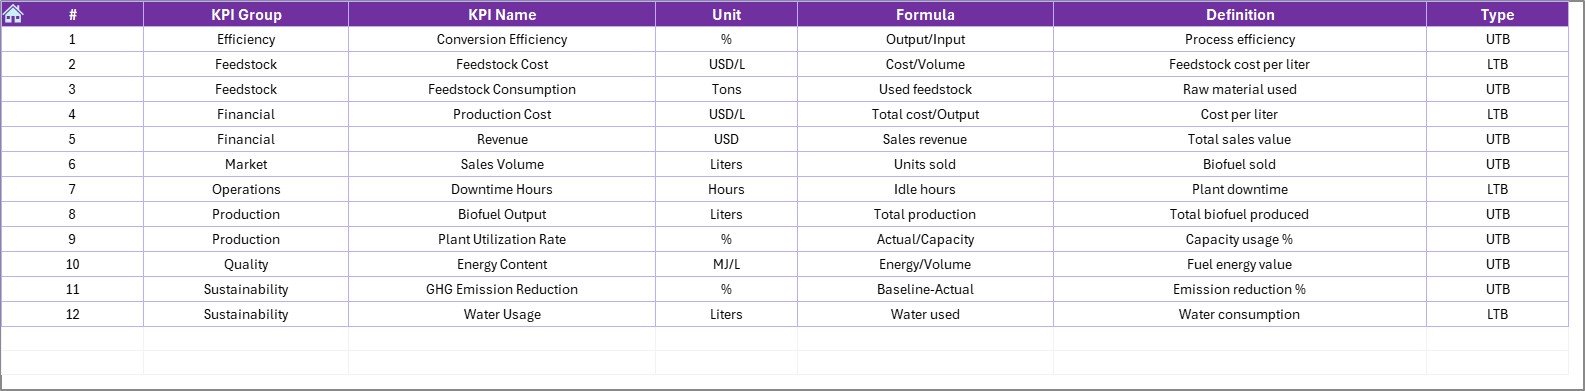
📘 KPI Definition Sheet – Document KPI logic, units, and formulas
Everything is pre-built, logically structured, and business ready.
🛠️ How to Use the Biofuels KPI Dashboard in Excel
1️⃣ Enter actual MTD and YTD values in the Actual Numbers Input Sheet
2️⃣ Update targets in the Target Sheet
3️⃣ Maintain last year’s data in the Previous Year Number Sheet
4️⃣ Define KPIs clearly in the KPI Definition Sheet
5️⃣ Select the reporting month from cell D3 on the Dashboard
6️⃣ Instantly review updated KPIs, trends, and performance indicators
No advanced Excel skills required—ideal for both technical and non-technical users.
👥 Who Can Benefit from This Biofuels KPI Dashboard in Excel
🌱 Biofuel Plant Managers
⚙️ Operations & Production Teams
♻️ Sustainability Officers
📊 Business & Data Analysts
💰 Finance Teams
🚀 Renewable Energy Startups
If your organization tracks efficiency, output, cost control, and sustainability performance, this dashboard is built for you.
🔎 Click here to read the Detailed blog post
👉 Visit our YouTube channel to learn step-by-step video tutorials and real dashboard walkthroughs.


Reviews
There are no reviews yet.