Managing procurement in a refinery involves high-value purchases, strict compliance, long-term vendor contracts, and constant cost pressure. Even a small delay or variance can lead to serious financial and operational impact. That is exactly why refinery procurement teams need a clear, structured, and visual performance monitoring solution.
The Refinery Procurement KPI Dashboard in Excel is a powerful, ready-to-use Excel-based tool designed to centralize procurement KPIs, automate calculations, and deliver instant performance insights. Instead of working with scattered spreadsheets and manual reports, this dashboard brings clarity, control, and confidence to refinery procurement decision-making.
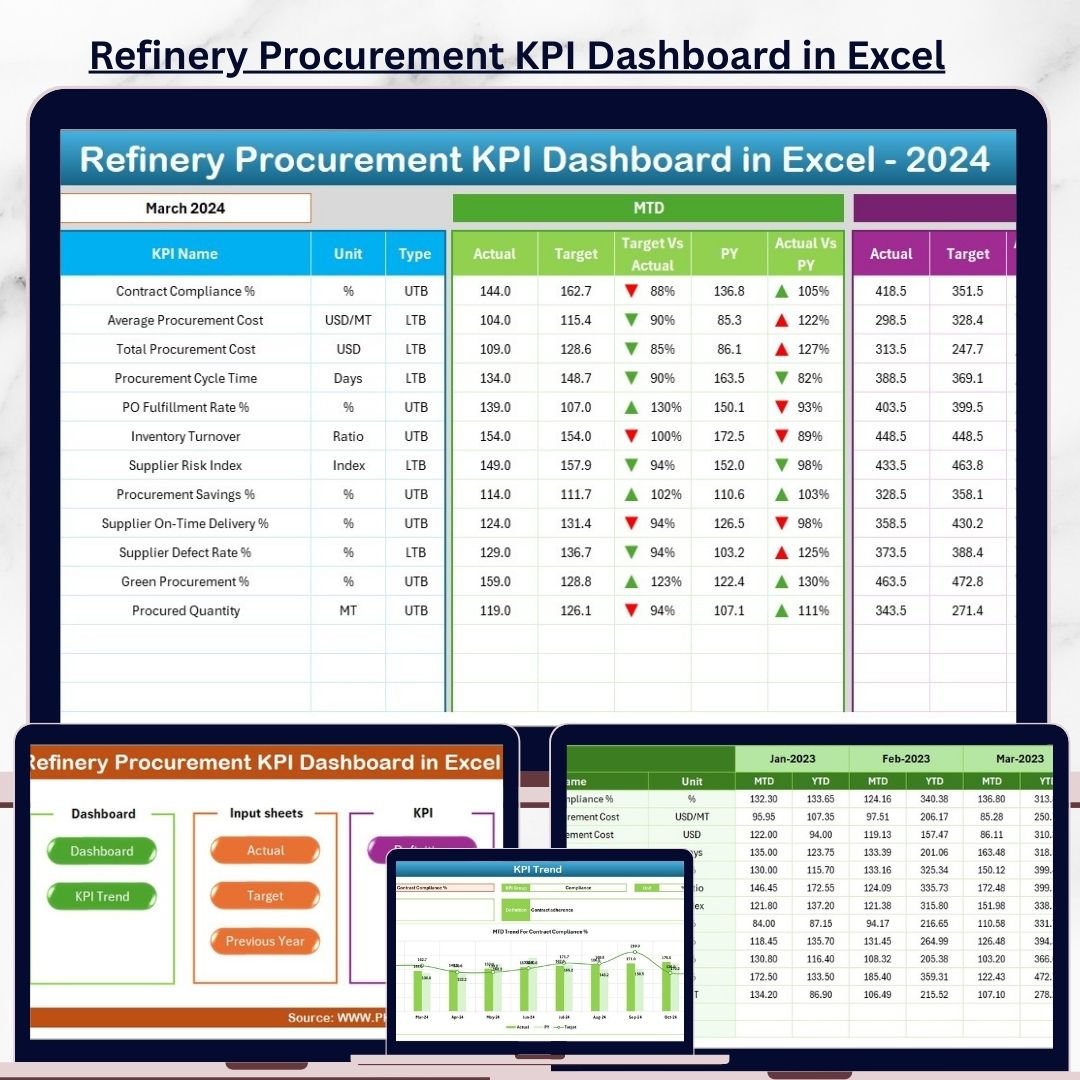
This Excel dashboard helps procurement teams track MTD and YTD performance, compare Actual vs Target vs Previous Year, analyze trends, and identify issues early—without any complex software or technical dependency.
🔑 Key Features of Refinery Procurement KPI Dashboard in Excel
📊 Centralized KPI Monitoring
Track all refinery procurement KPIs in one structured Excel dashboard instead of juggling multiple files.
📅 Dynamic Month Selection
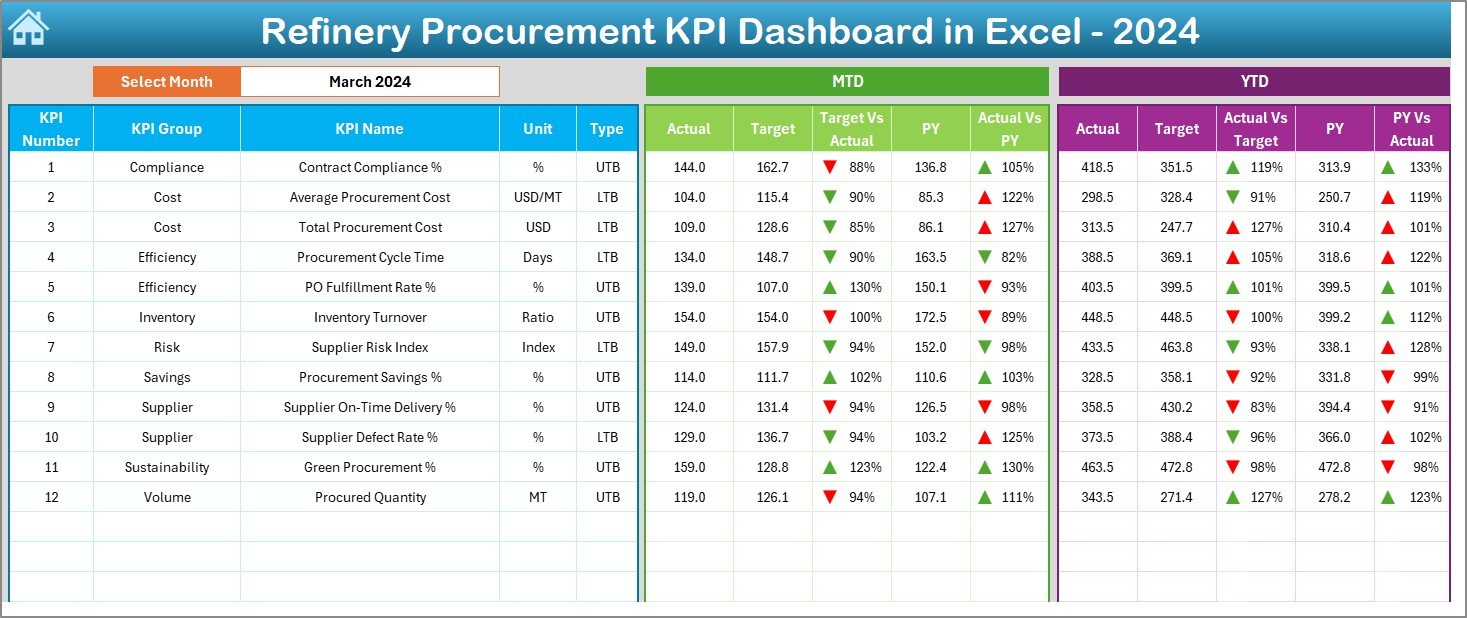
Select the reporting month from a drop-down, and the entire dashboard updates automatically.
🎯 MTD & YTD Performance Tracking
Monitor Month-to-Date and Year-to-Date Actual, Target, and Previous Year values with automated calculations.
🚦 Conditional Formatting Indicators
Instantly identify performance gaps using green and red arrows for quick action.
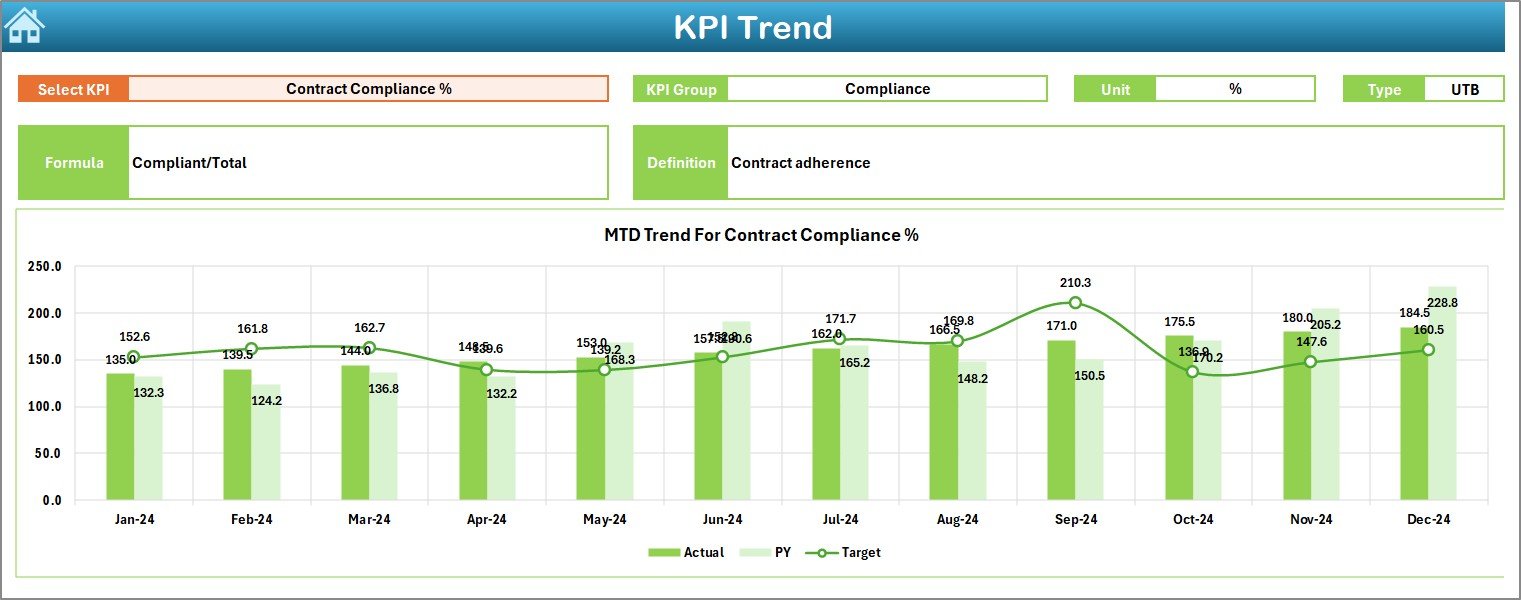
📈 Trend Analysis for Procurement KPIs
Analyze KPI trends over time to detect recurring issues, seasonality, and improvement opportunities.
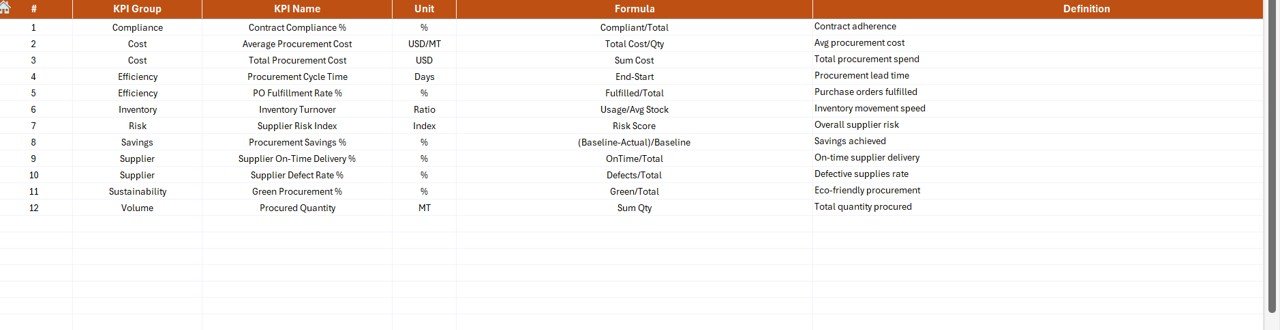
📋 Standardized KPI Definitions
Ensure consistent interpretation of KPIs with a dedicated KPI Definition sheet.
⚙️ Excel-Based & User-Friendly
No advanced Excel knowledge required—easy inputs, automated outputs, and clean visuals.
📦 What’s Inside the Refinery Procurement KPI Dashboard in Excel
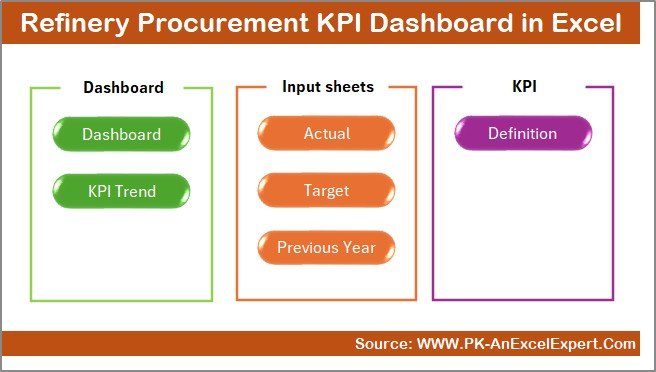
This dashboard includes 7 well-structured worksheets, each designed for a specific purpose:
📌 Summary Page – One-click navigation with buttons to access all sheets easily.
📌 Dashboard Sheet – The main visual dashboard showing MTD & YTD KPIs with comparisons and indicators.
📌 Trend Sheet – KPI-wise MTD and YTD trend charts with KPI details and formulas.
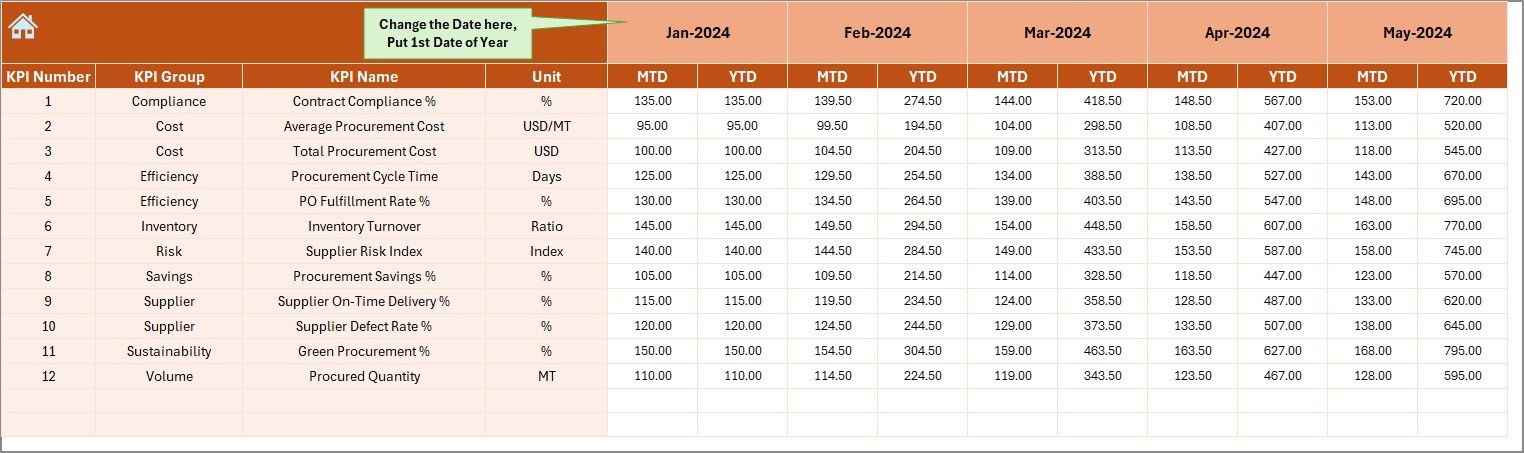
📌 Actual Numbers Input Sheet – Structured input area for monthly actual procurement data.
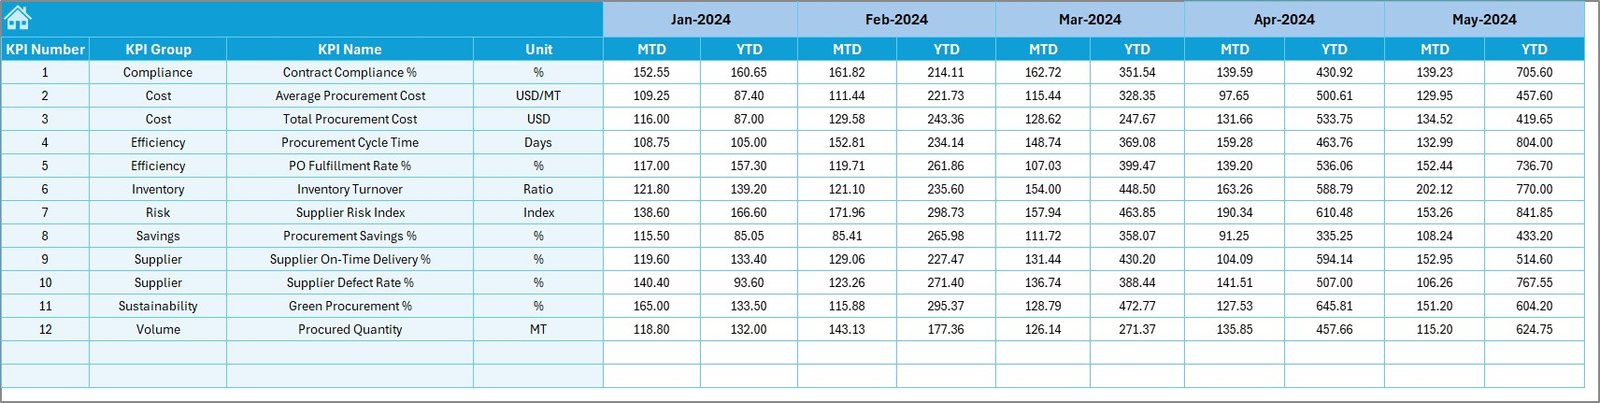
📌 Target Sheet – Define monthly and yearly procurement targets clearly.
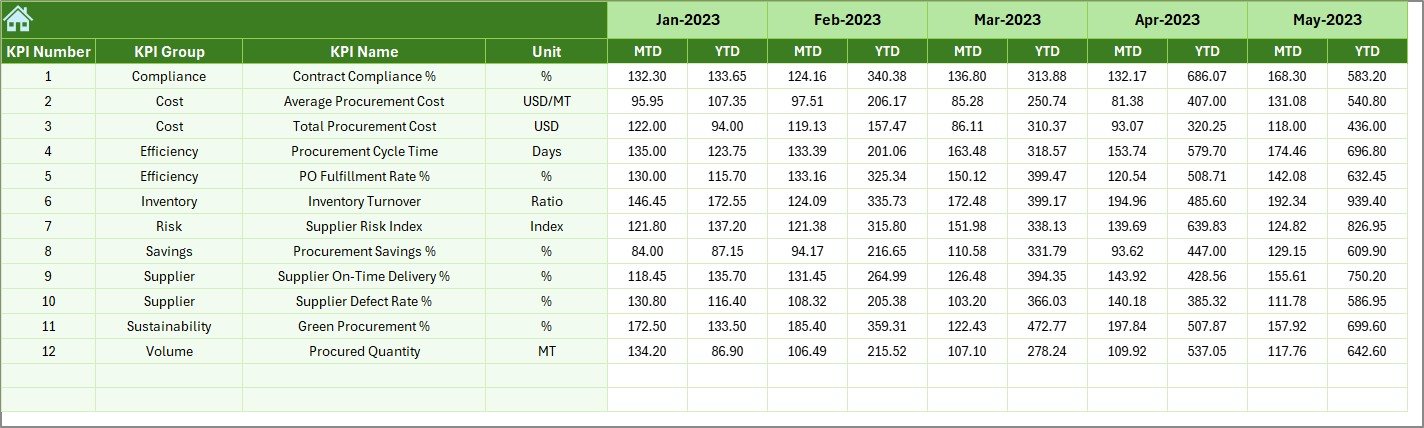
📌 Previous Year Numbers Sheet – Store historical data for year-over-year comparison.
📌 KPI Definition Sheet – Central knowledge base with KPI names, formulas, units, and definitions.
This structured design ensures accuracy, transparency, and consistency across all procurement reports.
🛠️ How to Use the Refinery Procurement KPI Dashboard in Excel
Using this dashboard is simple and efficient:
1️⃣ Enter procurement actual numbers in the Actual Numbers Input Sheet
2️⃣ Define KPI targets in the Target Sheet
3️⃣ Add previous year data for historical comparison
4️⃣ Select the reporting month from the drop-down on the Dashboard
5️⃣ Instantly review KPI performance, variances, and trends
No manual calculations. No complex setup. Just clean, actionable insights.
👥 Who Can Benefit from This Refinery Procurement KPI Dashboard in Excel
This dashboard is ideal for:
🏭 Refinery Procurement Managers – Gain full visibility and control over procurement performance
📦 Supply Chain Teams – Track vendor efficiency and delivery performance
💰 Finance Teams – Monitor cost savings, variances, and budget control
📊 Operations Managers – Ensure procurement supports plant uptime
🧾 Audit & Compliance Teams – Access structured and accurate procurement data
👔 Senior Leadership – Review performance quickly with visual clarity
Because it is built in Excel, all stakeholders can use it without additional tools.
Click here to read the detailed blog post
Watch the step-by-step video tutorial:


Reviews
There are no reviews yet.