Managing purchasing operations in smart city projects is never simple. Budgets are high, compliance is strict, and performance expectations remain under constant public scrutiny. Yet, many procurement teams still depend on scattered spreadsheets, delayed reports, and manual tracking. As a result, visibility drops and decision-making slows down.
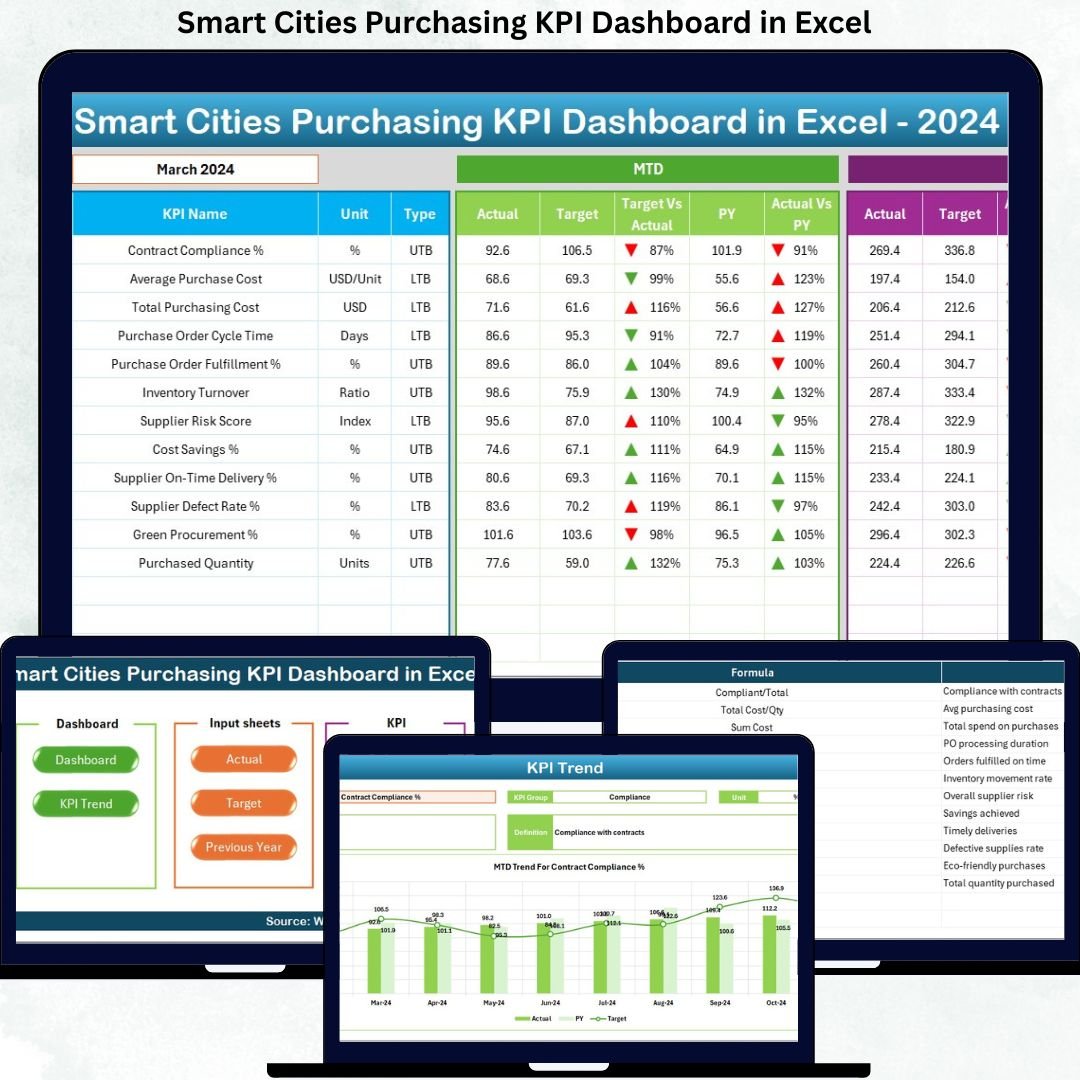
That is exactly where the Smart Cities Purchasing KPI Dashboard in Excel becomes a game-changer. This professionally designed Excel dashboard transforms complex purchasing data into clear, visual, and actionable insights—all inside a single, easy-to-use Excel file. If you want better cost control, stronger vendor performance, and faster decisions, this dashboard is built for you.
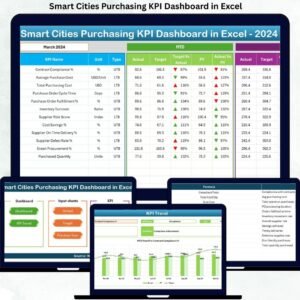
🔑 Key Features of Smart Cities Purchasing KPI Dashboard in Excel
📊 Centralized KPI Monitoring
Track all smart city purchasing KPIs in one structured Excel dashboard instead of managing multiple spreadsheets.
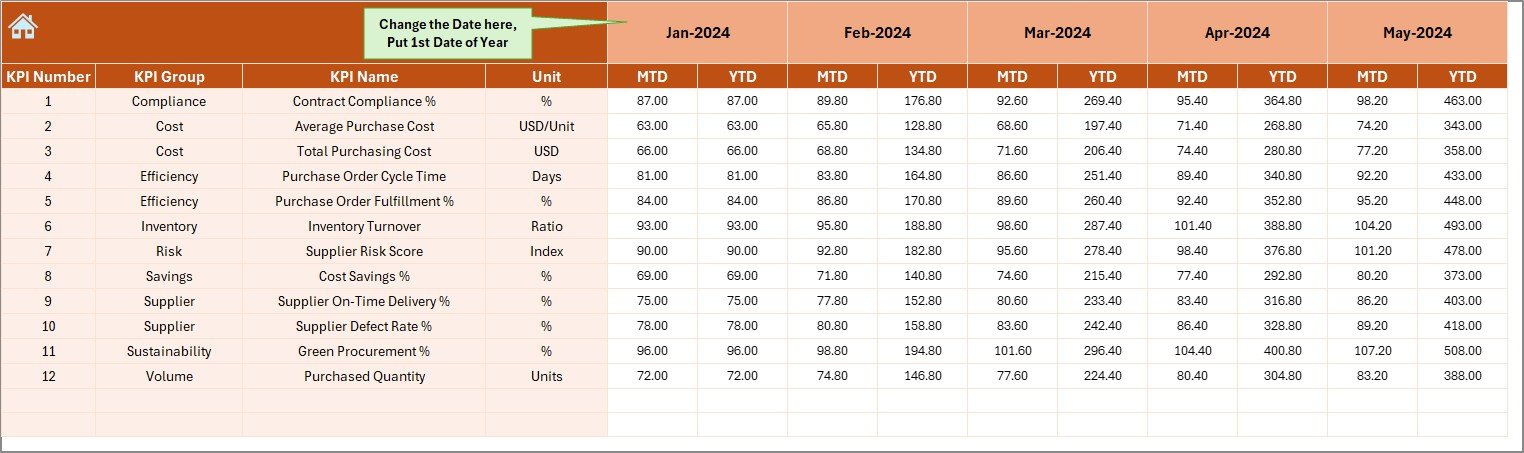
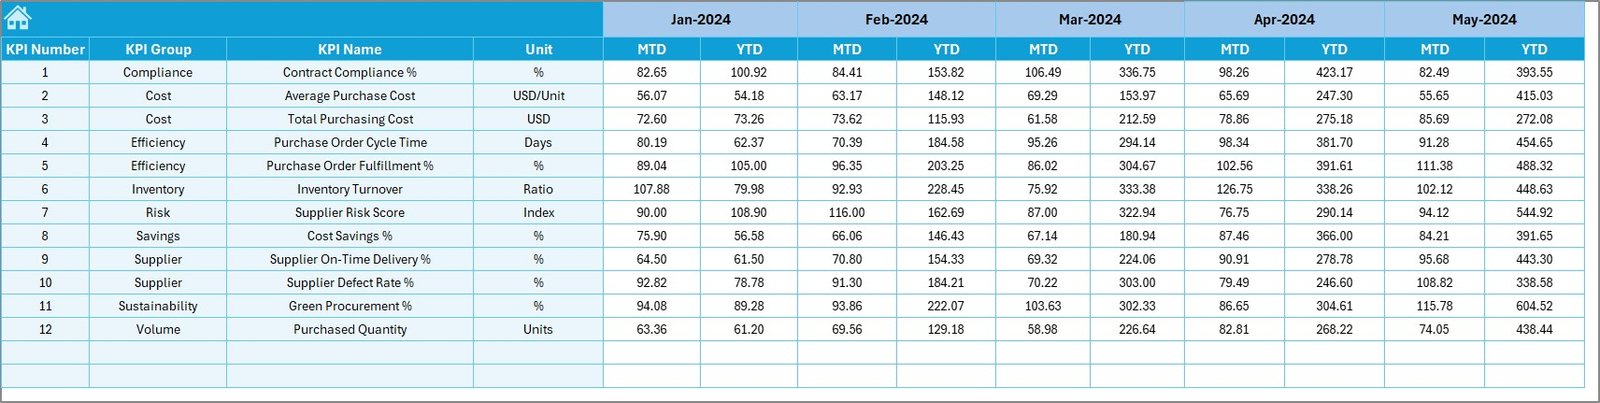
📅 MTD & YTD Performance Tracking
Monitor Month-to-Date and Year-to-Date Actuals, Targets, and Previous Year values for every purchasing KPI.
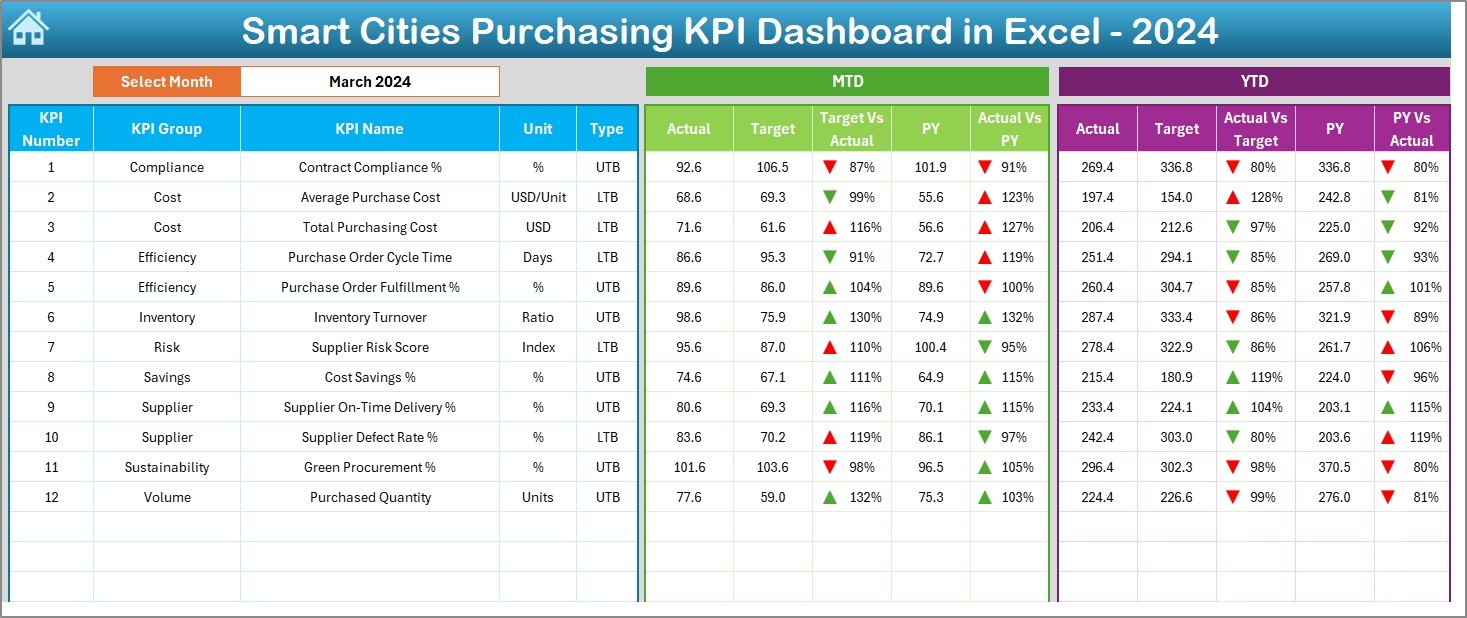
🎯 Target vs Actual Analysis
Instantly identify overspending or savings using automated variance calculations and visual indicators.
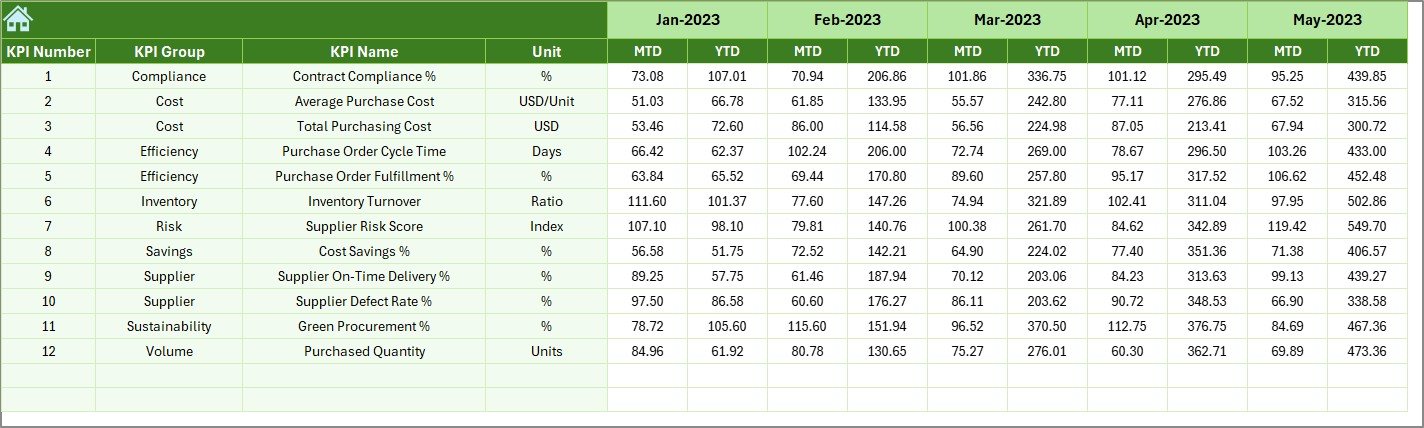
📉 Previous Year Comparison
Analyze year-over-year trends to measure improvement, decline, and long-term procurement efficiency.
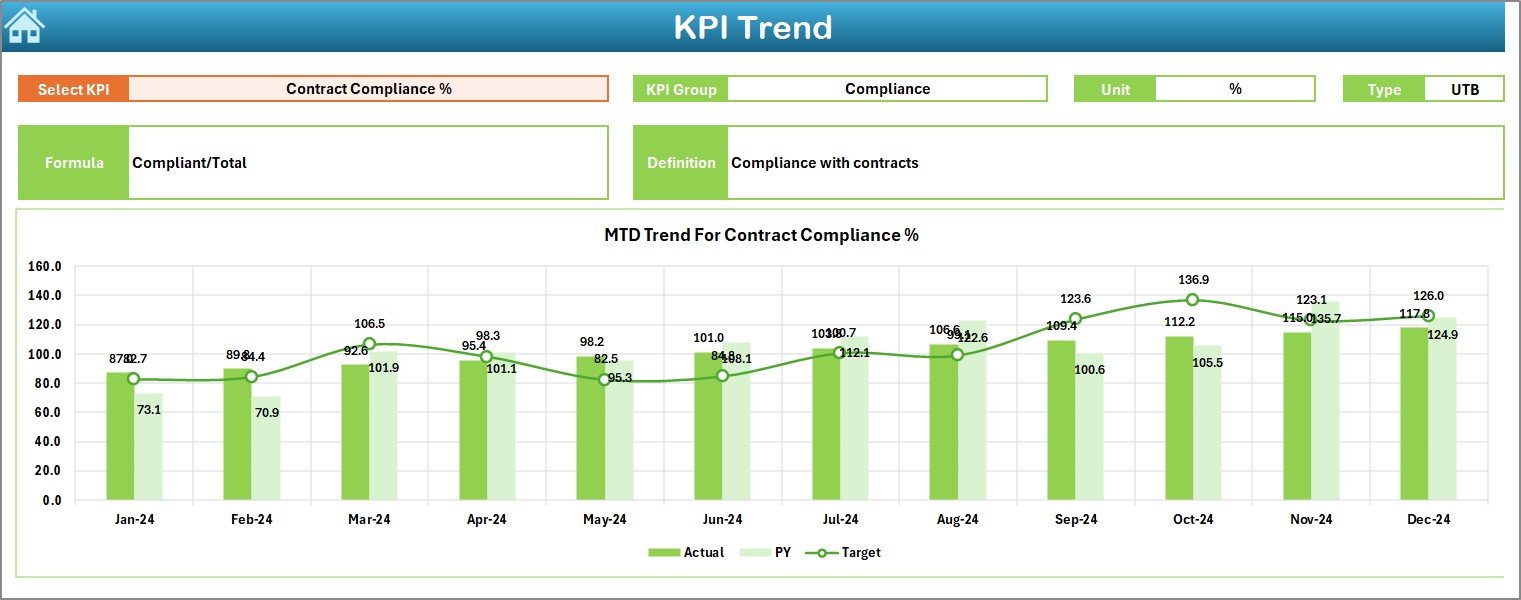
📈 Interactive Trend Analysis
Dynamic trend charts help you understand KPI behavior over time and detect risks early.
🔽 Easy Month & KPI Selection
Use dropdowns to switch months and KPIs instantly—no manual recalculations required.
📌 Professional & Audit-Ready Design
Clean layout, standardized KPIs, and structured sheets support governance and compliance needs.
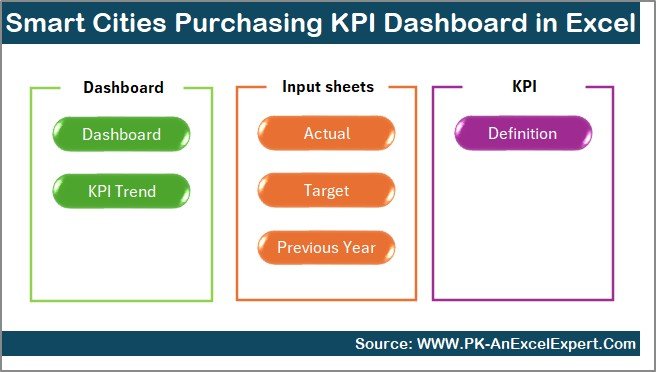
📂 What’s Inside the Smart Cities Purchasing KPI Dashboard in Excel
This dashboard includes 7 professionally structured worksheets, each designed for a specific purpose:
🧭 Summary Page – Acts as an index with navigation buttons for one-click access to all key sheets.
📊 Dashboard Sheet – Displays all KPIs with MTD, YTD, Target, and Previous Year comparisons using visual indicators.
📈 Trend Sheet – Shows KPI trends for Actual, Target, and Previous Year with clear explanations and definitions.
📝 Actual Numbers Sheet – Simple data entry area for current-year purchasing performance.
🎯 Target Sheet – Stores monthly and cumulative targets for accurate variance analysis.
📆 Previous Year Sheet – Captures historical purchasing data for year-over-year comparison.
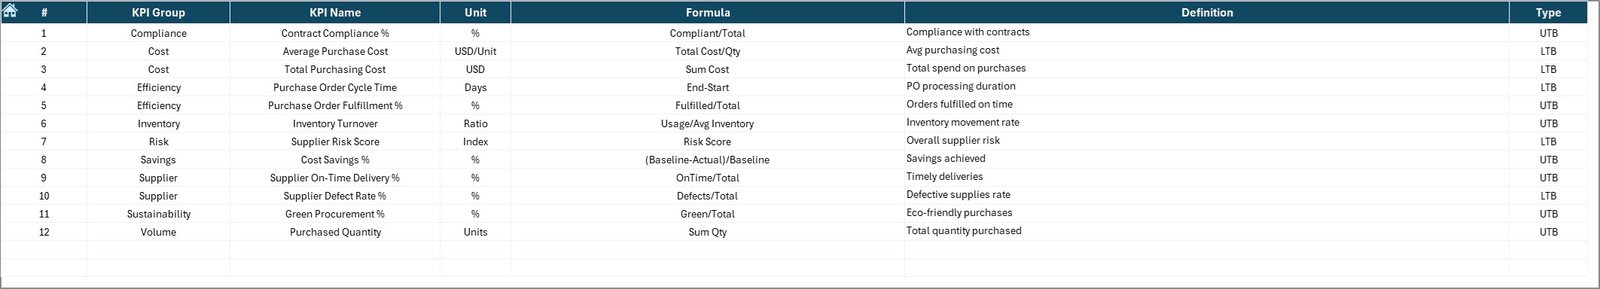
📘 KPI Definition Sheet – Documents KPI name, group, unit, formula, and definition for complete clarity.
🛠️ How to Use the Smart Cities Purchasing KPI Dashboard in Excel
Using this dashboard is simple and intuitive:
1️⃣ Enter purchasing actuals in the Actual Numbers Sheet
2️⃣ Update targets in the Target Sheet
3️⃣ Add historical data in the Previous Year Sheet
4️⃣ Select the month from the dropdown on the Dashboard
5️⃣ Instantly review MTD, YTD, variances, and trends
6️⃣ Analyze KPI behavior using the Trend Sheet
7️⃣ Use insights to improve cost control and procurement performance
No advanced Excel skills are required. Basic Excel knowledge is enough to get started.
👥 Who Can Benefit from This Smart Cities Purchasing KPI Dashboard in Excel
This dashboard is ideal for:
🏙️ Smart City Project Managers – Gain full visibility into procurement performance
💼 Procurement & Purchasing Teams – Track costs, vendors, and compliance efficiently
📑 Finance & Budgeting Teams – Monitor spending discipline and cost savings
🏛️ Government & Urban Authorities – Support transparency, audits, and governance
🤝 Public-Private Partnership Teams – Align purchasing KPIs across stakeholders
Because Excel is widely used, adoption across teams remains fast and friction-free.
Click here to read the Detailed Blog Post
Watch the step-by-step video tutorial:


Reviews
There are no reviews yet.