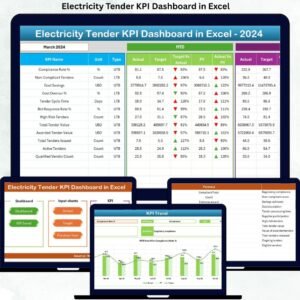
Managing electricity tenders without a structured performance system often leads to missed targets, unclear reporting, and delayed decisions. Many organizations still depend on scattered Excel sheets, emails, and manual tracking, which makes it difficult to monitor KPIs accurately and compare performance over time. That is exactly why the Electricity Tender KPI Dashboard in Excel becomes a powerful and essential solution.
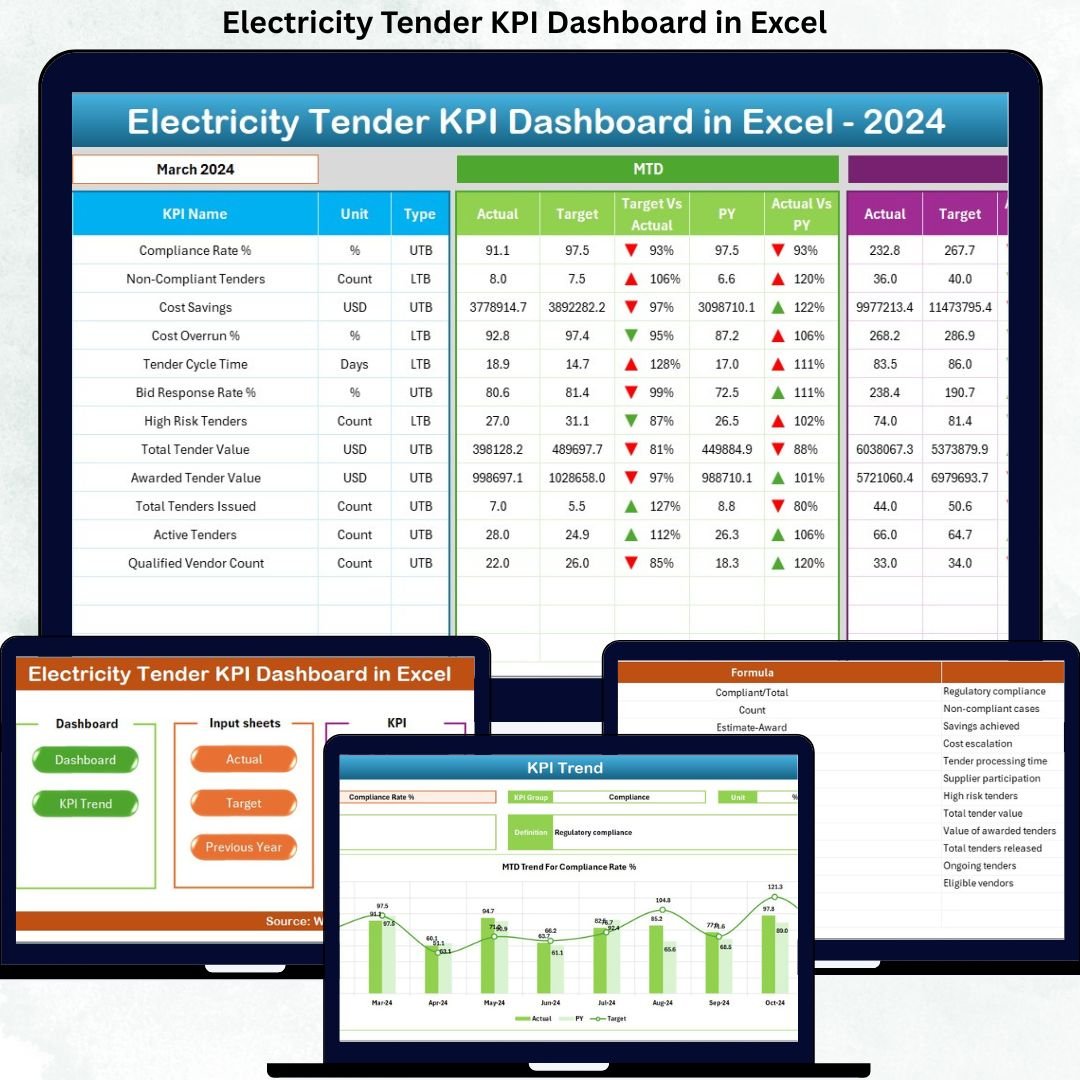
This professionally designed dashboard converts complex tender data into a single, easy-to-use Excel system. It helps organizations track Month-to-Date (MTD) and Year-to-Date (YTD) performance, compare actuals with targets, analyze trends, and identify gaps instantly. With automation, visuals, and structured worksheets, this dashboard allows tender teams to focus on decisions instead of manual reporting.
Whether you manage electricity bids, power procurement contracts, or regulatory tenders, this dashboard delivers clarity, transparency, and control — all inside Excel.
🔑 Key Features of Electricity Tender KPI Dashboard in Excel
⚡ Centralized KPI Monitoring – Track all electricity tender KPIs in one structured Excel file
📊 MTD & YTD Performance Tracking – Monitor monthly and yearly results side by side
🎯 Target vs Actual Analysis – Instantly identify underperformance and achievement gaps
📉 Previous Year Comparison – Measure growth, decline, and long-term efficiency
🔼 Automated Performance Indicators – Conditional formatting arrows highlight trends clearly
📅 Dynamic Month Selection – Change months using dropdowns and update the entire dashboard instantly
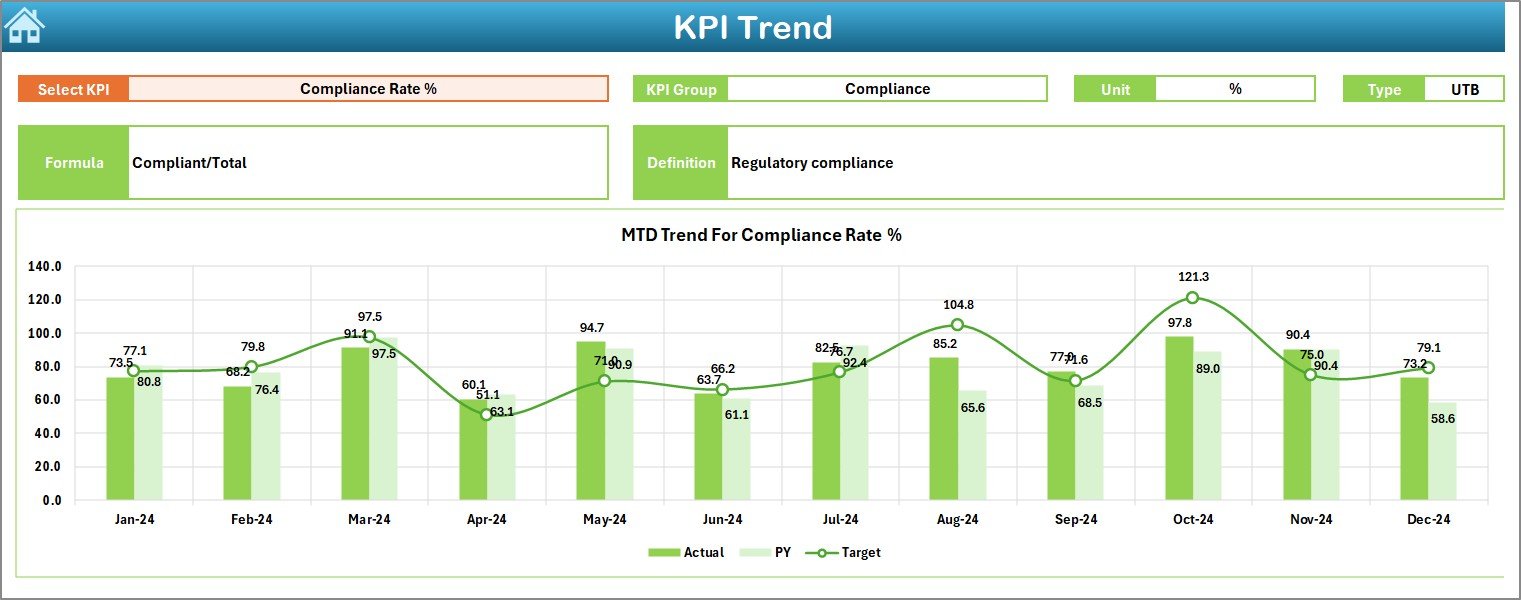
📈 Trend Analysis Charts – Visualize KPI movements over time for better forecasting
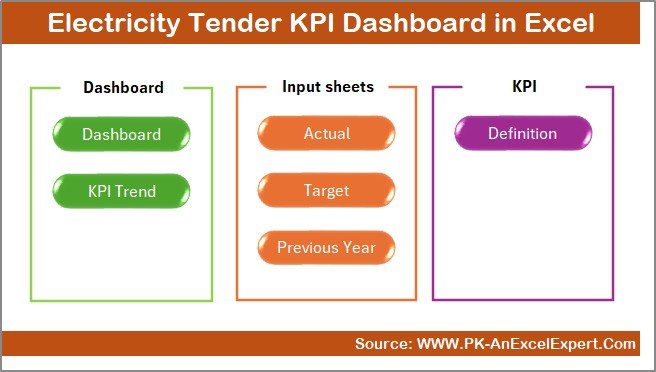
📦 What’s Inside the Electricity Tender KPI Dashboard
This dashboard includes 7 professionally structured worksheets, each designed for a specific role:
🧭 Summary Page
Acts as a navigation hub with interactive buttons, allowing users to jump to any sheet instantly.
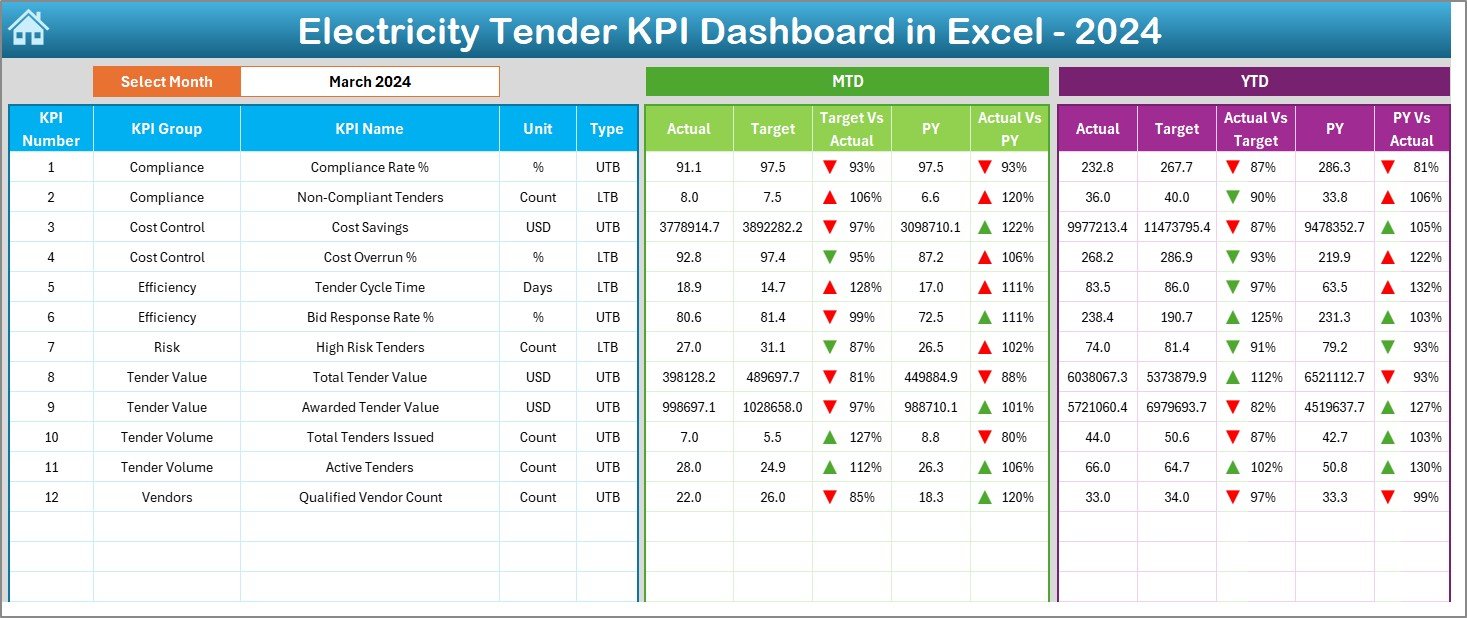
📊 Dashboard Sheet
The core performance page where users select the month and view MTD & YTD Actual, Target, and Previous Year values with visual indicators.
📈 Trend Sheet
Allows deep KPI analysis with trend charts, KPI group details, unit of measurement, KPI type, formula, and definition.
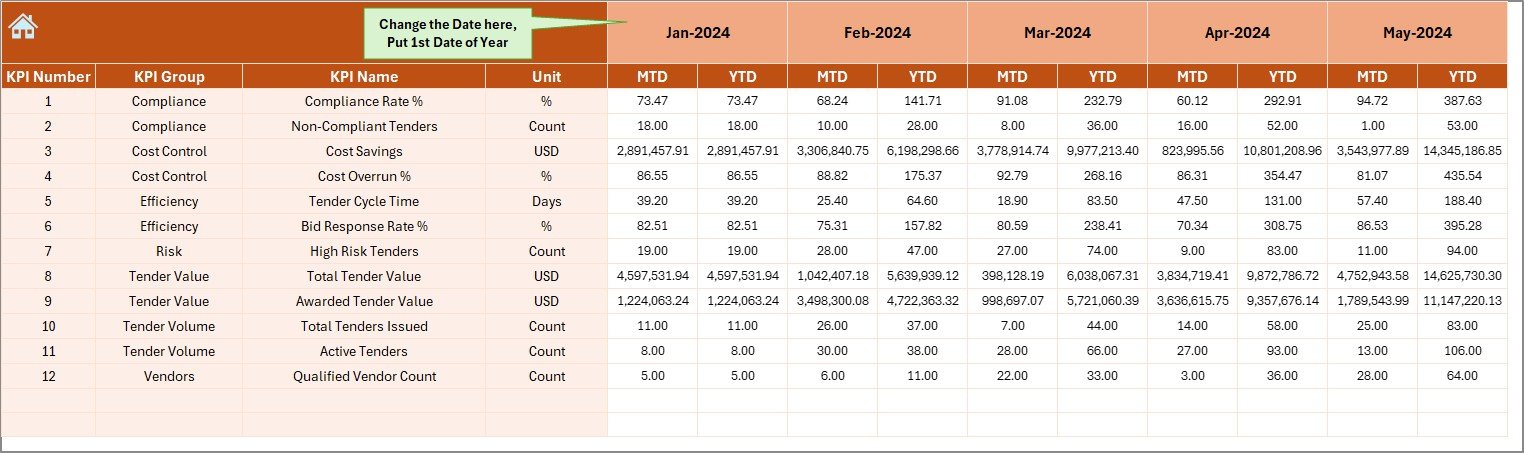
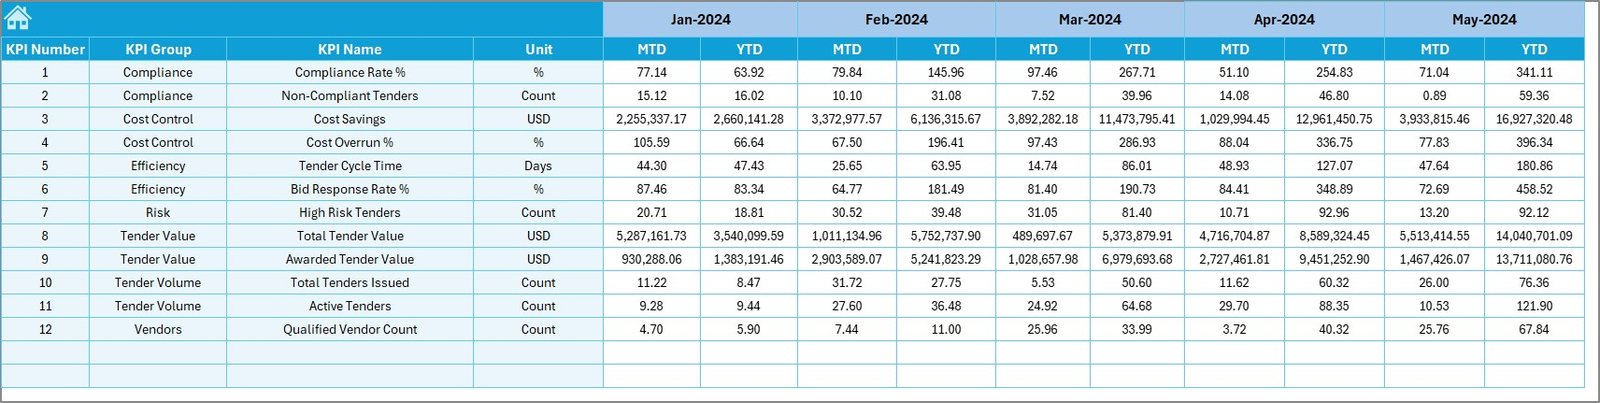
✍ Actual Numbers Input Sheet
Enter real performance values dynamically by month for both MTD and YTD tracking.
🎯 Target Sheet
Define monthly and cumulative targets for each KPI to ensure accurate performance evaluation.
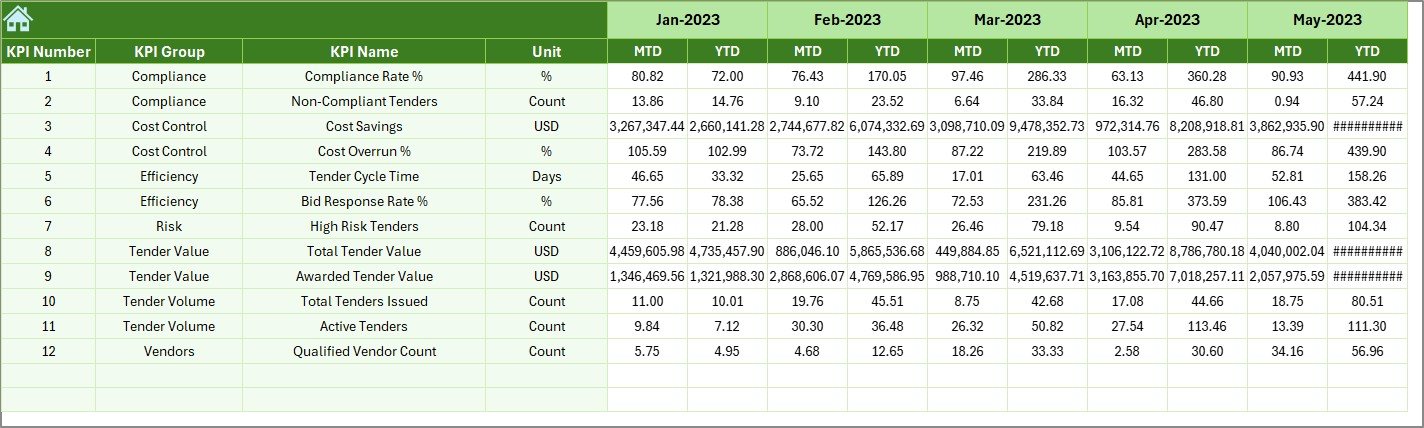
📜 Previous Year Number Sheet
Store last year’s data to enable meaningful historical comparisons.
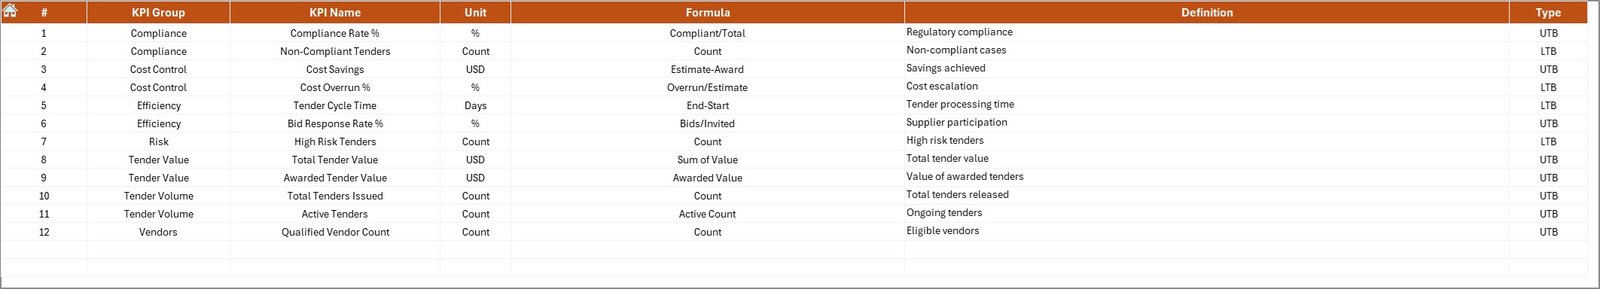
📘 KPI Definition Sheet
Maintain clarity with KPI names, formulas, units, groups, and definitions for consistent reporting.
▶️ How to Use the Electricity Tender KPI Dashboard
Using the dashboard is simple and user-friendly:
1️⃣ Enter KPI definitions and structure
2️⃣ Add target values in the Target Sheet
3️⃣ Input previous year data once
4️⃣ Update actual values monthly
5️⃣ Select the month from the dropdown
6️⃣ Review MTD, YTD, trends, and performance indicators
With minimal effort, you get instant insights without complex formulas or advanced Excel skills.
👥 Who Can Benefit from This Electricity Tender KPI Dashboard
This dashboard is ideal for:
⚡ Electricity boards and utilities
🏭 Power generation and distribution companies
📑 Tender and contract management teams
🏛 Government electricity departments
🔍 Auditors and consultants
📊 Energy procurement professionals
Anyone responsible for tracking, reporting, or reviewing electricity tender performance will find this dashboard extremely valuable.
Click here to read the Detailed blog post
Watch the step-by-step video tutorial:


Reviews
There are no reviews yet.