
Managing port tenders requires accuracy, transparency, and continuous performance tracking. However, relying on manual spreadsheets or scattered reports often leads to delays, errors, and poor visibility. That’s where the Port Tender KPI Dashboard in Power BI becomes a powerful solution.
This professionally designed dashboard helps port authorities, logistics teams, and tender management professionals monitor tender performance, track KPIs, analyze trends, and make data-driven decisions — all from one interactive Power BI dashboard.
Built using Power BI + Excel, this ready-to-use dashboard converts complex tender data into meaningful insights with zero technical complexity. Whether you manage infrastructure tenders, logistics contracts, or procurement performance, this dashboard gives you complete control and clarity.
🚀 Key Features of Port Tender KPI Dashboard
✅ Interactive Power BI Dashboard – Clean and professional interface for quick insights
✅ Excel-Based Data Source – Easy data updates without technical knowledge
✅ MTD & YTD Performance Tracking – Monitor monthly and yearly progress
✅ Target vs Actual Analysis – Instantly identify gaps and underperformance
✅ Automated KPI Status Indicators – Green & red arrows for quick evaluation
✅ Dynamic Slicers – Filter data by month and KPI group
✅ Trend Analysis Charts – Compare current year vs previous year performance
✅ Management-Ready Design – Perfect for reviews, audits, and reporting
📊 What’s Inside the Port Tender KPI Dashboard
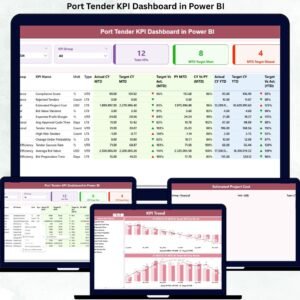
This dashboard consists of three powerful analytical pages, designed to give complete visibility into tender performance:
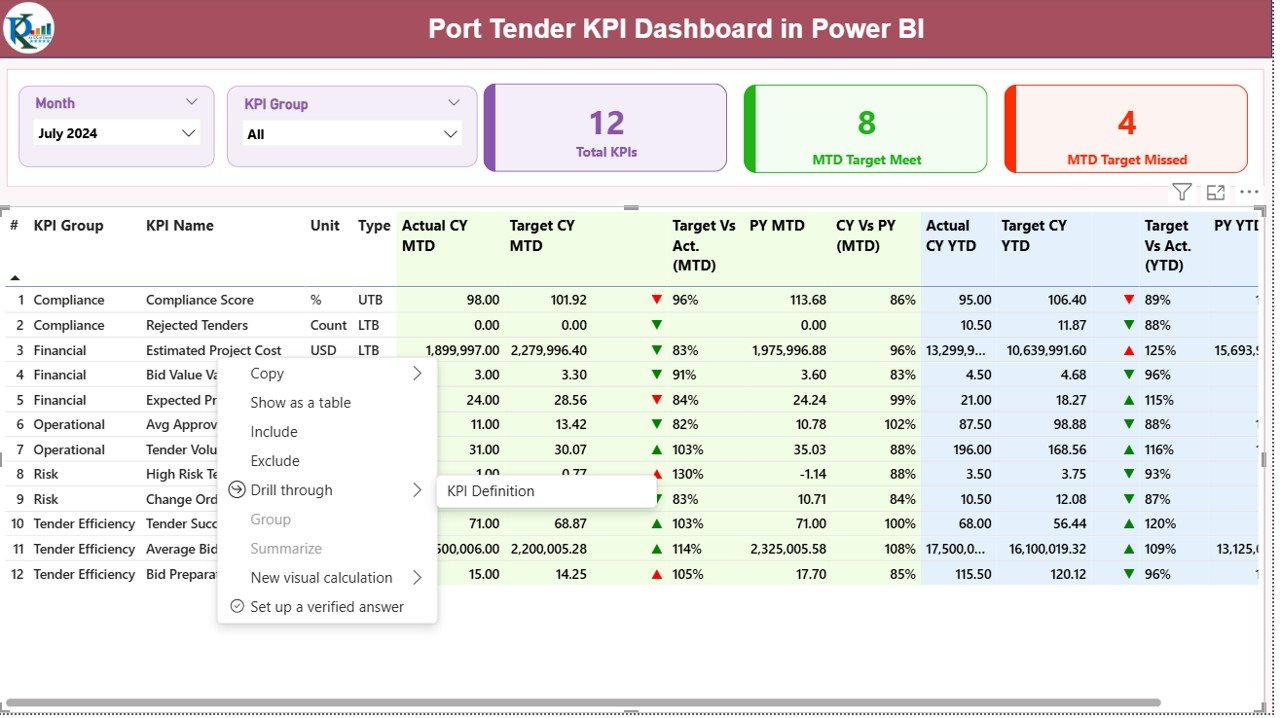
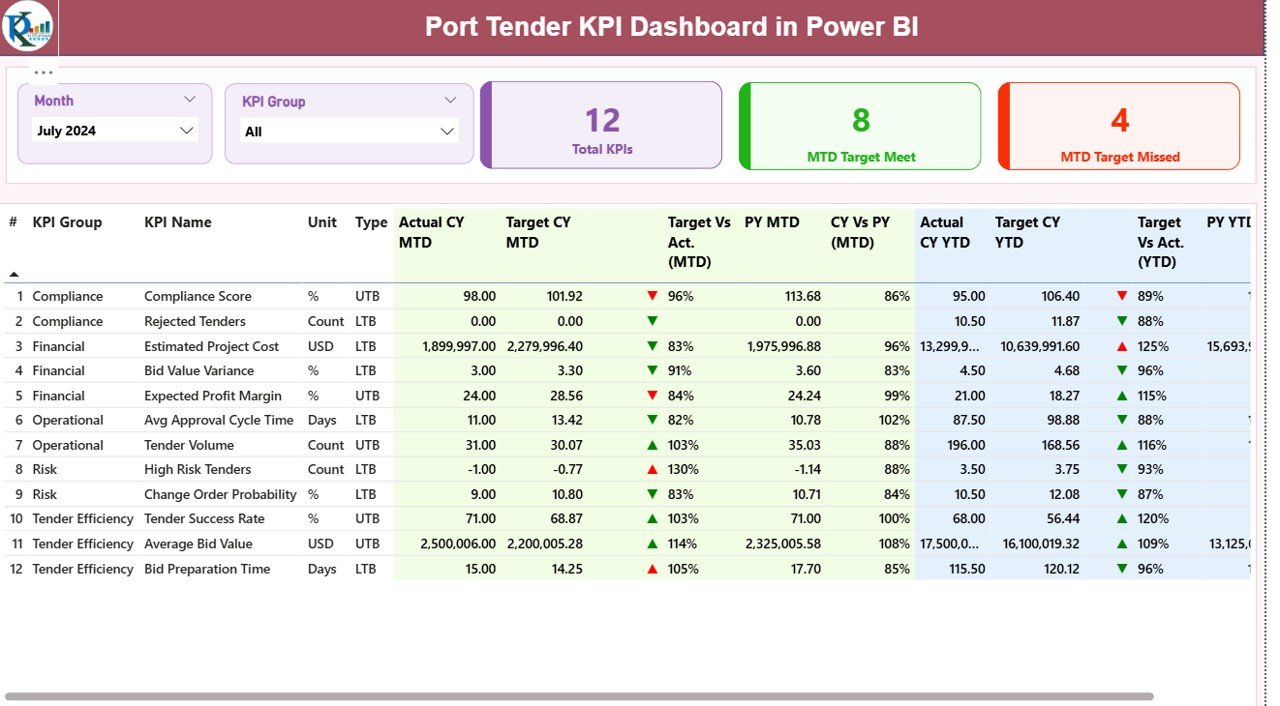
🔹 1. Summary Page – Performance Overview
The Summary Page provides a snapshot of overall performance with:
-
Month and KPI Group slicers
-
Total KPI Count
-
MTD Target Met & Missed KPIs
-
Detailed KPI table including:
-
KPI Number
-
KPI Group
-
KPI Name
-
Unit of Measurement
-
KPI Type (LTB / UTB)
-
Actual vs Target (MTD & YTD)
-
Previous Year Comparison
-
Performance indicators
-
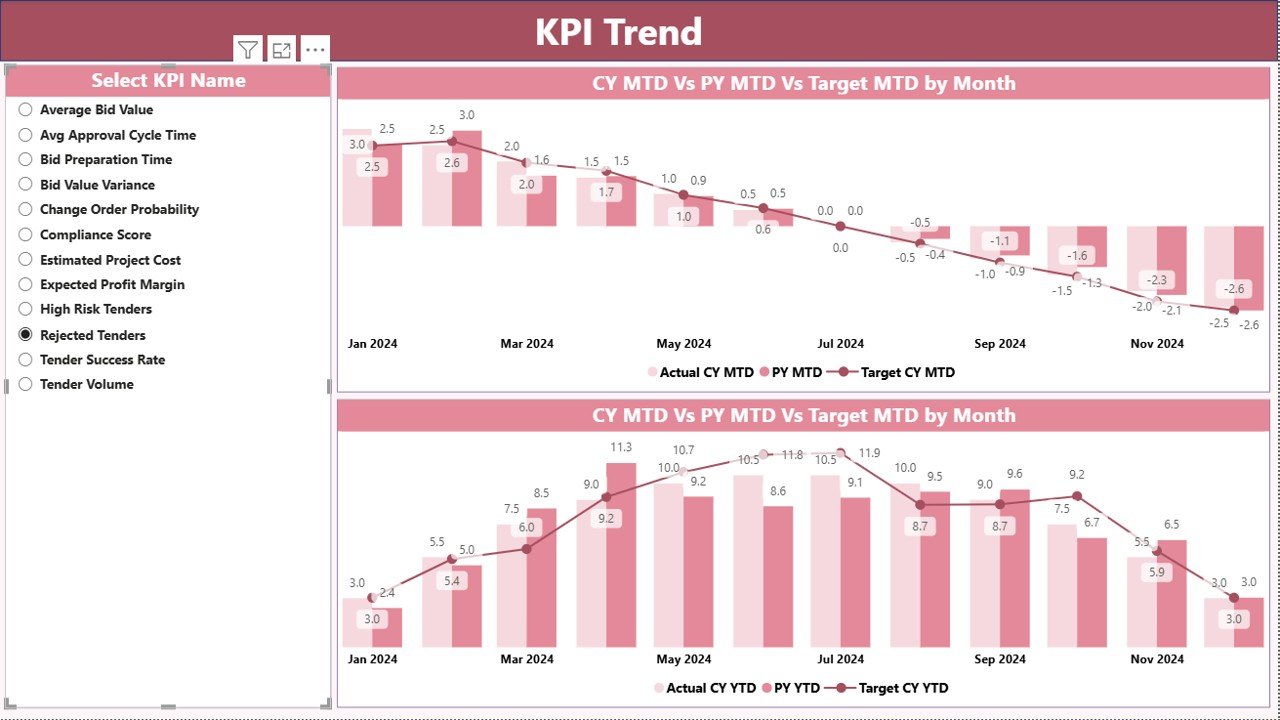
🔹 2. KPI Trend Page
This page helps visualize performance trends using:
-
MTD and YTD trend charts
-
Current Year vs Previous Year comparison
-
Target vs Actual visuals
-
KPI-wise slicer for focused analysis
It helps identify:
-
Performance improvement areas
-
Seasonal trends
-
Consistent underperforming KPIs
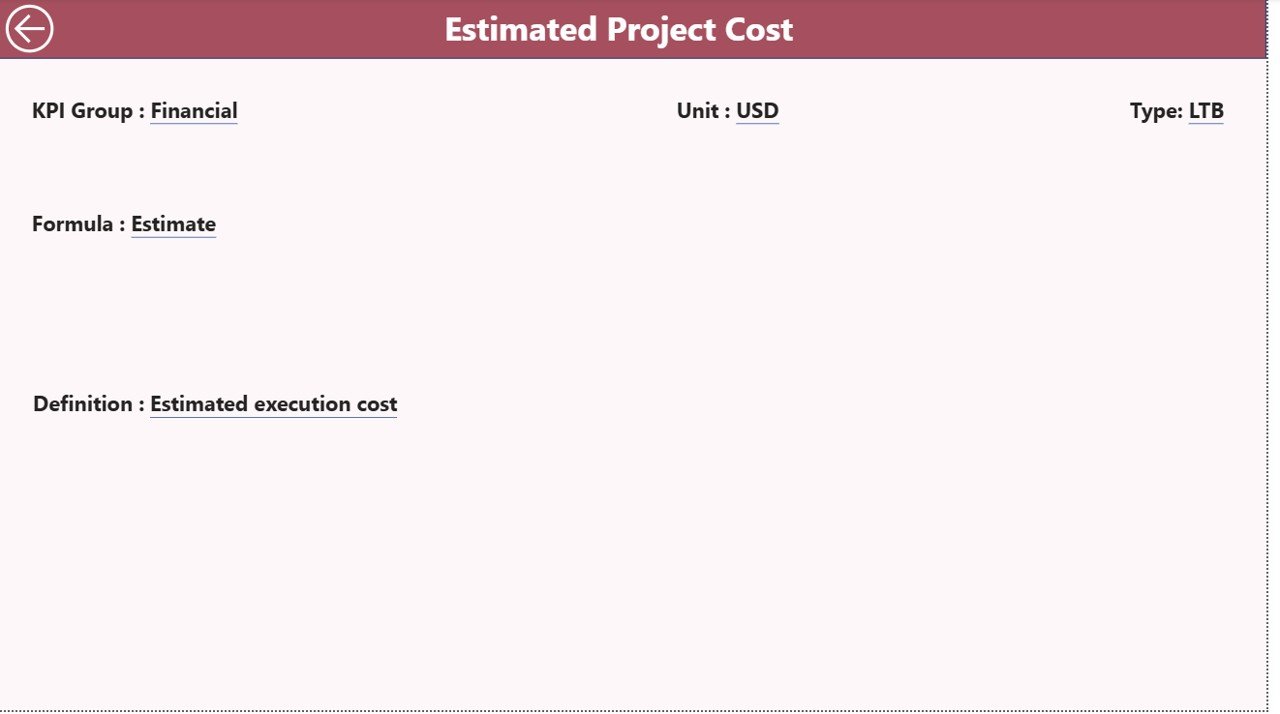
🔹 3. KPI Definition Page
A dedicated reference section that displays:
-
KPI formula
-
KPI definition
-
KPI type (LTB / UTB)
-
Drill-through navigation from summary page
This ensures clarity and consistency across all KPIs.
🛠️ How to Use the Port Tender KPI Dashboard
1️⃣ Enter actual data in the Input_Actual Excel sheet
2️⃣ Update targets in the Input_Target sheet
3️⃣ Maintain KPI definitions in the KPI Definition sheet
4️⃣ Refresh the Power BI file
5️⃣ Instantly view updated KPIs, trends, and insights
No complex setup. No coding. Just update Excel and refresh.
🎯 Who Can Benefit from This Dashboard?
This dashboard is ideal for:
✔ Port Authorities
✔ Tender Management Teams
✔ Logistics & Operations Managers
✔ Procurement Departments
✔ Infrastructure Companies
✔ Government Agencies
✔ Performance & Compliance Teams
If you handle tenders, contracts, or operational KPIs — this dashboard is built for you.
Click here to read the Detailed blog post
Watch the step-by-step video tutorial:


Reviews
There are no reviews yet.