Managing purchasing operations in a port environment requires accuracy, speed, and complete visibility. With multiple vendors, high-volume procurement, and strict compliance requirements, manual tracking often leads to delays, cost overruns, and poor decision-making.
That’s where the Port Purchasing KPI Dashboard in Power BI becomes a game-changer.
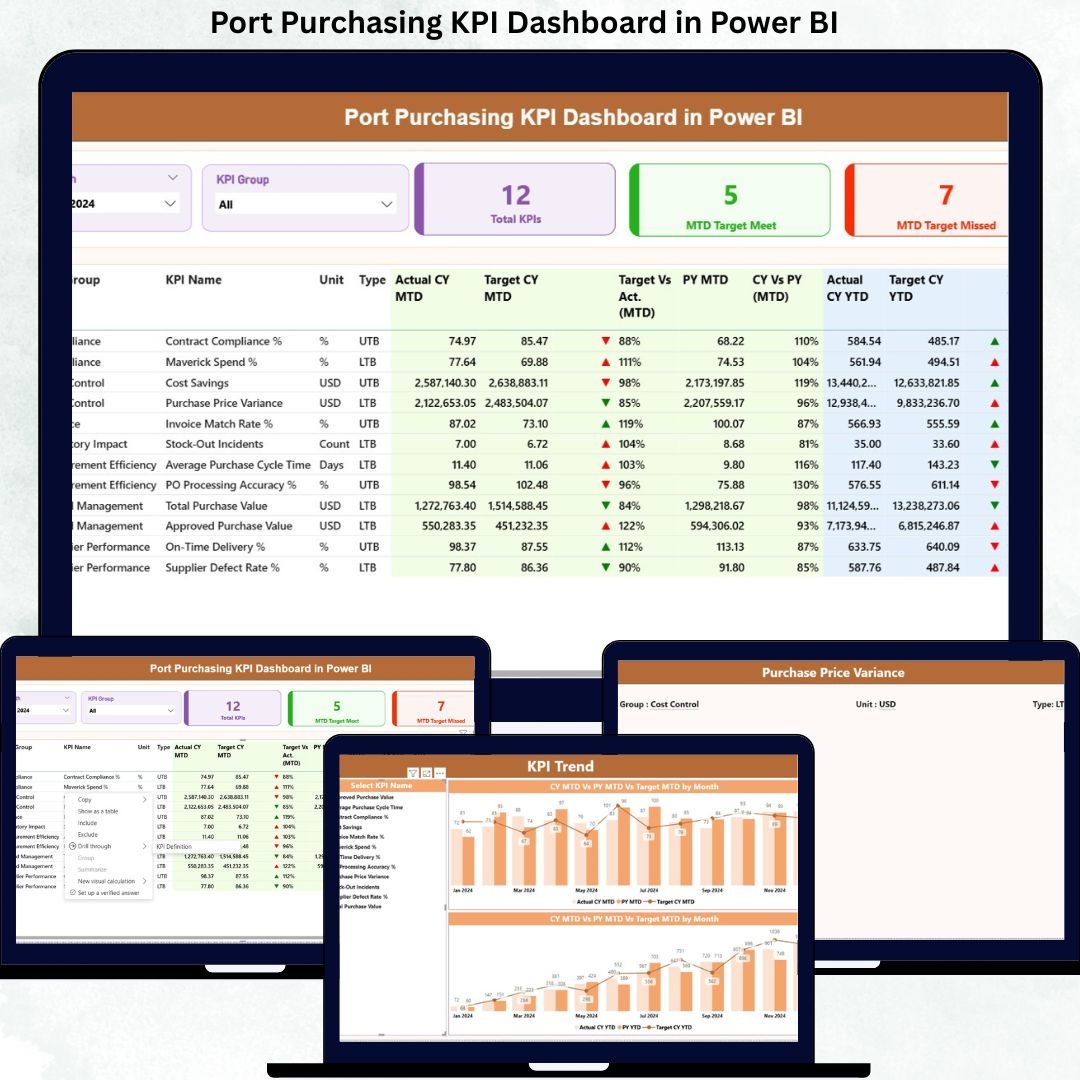
This powerful, ready-to-use dashboard helps port authorities and procurement teams track purchasing performance, monitor KPIs, and analyze trends — all in one interactive Power BI report. Built using Excel as a data source, it delivers clarity, control, and confidence in procurement decision-making.
🔹 Key Features of Port Purchasing KPI Dashboard
🚀 Interactive Power BI Dashboard – Visual and easy-to-understand layout
📊 MTD & YTD Performance Tracking – Monitor current and yearly progress
🎯 Target vs Actual Analysis – Identify gaps instantly
📅 Month & KPI Group Filters – Dynamic data slicing
📈 Trend Analysis Charts – Track performance movement visually
📄 Detailed KPI Tables – Complete KPI breakdown with metrics
🔁 Excel-Based Data Input – Easy to update, no technical skills needed
⚡ Auto Calculations – No manual formula work required
This dashboard is designed to simplify complex procurement data and convert it into actionable insights.
🔹 What’s Inside the Port Purchasing KPI Dashboard
The dashboard consists of three professionally designed pages, each serving a specific purpose.
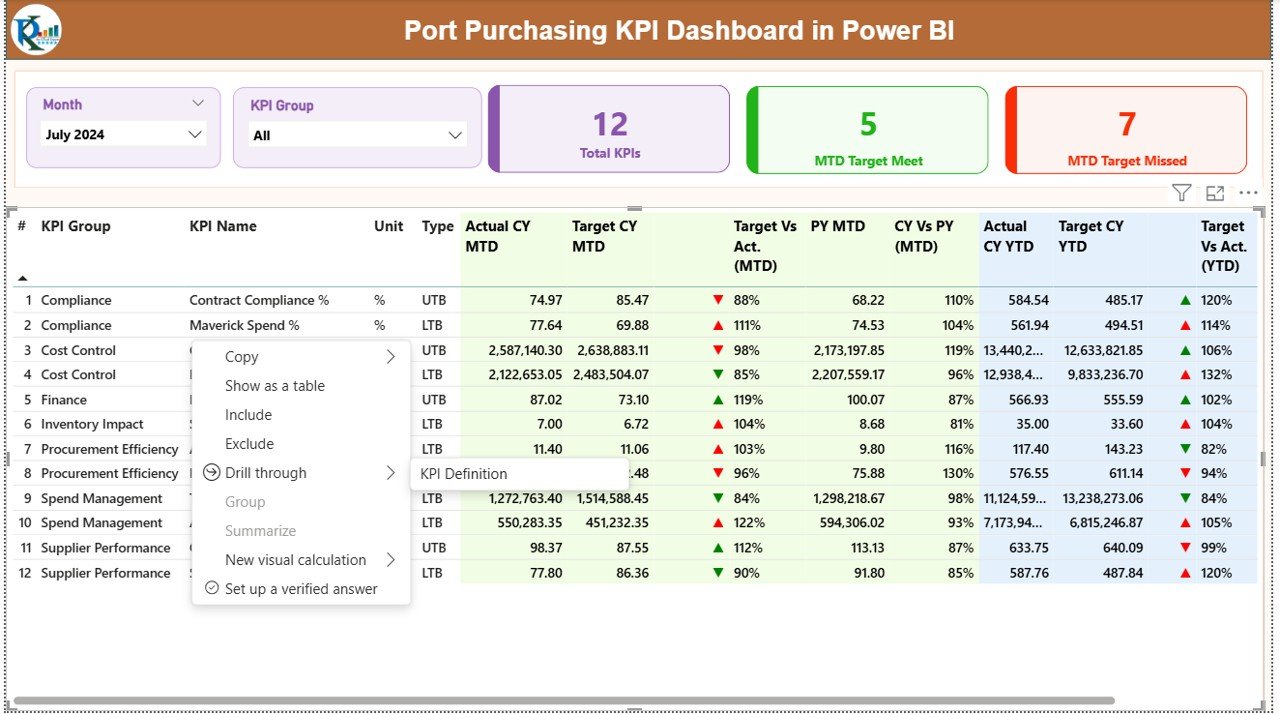
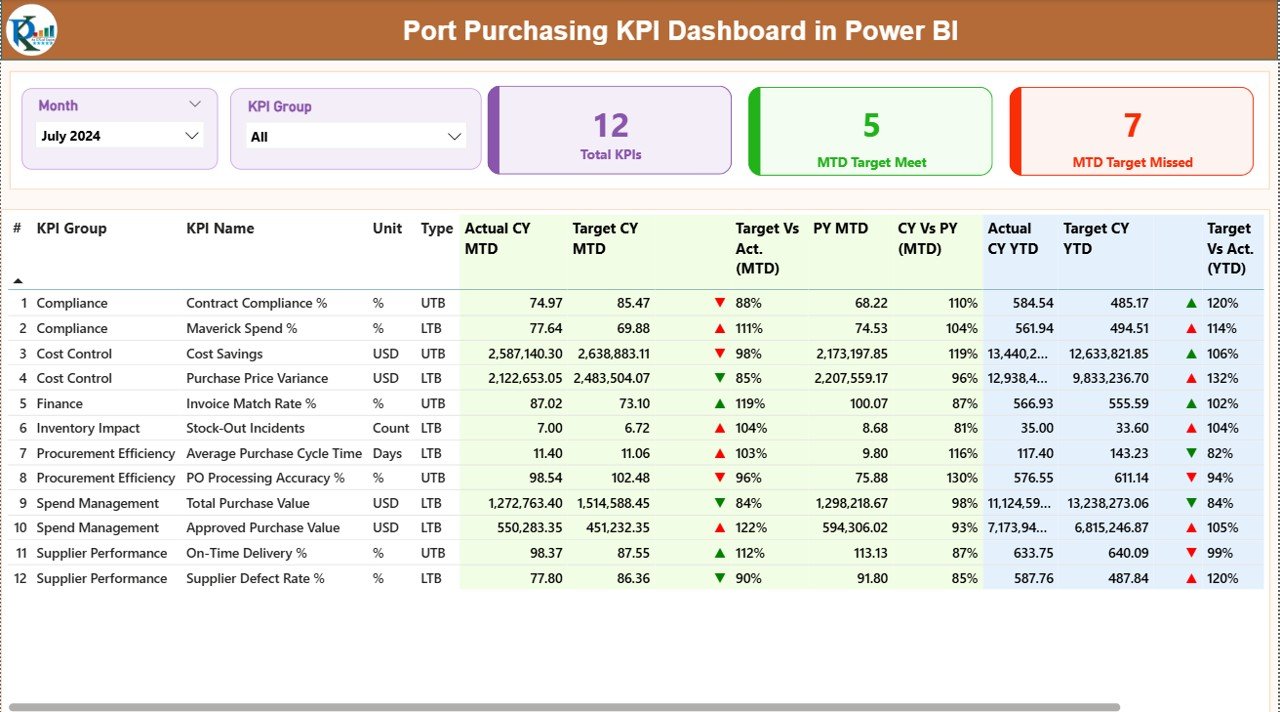
📌 1. Summary Page – Performance at a Glance
This is the main dashboard view where users get a complete overview of purchasing performance.
✔ Month & KPI Group slicers
✔ KPI Cards showing:
-
Total KPI Count
-
MTD Target Met
-
MTD Target Missed
✔ Detailed KPI Table with:
-
KPI Number
-
KPI Group
-
KPI Name
-
Unit of Measurement
-
KPI Type (LTB / UTB)
✔ Performance Metrics:
-
Actual CY MTD
-
Target CY MTD
-
MTD Status Indicator
-
Previous Year Comparison
-
Actual vs Target (MTD & YTD)
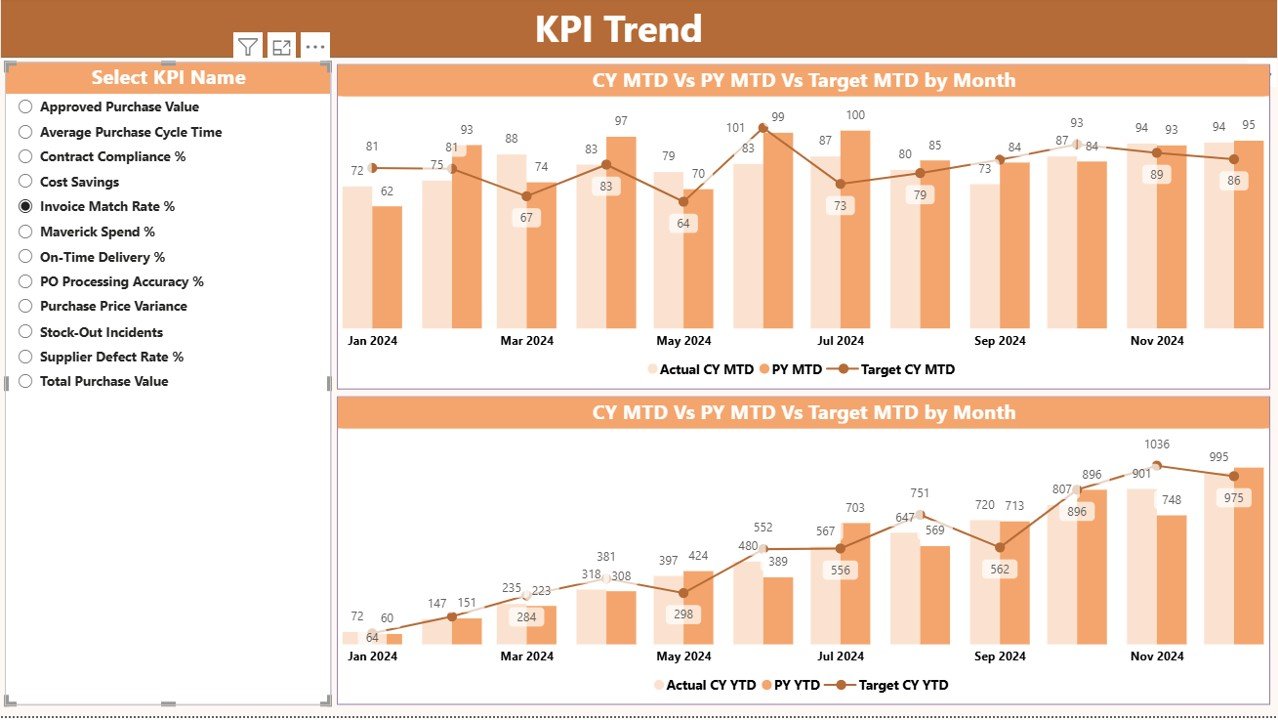
📌 2. KPI Trend Page – Visual Performance Analysis
This page helps users identify trends and performance behavior.
📊 Includes:
-
Combo charts for MTD & YTD
-
Actual vs Target vs Previous Year comparison
-
KPI slicer for focused analysis
This makes it easy to spot performance gaps and improvement areas.
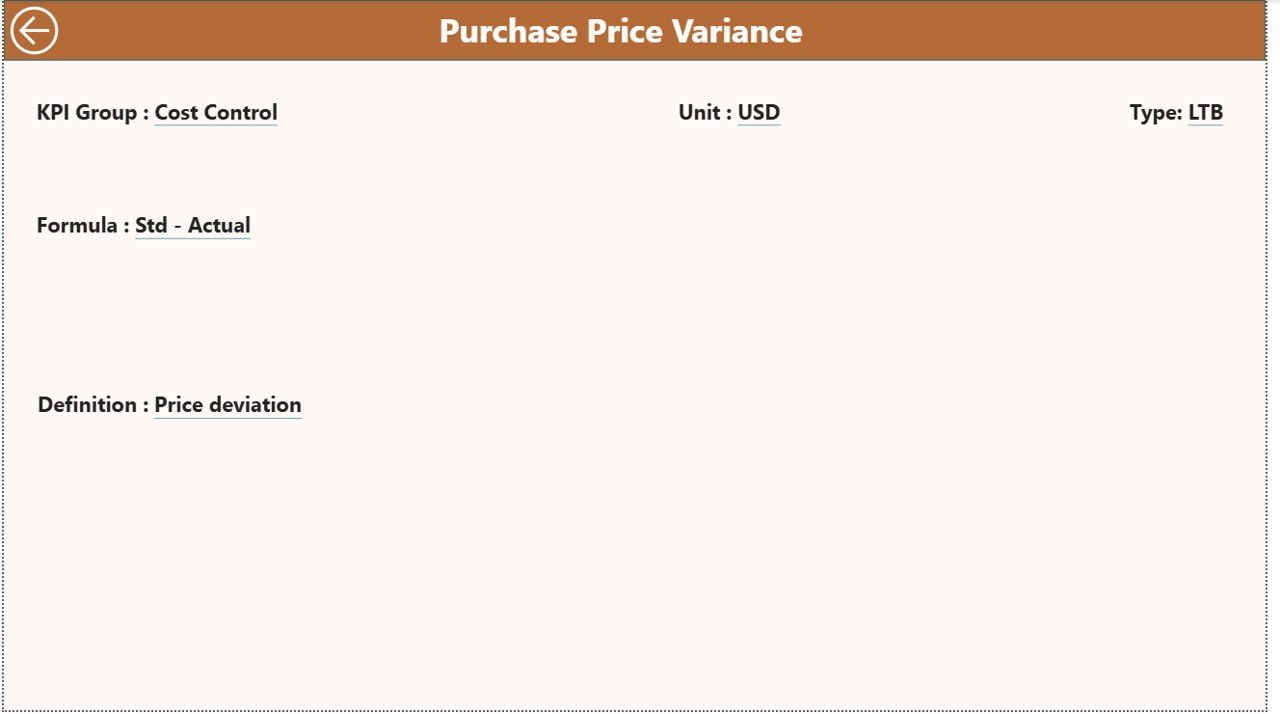
📌 3. KPI Definition Page – KPI Clarity
This page explains every KPI clearly.
✔ KPI Name
✔ Formula
✔ Definition
✔ KPI Type (LTB / UTB)
✔ Unit of Measurement
💡 A back button is provided for smooth navigation.
🔹 How to Use the Port Purchasing KPI Dashboard
1️⃣ Enter actual values in the Input_Actual Excel sheet
2️⃣ Enter target values in the Input_Target sheet
3️⃣ Define KPIs in the KPI Definition sheet
4️⃣ Refresh Power BI
5️⃣ Analyze performance using slicers and visuals
No coding. No complex setup. Just plug, refresh, and analyze.
🔹 Who Can Benefit from This Dashboard?
✅ Port Authorities
✅ Procurement & Purchase Managers
✅ Supply Chain Teams
✅ Finance Departments
✅ Operations Managers
✅ Business Analysts
✅ Logistics Teams
Any organization handling port purchasing operations can use this dashboard to improve efficiency and control.
🔹 Why Choose This Dashboard?
✔ Saves time with automated reporting
✔ Improves purchasing visibility
✔ Helps track targets accurately
✔ Supports data-driven decisions
✔ Easy to customize
✔ Works with Excel & Power BI
✔ Ideal for management reporting
This dashboard transforms raw purchasing data into meaningful insights that drive smarter decisions.
Click here to read the Detailed Blog Post
Watch the step-by-step video tutorial:


Reviews
There are no reviews yet.