


Managing port projects is never easy. With multiple stakeholders, tight timelines, high-value contracts, and complex operations, even a small delay can lead to major financial and operational losses. That’s why modern ports need a smart, visual, and data-driven way to track project performance.
The Port Project Management KPI Dashboard in Power BI is a powerful, ready-to-use analytics solution designed to help port authorities, project managers, and operations teams monitor project performance, track KPIs, and make faster, data-backed decisions — all from a single interactive dashboard.
This dashboard transforms raw project data into meaningful insights, helping you stay in control of timelines, budgets, and performance goals with ease.
🚀 Key Features of Port Project Management KPI Dashboard
✔ Interactive Power BI dashboard with dynamic visuals
✔ Excel-based data input – no complex database needed
✔ Month-wise and KPI-wise performance tracking
✔ Real-time comparison of Actual vs Target values
✔ Automated MTD and YTD calculations
✔ Visual performance indicators with arrows
✔ Clean, professional layout for management reporting
✔ Easy to customize for any port or infrastructure project
📊 What’s Inside the Port Project Management KPI Dashboard
This dashboard is designed with a clear structure to ensure maximum usability and clarity.
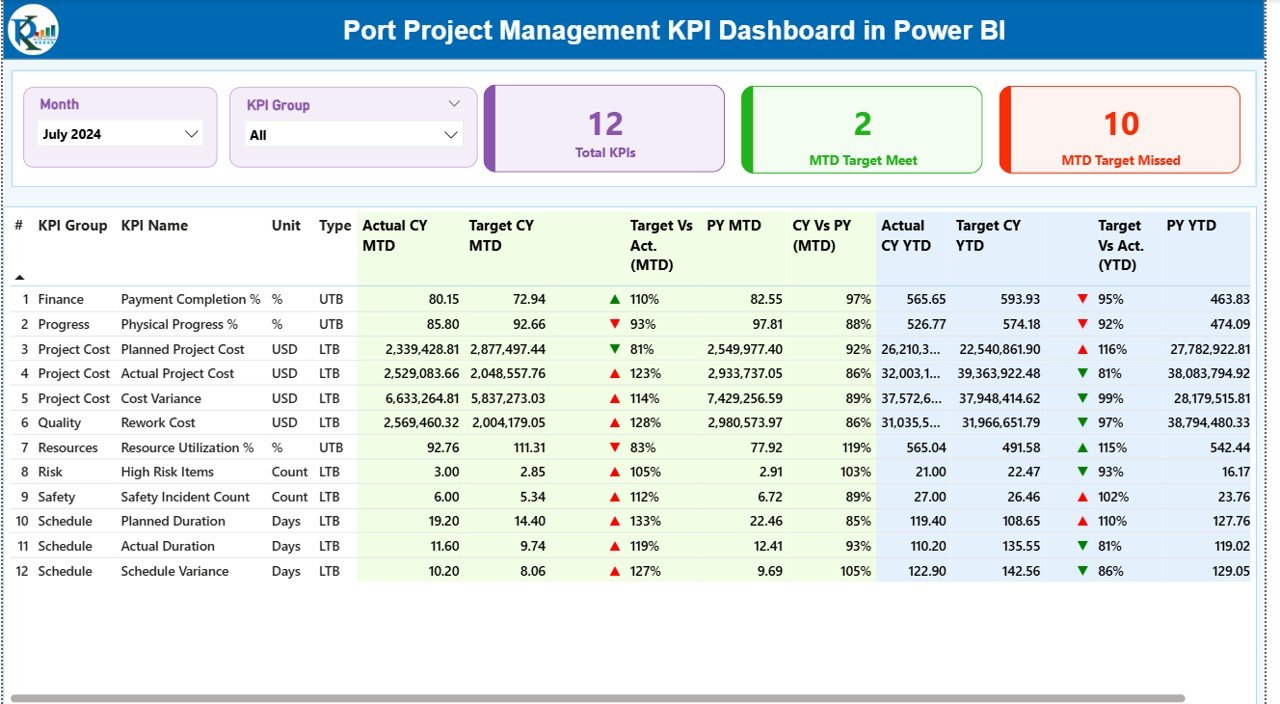
🔹 1. Summary Page – Performance Overview
The Summary Page acts as the command center of the dashboard.
It includes:
-
Month and KPI Group slicers for instant filtering
-
Total KPI Count
-
MTD Target Met KPIs
-
MTD Target Missed KPIs
Below the cards, a detailed KPI table displays:
-
KPI Number
-
KPI Group
-
KPI Name
-
Unit of Measurement
-
KPI Type (LTB / UTB)
-
Actual CY MTD
-
Target CY MTD
-
MTD Status (Green / Red arrows)
-
Target vs Actual
-
Previous Year MTD comparison
-
YTD performance indicators
This allows users to quickly identify performance gaps and take action.
🔹 2. KPI Trend Page – Performance Analysis
This page helps users analyze performance trends over time.
It includes:
-
KPI selector for focused analysis
-
MTD trend chart
-
YTD trend chart
-
Comparison between Current Year, Previous Year, and Target
With these visuals, users can:
✔ Spot delays early
✔ Track progress trends
✔ Analyze seasonal performance
✔ Identify improvement areas
🔹 3. KPI Definition Page – Detailed KPI Information
This page provides complete clarity on each KPI, including:
-
KPI Number
-
KPI Name
-
KPI Group
-
Unit
-
Formula
-
Definition
-
KPI Type (LTB / UTB)
Users can drill through from the Summary Page for deeper understanding.
🛠️ How to Use the Port Project Management KPI Dashboard
1️⃣ Enter actual project data in the Input_Actual sheet
2️⃣ Update targets in the Input_Target sheet
3️⃣ Define KPIs in the KPI Definition sheet
4️⃣ Refresh the Power BI file
5️⃣ Instantly view updated KPIs, trends, and performance
No technical skills required — just update Excel and refresh Power BI.
👥 Who Can Benefit from This Dashboard?
This dashboard is ideal for:
✔ Port Authorities
✔ Project Managers
✔ Engineering Teams
✔ Operations Managers
✔ PMO Teams
✔ Infrastructure Consultants
✔ Logistics & Port Operations Teams
Whether you manage small port upgrades or large infrastructure projects, this dashboard gives you full visibility and control.
✅ Why Choose This Dashboard?
✔ Centralized project monitoring
✔ Faster and smarter decision-making
✔ Reduced project risks
✔ Improved accountability
✔ Clear visual reporting
✔ Executive-ready dashboards
✔ Easy customization
This dashboard helps you move from reactive management to proactive decision-making.
Click here to read the detailed blog post
Watch the step-by-step video tutorial:


Reviews
There are no reviews yet.