Managing port infrastructure and operational projects is complex, high-risk, and cost-intensive. Port authorities, terminal operators, EPC contractors, and project management teams must control budgets, timelines, resources, vendors, and compliance simultaneously. However, when project KPIs are spread across multiple Excel files, emails, and static reports, visibility drops and decisions become delayed.
That is exactly why the Port Project Management KPI Dashboard in Excel is a powerful, ready-to-use solution designed to bring complete project clarity into one interactive dashboard.
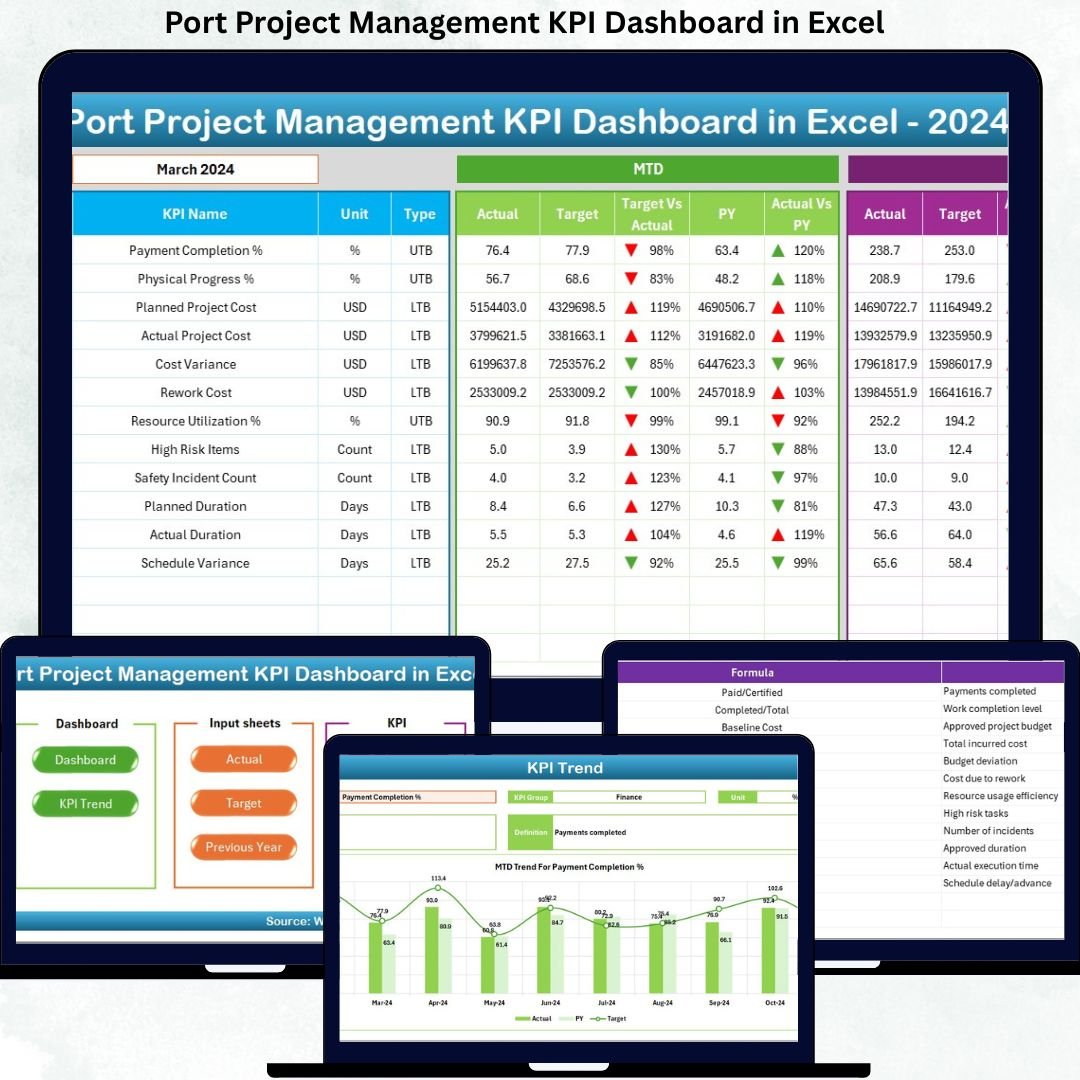
This professionally designed Excel dashboard converts raw project data into meaningful KPIs, trends, and performance indicators. Instead of reacting to issues after they occur, teams gain real-time visibility and take proactive control of port projects—without investing in expensive BI tools.
🔑 Key Features of Port Project Management KPI Dashboard in Excel
🚀 Centralized KPI Monitoring – Track all critical port project KPIs from a single dashboard
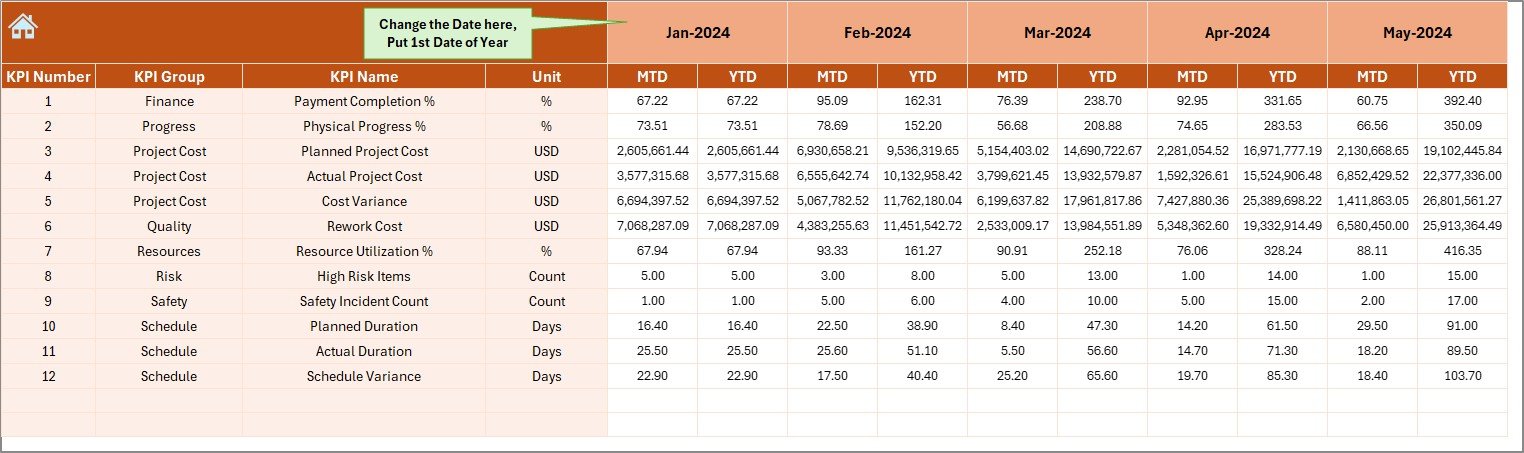
📅 Month-Wise Dynamic Analysis – Change the month using a drop-down and see instant updates
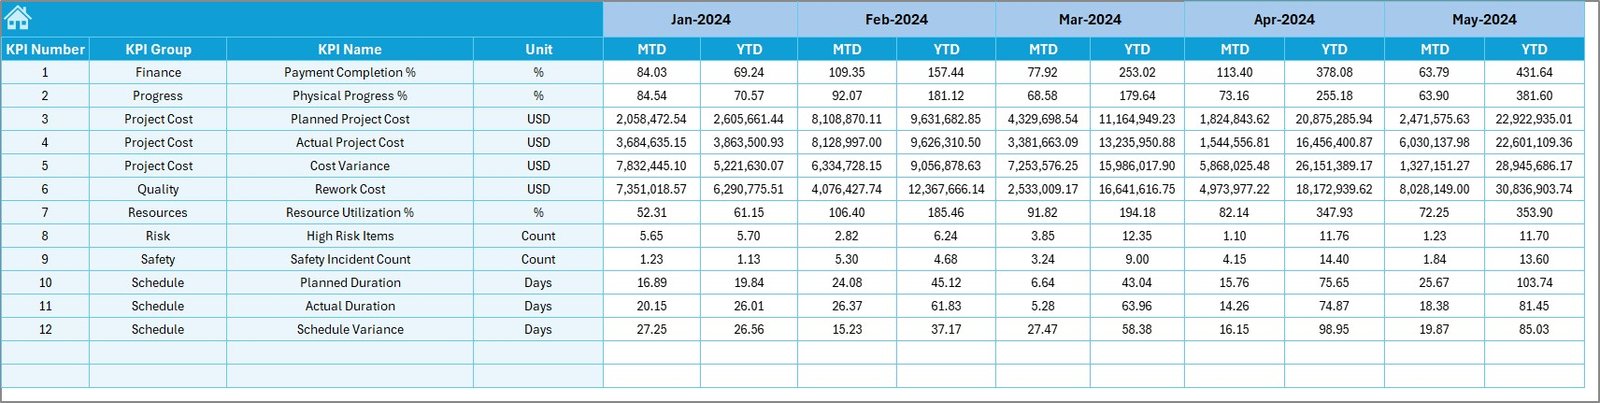
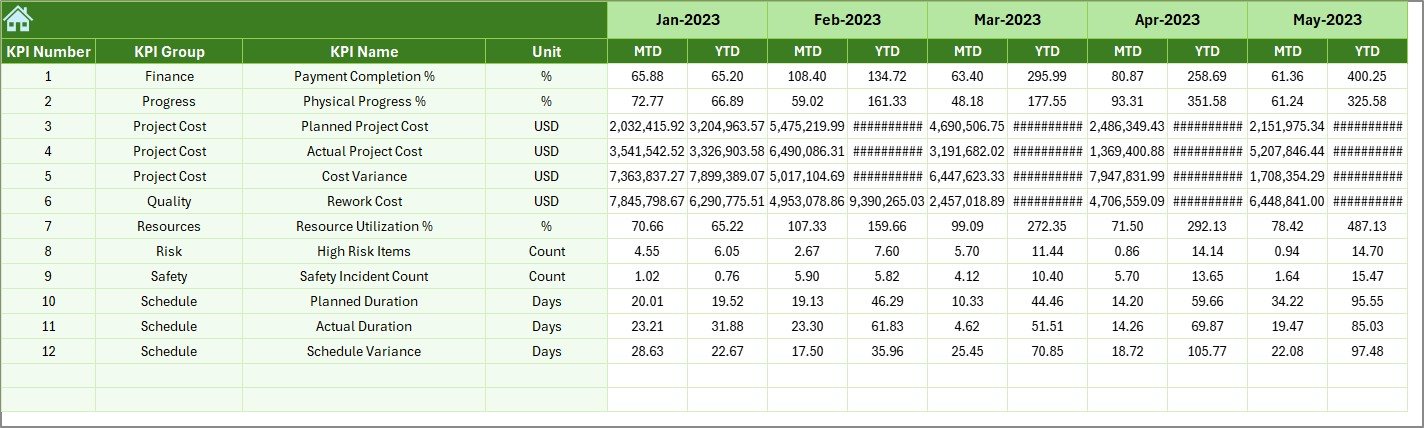
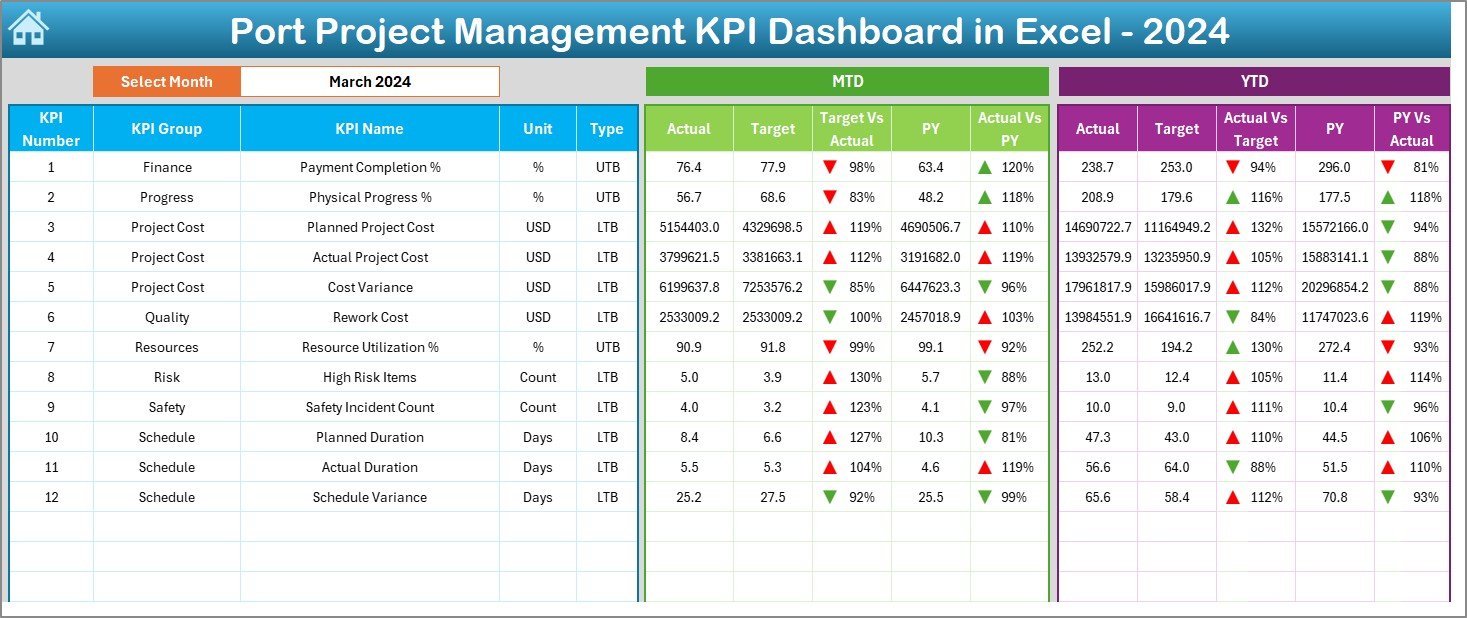
📊 MTD & YTD Performance Tracking – Monitor Month-to-Date and Year-to-Date results clearly
📈 Target vs Actual & PY Comparison – Identify gaps using variance calculations
🔼🔽 Conditional Formatting Indicators – Up and down arrows highlight performance trends instantly
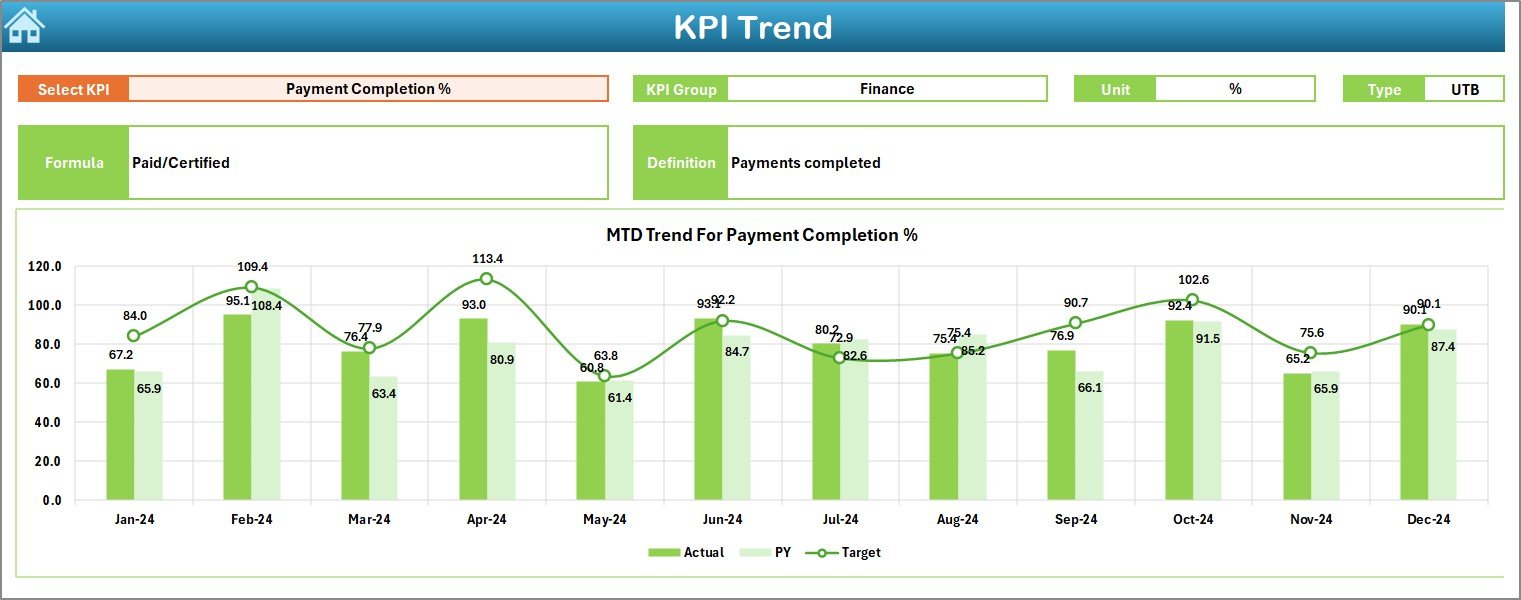
📉 Trend Analysis Sheet – Analyze KPI behavior over time using dynamic charts
🧭 Easy Navigation – One-click buttons to jump between dashboard sections
This feature-rich setup ensures clarity, speed, and accuracy during reviews and decision-making meetings.
📦 What’s Inside the Port Project Management KPI Dashboard in Excel
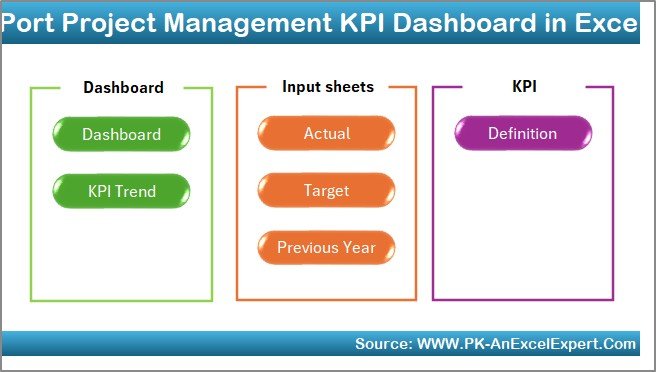
This digital product includes 7 structured Excel worksheets, each designed for a specific purpose:
📌 Summary Page – An index page with navigation buttons for quick access
📌 Dashboard Sheet – The main KPI overview showing MTD & YTD performance
📌 Trend Sheet – Deep-dive KPI trend analysis with metadata and comparisons
📌 Actual Numbers Sheet – Structured input for monthly actual performance
📌 Target Sheet – Planned KPI targets for benchmarking
📌 Previous Year Sheet – Historical KPI values for year-on-year analysis
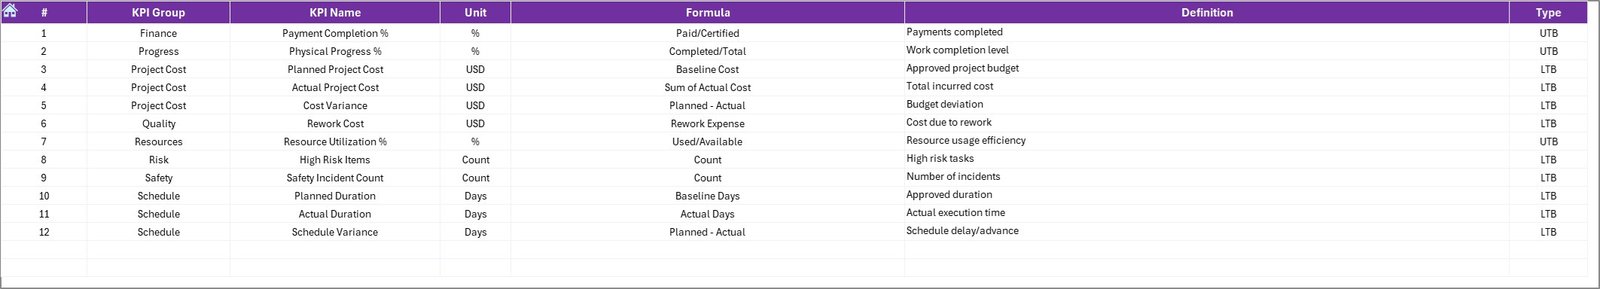
📌 KPI Definition Sheet – Clear documentation of KPI formulas, units, and definitions
Together, these sheets create a complete end-to-end KPI monitoring system.
🛠️ How to Use the Port Project Management KPI Dashboard in Excel
Using this dashboard is simple and intuitive:
1️⃣ Enter actual KPI values in the Actual Numbers sheet
2️⃣ Define monthly and yearly targets in the Target Sheet
3️⃣ Add last year’s performance in the Previous Year Sheet
4️⃣ Select the month from the drop-down on the Dashboard
5️⃣ Review KPIs, variances, and trends instantly
All calculations, visuals, and indicators update automatically—no advanced Excel skills required.
👥 Who Can Benefit from This Port Project Management KPI Dashboard
⚓ Port Authorities & Operators – Monitor infrastructure and operational projects
🏗️ EPC & Construction Contractors – Track schedule, cost, and performance KPIs
📋 Project Management Offices (PMOs) – Ensure standardized KPI reporting
💰 Finance & Planning Teams – Control budgets and forecast performance
📊 Senior Leadership – Gain a high-level view for faster decision-making
Whether managing a single port project or multiple initiatives, this dashboard adapts easily.
Click here to read the detailed blog post
Watch the step-by-step video tutorial:
Visit our YouTube channel to learn step-by-step video tutorials
👉 https://youtube.com/@PKAnExcelExpert


Reviews
There are no reviews yet.