Managing port tenders is a high-stakes responsibility. Each tender involves large contract values, strict timelines, multiple ports, and financial risk. Port authorities, logistics companies, infrastructure firms, and bid management teams must track performance carefully to avoid losses and delays. However, when tender data remains scattered across Excel files, emails, and manual reports, visibility drops and decision-making becomes slow and uncertain.
That is exactly where the Port Tender KPI Dashboard in Excel becomes a powerful and practical solution.
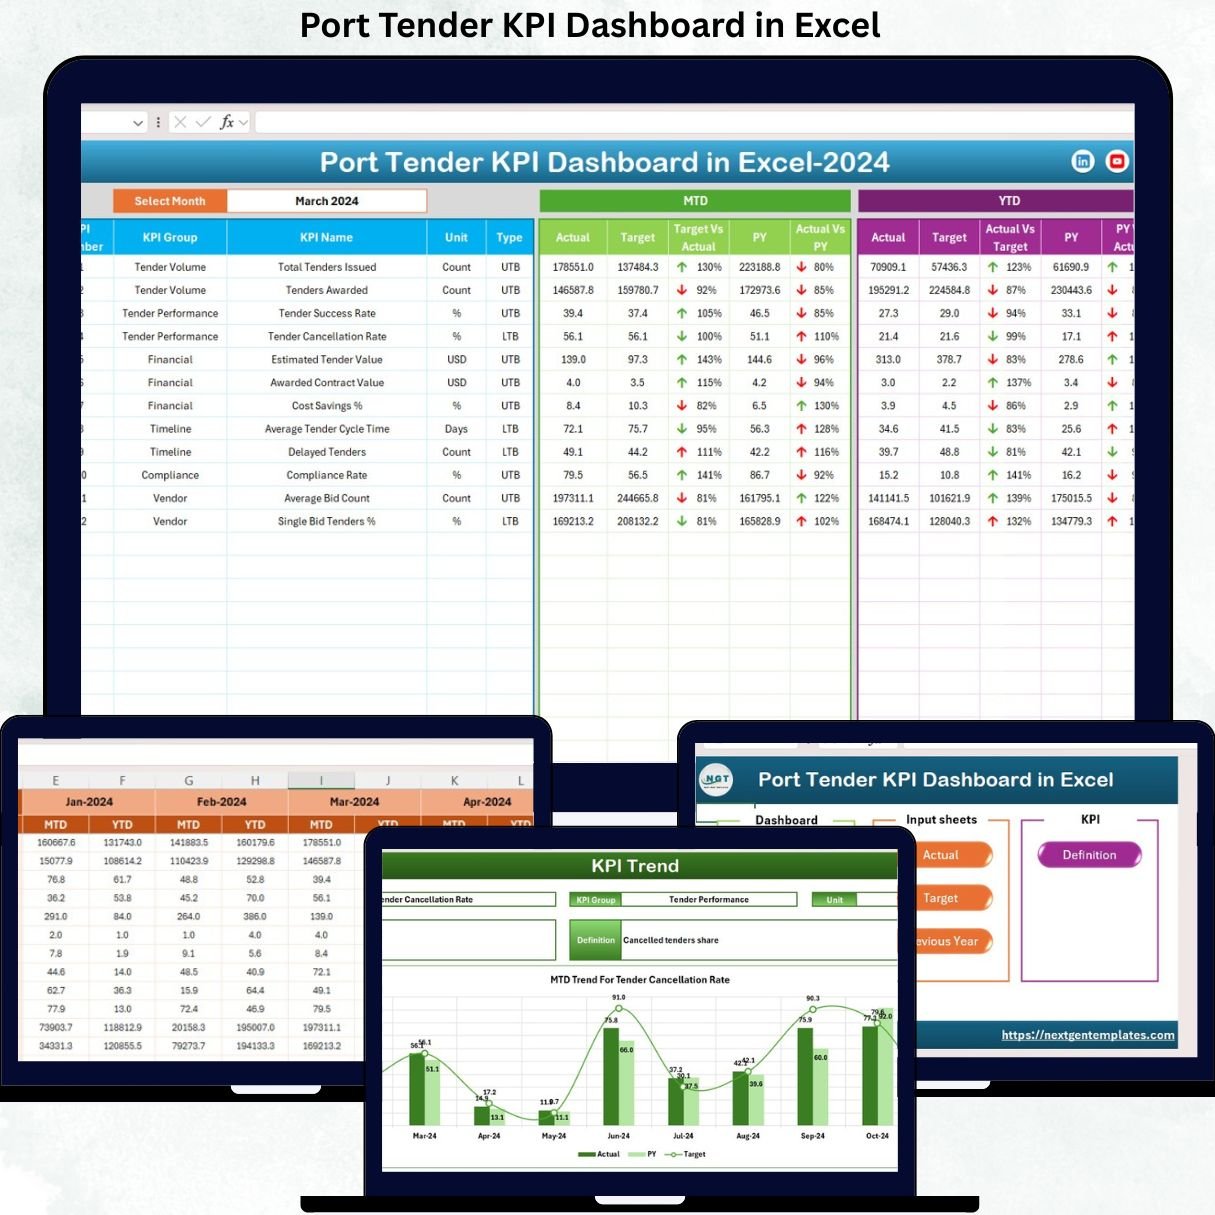
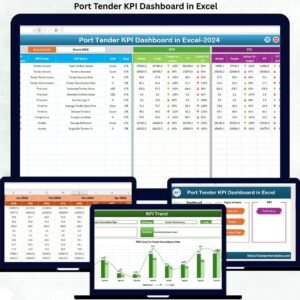
This ready-to-use Excel dashboard converts raw tender data into structured KPIs, automated calculations, trend analysis, and clear visuals. Instead of spending hours preparing reports, teams can monitor performance instantly, compare targets versus actuals, and identify risks early—without investing in expensive BI tools. Built entirely in Excel, the dashboard combines advanced analytics with familiarity and flexibility.
✨ Key Features of the Port Tender KPI Dashboard in Excel
📊 1. Centralized KPI Monitoring
Track all key tender performance indicators from one dashboard—no switching between files or reports.
🎯 2. MTD & YTD Performance Tracking
Analyze Month-to-Date and Year-to-Date results to understand short-term progress and long-term trends.
📈 3. Target vs Actual & PY Comparison
Measure current performance against targets and previous year values to spot gaps and improvements.
⚡ 4. Automated Calculations & Visual Indicators
Conditional formatting arrows instantly show positive or negative performance, saving analysis time.
🧩 5. Fully Customizable Excel Model
Easily adjust KPIs, targets, formulas, and layouts to match your tender strategy.
📦 What’s Inside the Port Tender KPI Dashboard in Excel
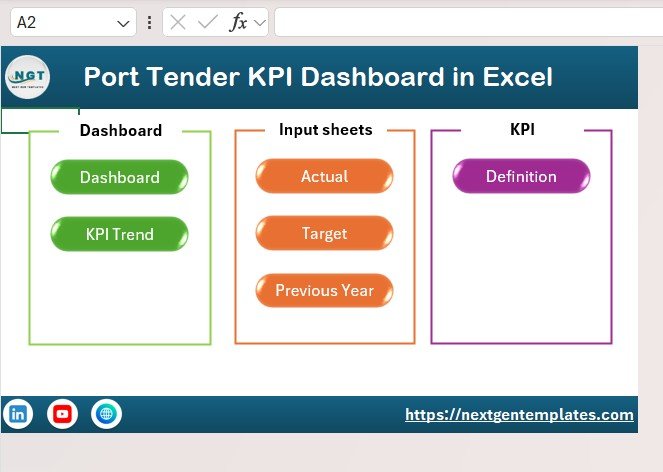
🧭 Summary Page (Index Sheet)
This page works as the navigation hub of the dashboard.
-
Six clickable buttons
-
One-click movement to key sheets
-
Clean layout ideal for management presentations
It ensures smooth navigation during reviews and decision meetings.
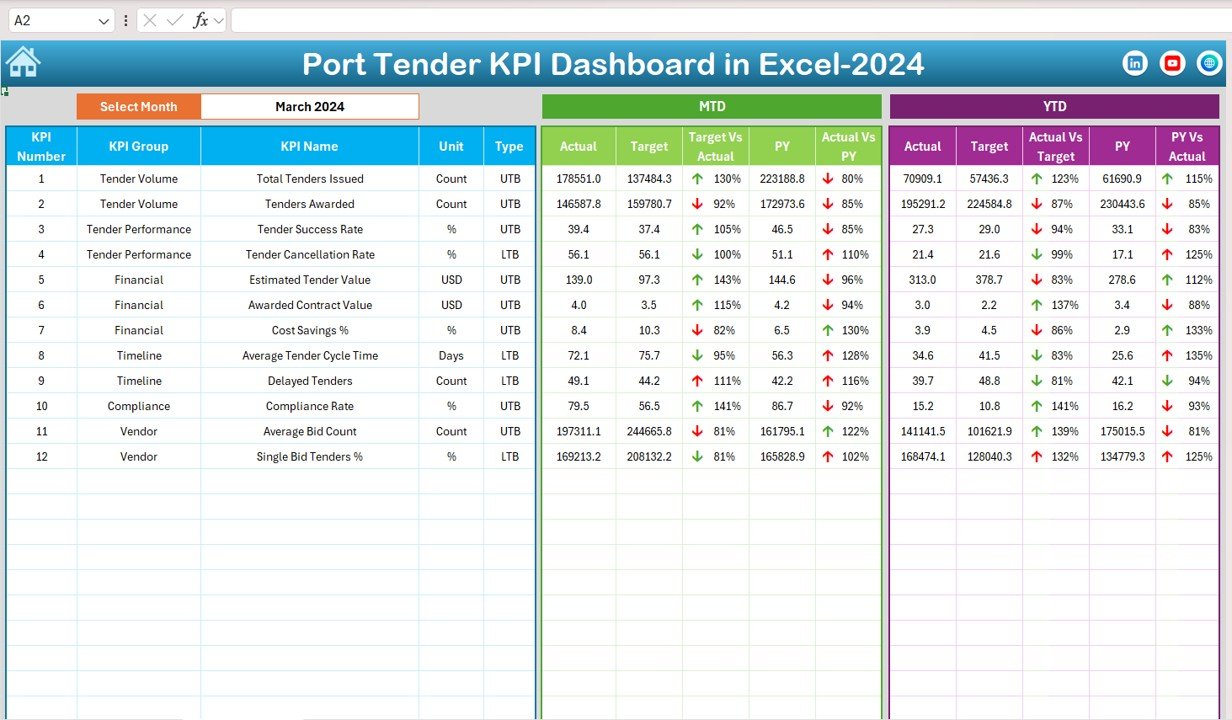
📊 Dashboard Sheet (Main KPI View)
This is the heart of the dashboard.
Month Selector
-
Located at cell D3
-
Select any month and all KPIs update instantly
KPIs Displayed
MTD Metrics
-
Actual
-
Target
-
Previous Year
-
Target vs Actual
-
PY vs Actual
YTD Metrics
-
Actual
-
Target
-
Previous Year
-
Target vs Actual
-
PY vs Actual
Performance Indicators
-
🔼 Green arrow → Positive performance
-
🔽 Red arrow → Negative performance
This layout allows quick performance evaluation without deep analysis.
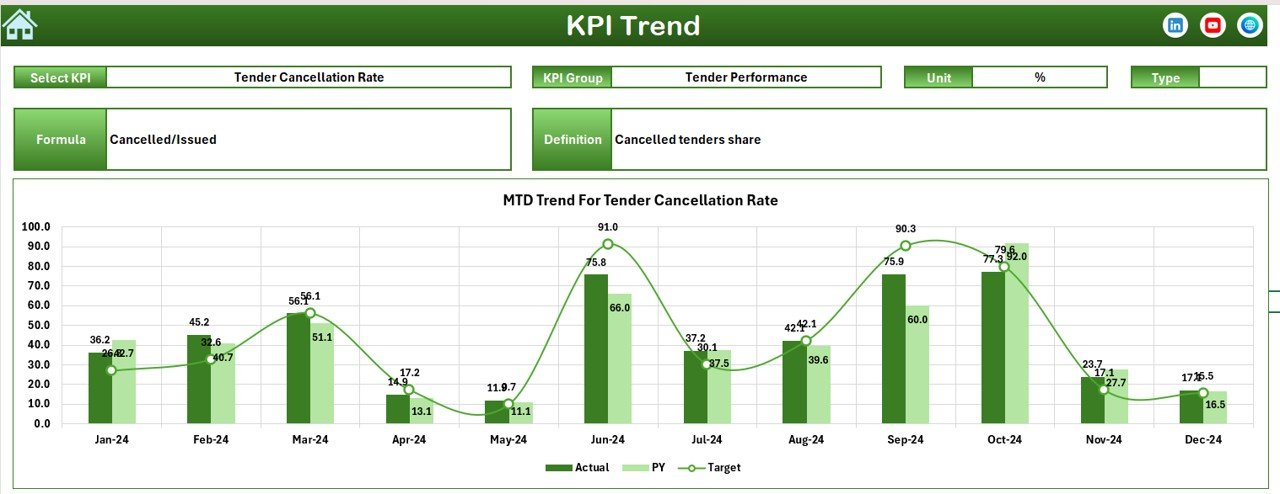
📉 Trend Sheet Tab
This sheet provides detailed KPI-level insights.
KPI Selection
-
Dropdown in cell C3
Details Displayed
-
KPI Name
-
KPI Group
-
Unit
-
KPI Type (LTB / UTB)
-
Formula
-
Definition
Trend Charts
-
MTD trend
-
YTD trend
-
Actual vs Target vs Previous Year
It helps identify seasonality, consistency, and performance patterns.
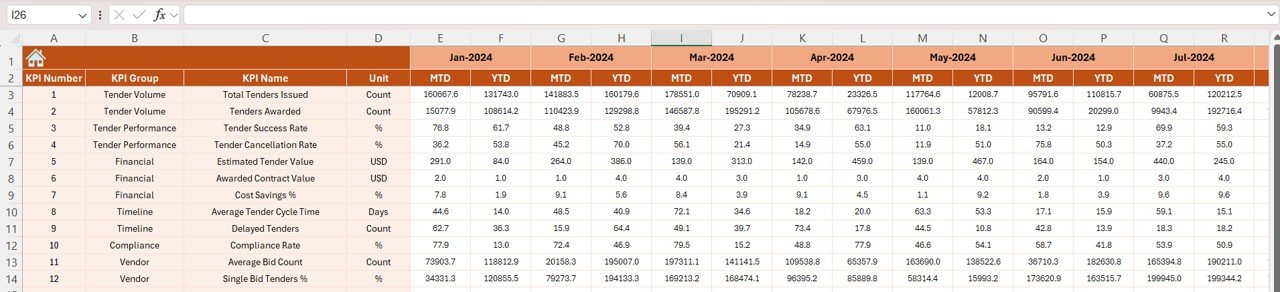
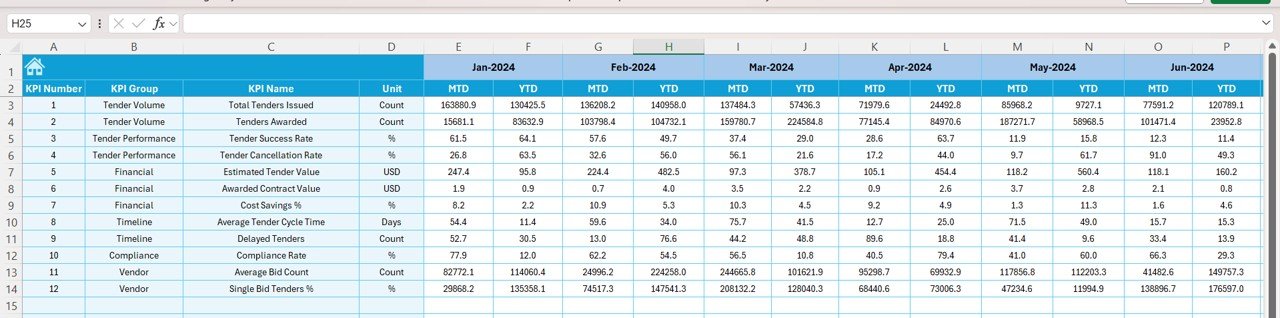
📋 Actual Numbers Input Sheet
This sheet controls data entry.
How It Works
-
Select the first month of the year in cell E1
-
Enter MTD and YTD actual values
-
Dashboard updates automatically
This design protects formulas while ensuring accurate inputs.
🎯 Target Sheet Tab
This sheet stores performance goals.
Includes
-
Monthly MTD targets
-
YTD targets for each KPI
Targets can be revised easily based on strategy changes.
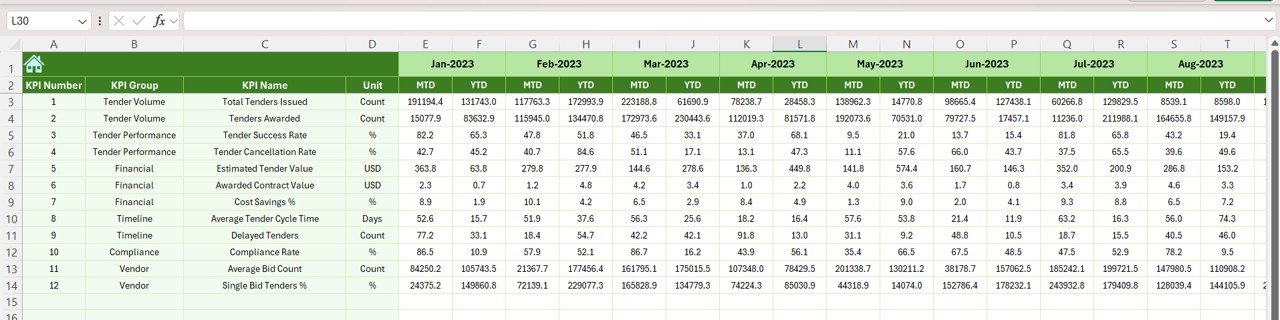
📆 Previous Year Number Sheet
This sheet stores historical data.
Purpose
-
Maintain previous year MTD & YTD values
-
Enable YOY comparison
-
Support benchmarking and long-term analysis
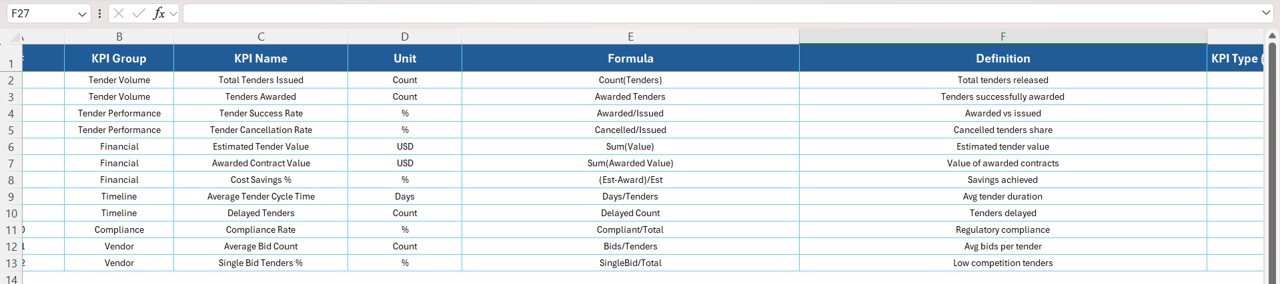
📘 KPI Definition Sheet
This is the master reference sheet.
Fields Included
-
KPI Name
-
KPI Group
-
Unit
-
Formula
-
KPI Definition
-
KPI Type (LTB / UTB)
It ensures transparency and consistency across teams.
🎯 Who Can Benefit from This Port Tender KPI Dashboard in Excel
-
⚓ Port Authorities – Monitor tender success and risk clearly
-
🚚 Logistics & Shipping Companies – Track value, margins, and performance
-
🏗️ Infrastructure Firms – Improve bid evaluation and profitability
-
📊 Tender & Commercial Teams – Analyze KPIs efficiently
-
💼 Finance Teams & Leadership – Gain clear financial visibility
### Click here to read the Detailed blog post
Watch the step-by-step video tutorial:


Reviews
There are no reviews yet.