TV channels operate in a high-pressure environment where ratings, audience reach, advertising revenue, and content performance must be monitored continuously. However, when KPI data is scattered across multiple Excel files and reports, teams struggle with delays, inconsistencies, and reactive decision-making.
That is exactly why the TV Channels KPI Dashboard in Excel becomes a powerful and practical performance management solution.
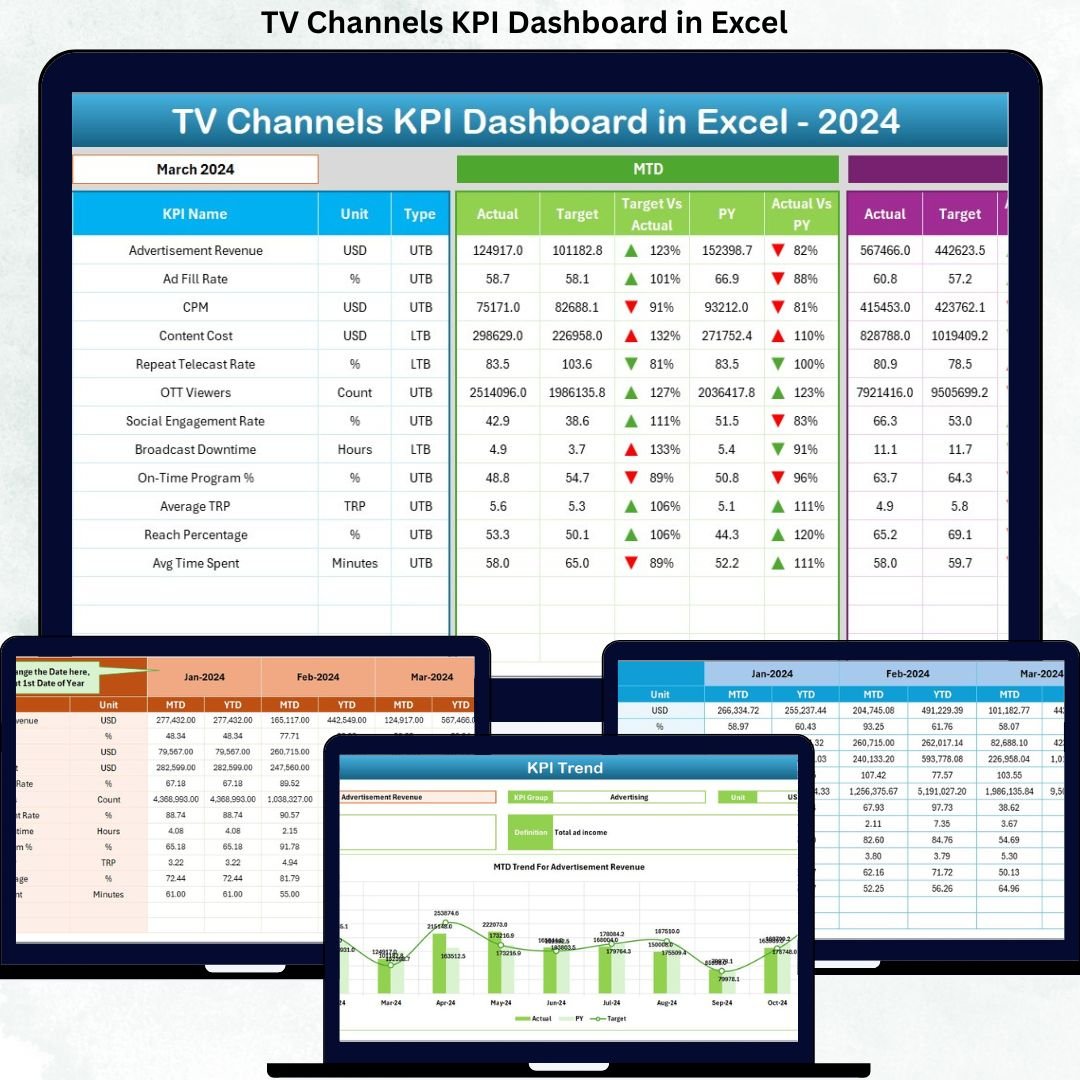
This ready-to-use Excel dashboard converts raw TV channel data into structured KPIs, automated calculations, and clear visual indicators. Instead of spending hours preparing reports, channel heads, programming teams, and management gain instant visibility into MTD, YTD, target achievement, and year-over-year performance. As a result, decisions become faster, more confident, and strategically aligned.
🔑 Key Features of TV Channels KPI Dashboard in Excel
📊 Centralized KPI Monitoring
Track all TV channel KPIs in one structured and interactive Excel dashboard.
📅 MTD & YTD Performance Tracking
Monitor short-term monthly results and long-term yearly progress together.
🎯 Target vs Actual Analysis
Instantly identify KPIs meeting or missing targets using percentages and arrows.
📈 Current Year vs Previous Year Comparison
Measure growth, decline, or stability with clear CY vs PY analysis.
🧭 Month-Based Filtering
Select any reporting month using a simple drop-down to refresh the entire dashboard.
📘 Structured KPI Definitions
Maintain clarity with KPI group, unit, formula, and LTB/UTB classification.
⚙️ 100% Excel-Based & Easy to Use
No external tools required—easy adoption with minimal training.
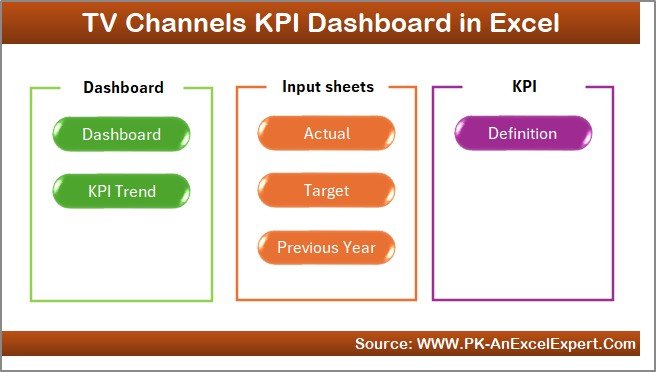
📦 What’s Inside the TV Channels KPI Dashboard in Excel
This professional dashboard includes 7 well-organized worksheets; each designed for clarity and control:
🏠 Home Sheet
A clean navigation hub with 6 buttons for one-click access to key sheets.
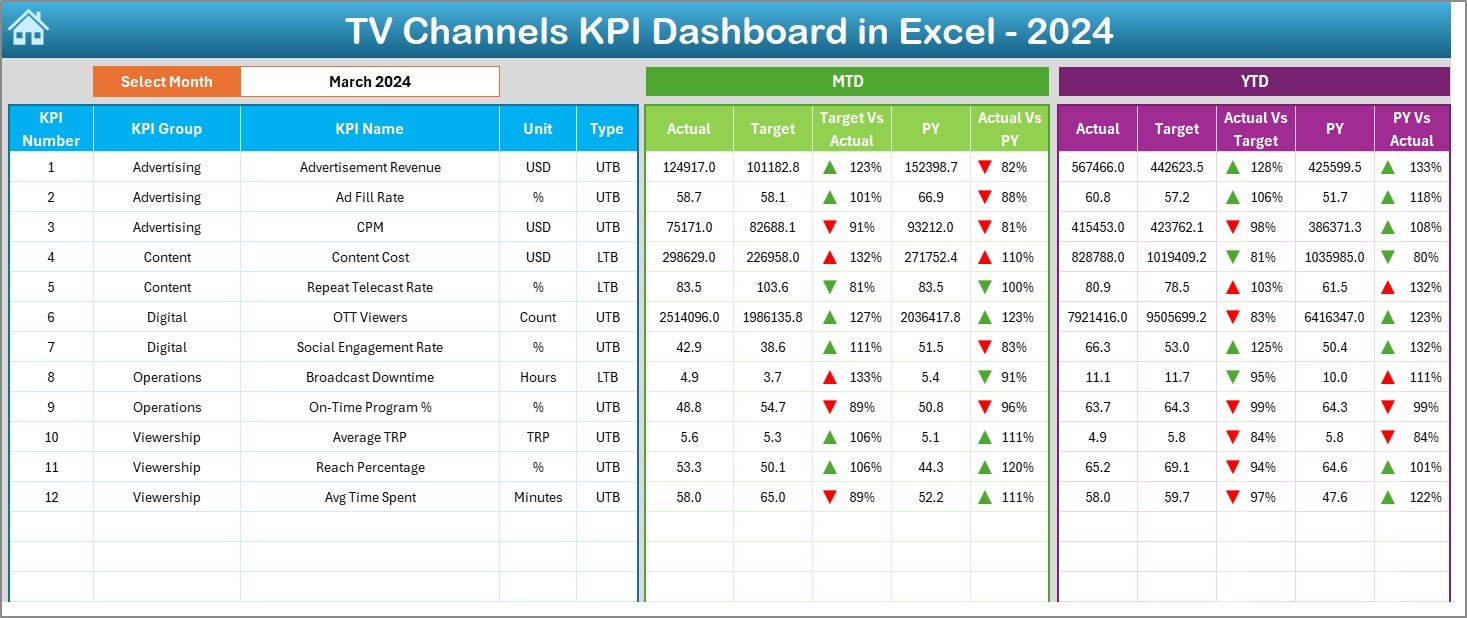
📊 Dashboard Sheet
The main performance overview showing:
-
Month selection at cell D3
-
MTD Actual, Target, and Previous Year values
-
Target vs Actual % and PY vs Actual %
-
YTD Actual, Target, and Previous Year values
-
Conditional formatting with ▲ / ▼ indicators
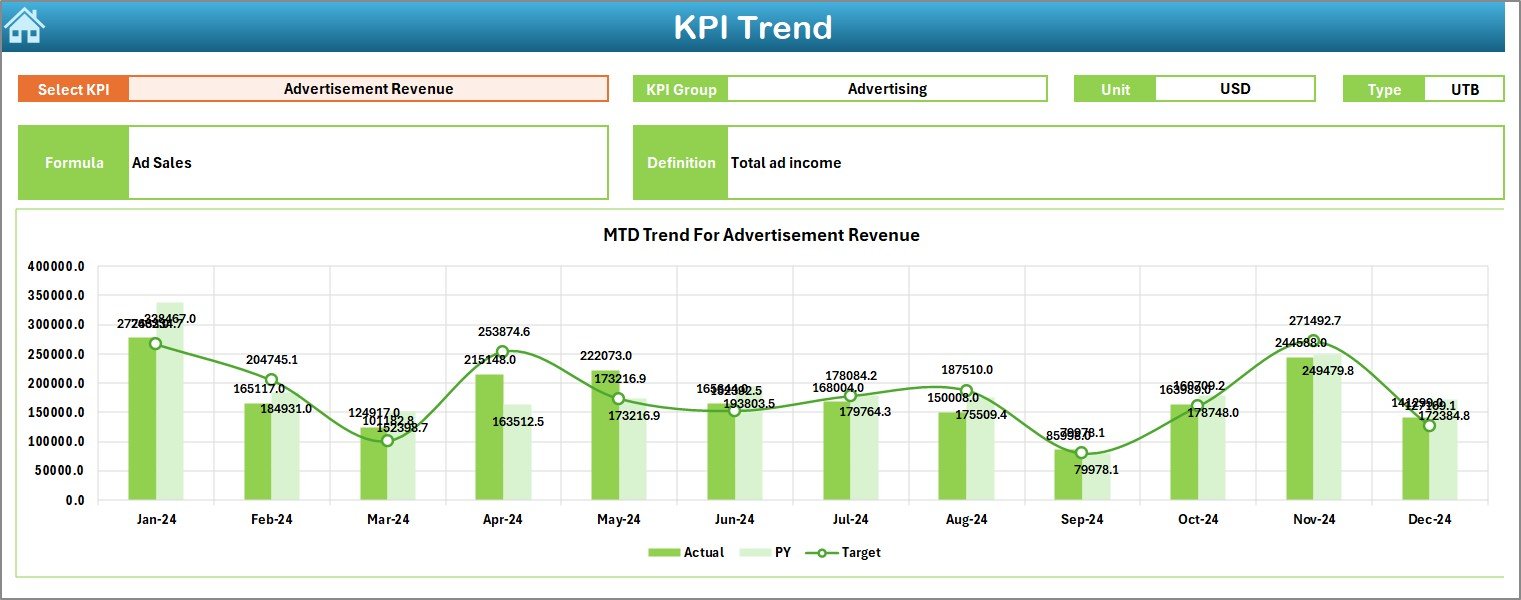
📈 KPI Trend Sheet
Designed for trend analysis with:
-
KPI selection drop-down (cell C3)
-
KPI Group, Unit, Type, Formula, and Definition
-
MTD trend chart (Actual, Target, PY)
-
YTD trend chart (Actual, Target, PY)
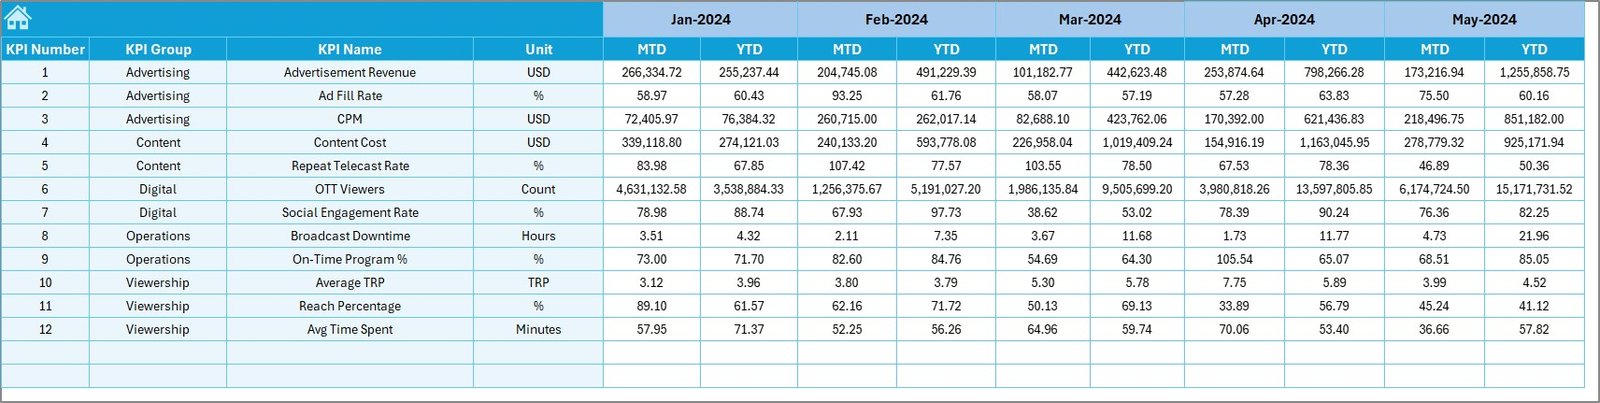
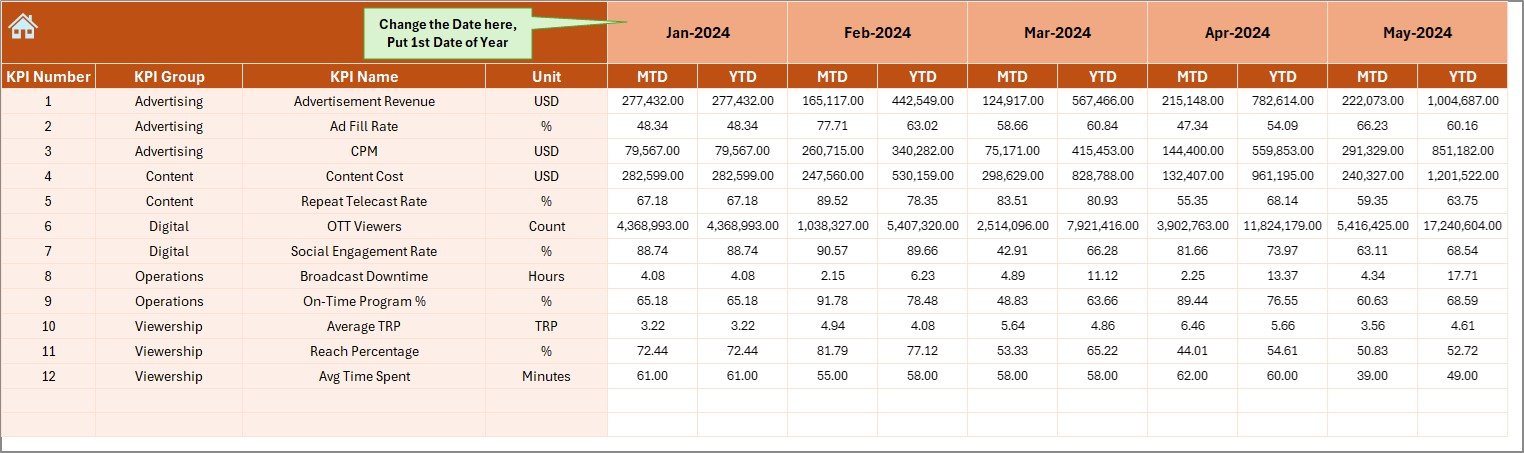
📝 Actual Numbers Input Sheet
Used to enter MTD and YTD actual values in a structured format.
🎯 Target Sheet
Stores KPI-wise MTD and YTD target values for accurate comparison.
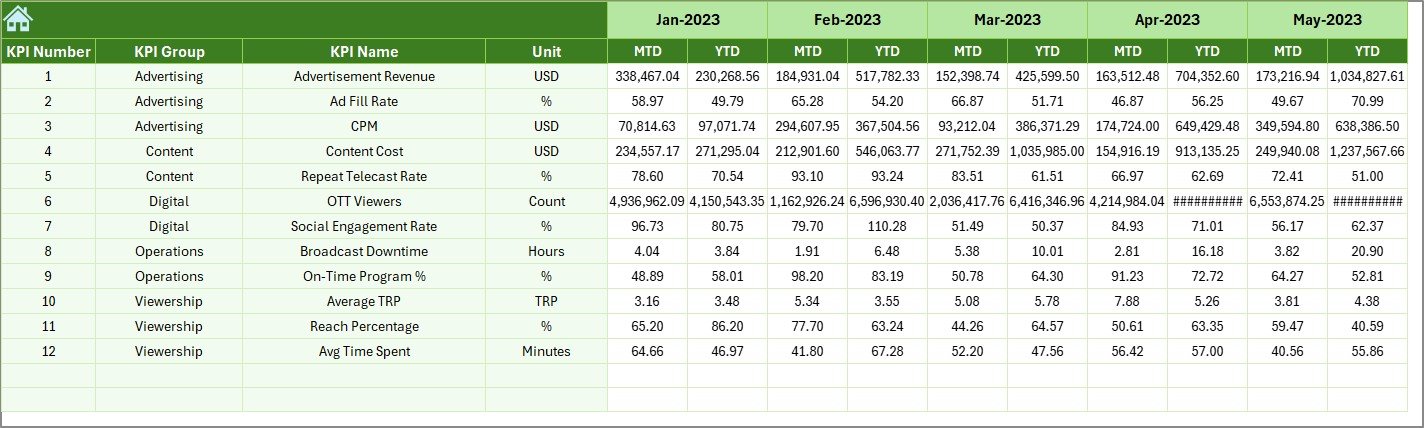
📜 Previous Year Number Sheet
Holds historical MTD and YTD data for year-over-year analysis.
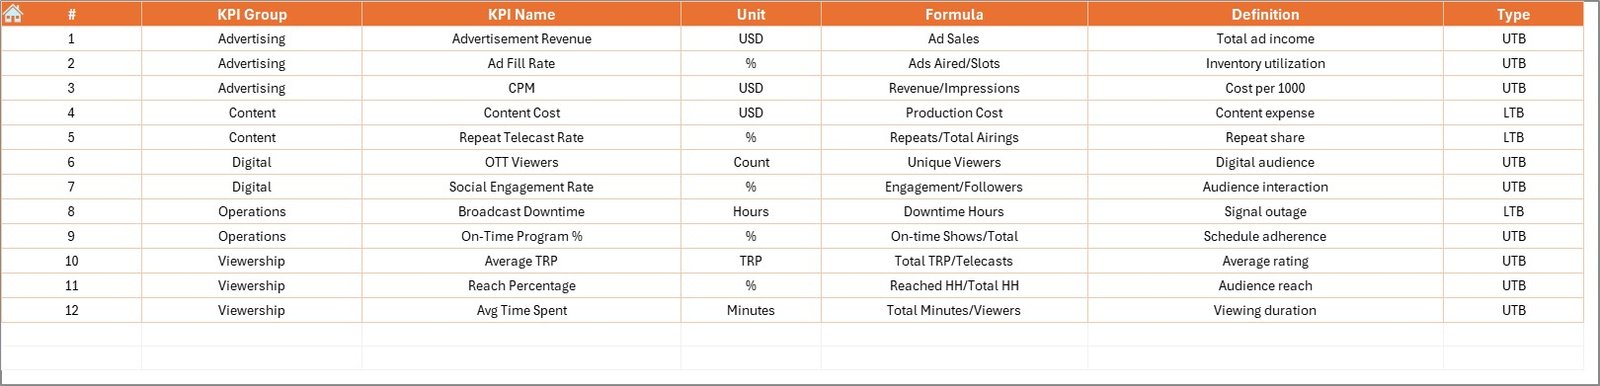
📘 KPI Definition Sheet
Acts as the master reference for KPI name, group, unit, formula, and definition.
▶️ How to Use the TV Channels KPI Dashboard in Excel
Using the dashboard is simple and efficient:
1️⃣ Enter actual performance data in the Actual Numbers Input Sheet
2️⃣ Update planned targets in the Target Sheet
3️⃣ Maintain KPI details in the KPI Definition Sheet
4️⃣ Select the reporting month from the drop-down
5️⃣ Review MTD and YTD performance on the Dashboard
6️⃣ Analyze trends on the KPI Trend Sheet
7️⃣ Take data-driven programming and revenue decisions
No advanced Excel skills are required.
🎯 Who Can Benefit from This TV Channels KPI Dashboard in Excel
📺 TV Channel Heads & Executives – Gain instant performance visibility
📊 Programming Teams – Evaluate content performance
💰 Advertising & Revenue Teams – Track target achievement
📈 Finance & Reporting Teams – Improve accuracy and consistency
🏢 Senior Management – Access decision-ready insights quickly
The dashboard supports both operational reviews and strategic planning.
👉 Click here to read the Detailed Blog Post
🔔 Visit our YouTube channel to learn step-by-step video tutorials
👉 YouTube.com/@PKAnExcelExpert


Reviews
There are no reviews yet.