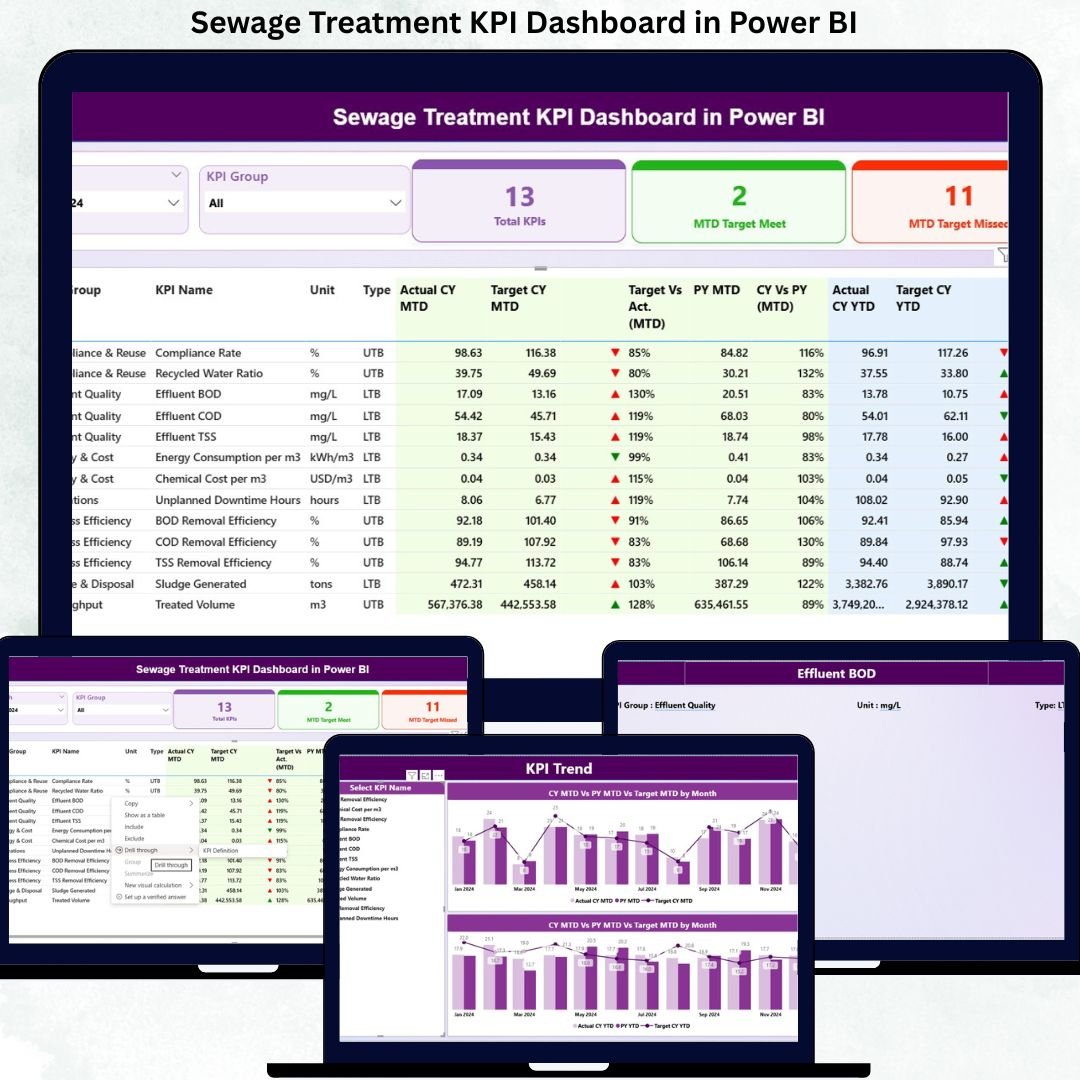
Modern sewage treatment plants operate under constant pressure to meet environmental standards, operational targets, and regulatory compliance. However, when performance data remains scattered across spreadsheets, manual logs, and delayed reports, decision-makers lose clarity and control. That is exactly why the Sewage Treatment KPI Dashboard in Power BI becomes an essential solution for wastewater management teams .
This ready-to-use Power BI dashboard transforms complex sewage treatment data into clear, visual, and actionable insights. Instead of spending hours preparing reports, plant managers and utility teams can instantly monitor operational efficiency, compliance performance, and improvement trends—all from a single, structured dashboard. Designed for simplicity and impact, this product delivers enterprise-level analytics without complex systems or advanced technical skills.
## 🔑 Key Features of Sewage Treatment KPI Dashboard in Power BI
📊 Centralized KPI Monitoring – Track operational, efficiency, and compliance KPIs in one interactive Power BI report
📅 Month & KPI Group Slicers – Instantly filter data by month and KPI category for focused analysis
🎯 MTD & YTD Performance Tracking – Monitor short-term and long-term performance side by side
📈 Target vs Actual Analysis – Identify performance gaps clearly using calculated ratios and visual indicators
🔁 Previous Year Comparison – Measure improvement or decline with CY vs PY performance metrics
🚦 Smart Status Icons – Instantly spot target met or missed KPIs using green and red arrows
📉 Dynamic KPI Trend Charts – Analyze trends over time with interactive MTD and YTD combo charts
📘 KPI Definition Drill-Through – Maintain governance with detailed KPI definitions, formulas, and types
## 📦 What’s Inside the Sewage Treatment KPI Dashboard in Power BI
This digital product includes a fully designed Power BI Desktop file with three structured analytical pages:
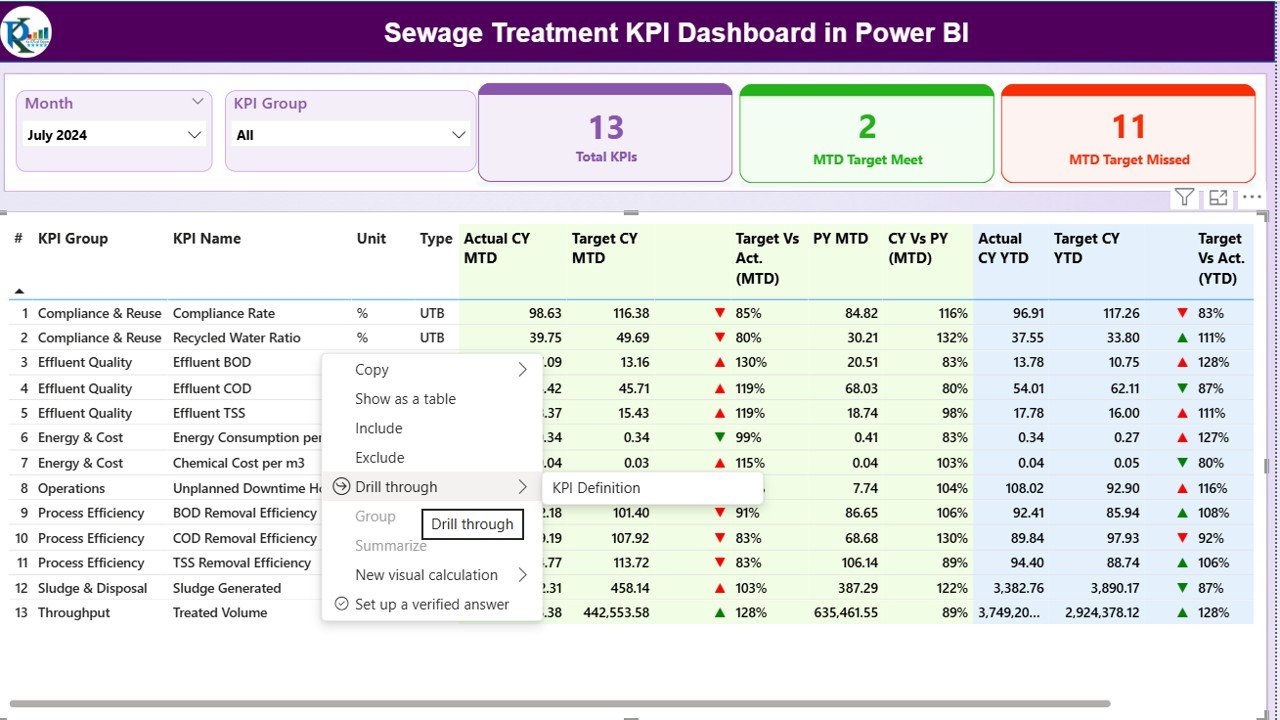
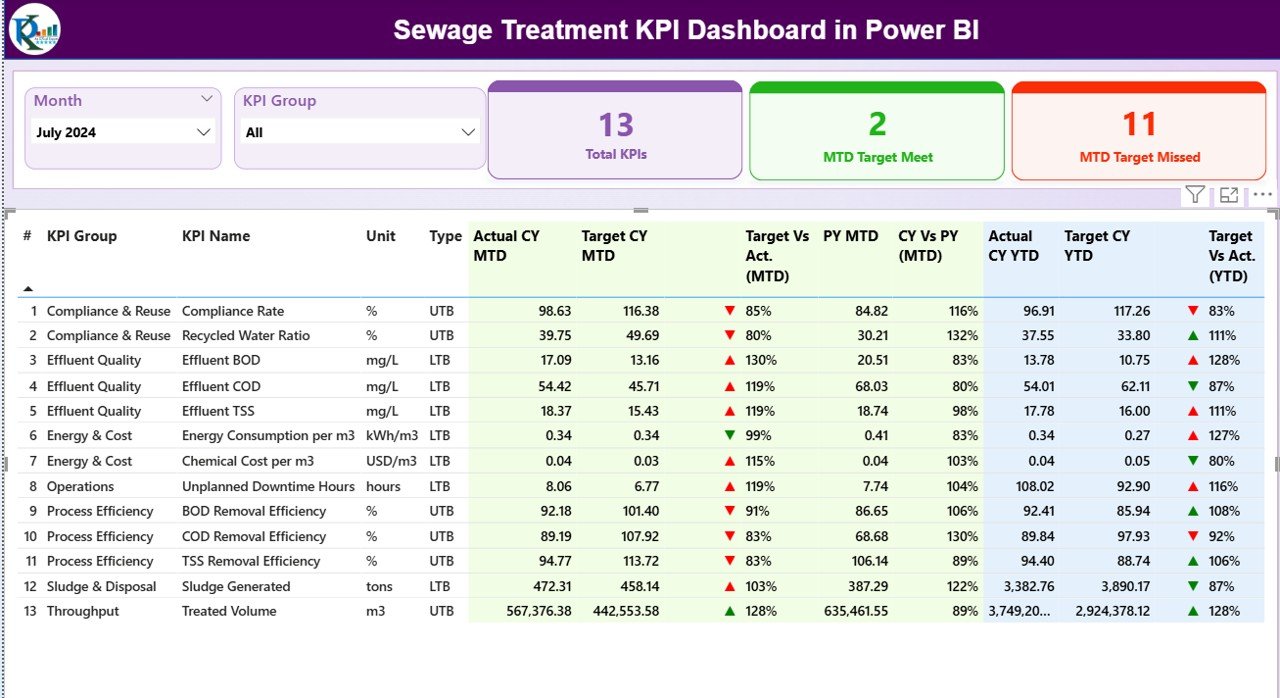
🟢 Summary Page
The main control center displaying KPI slicers, high-level performance cards, and a detailed KPI table covering MTD and YTD metrics with comparisons.
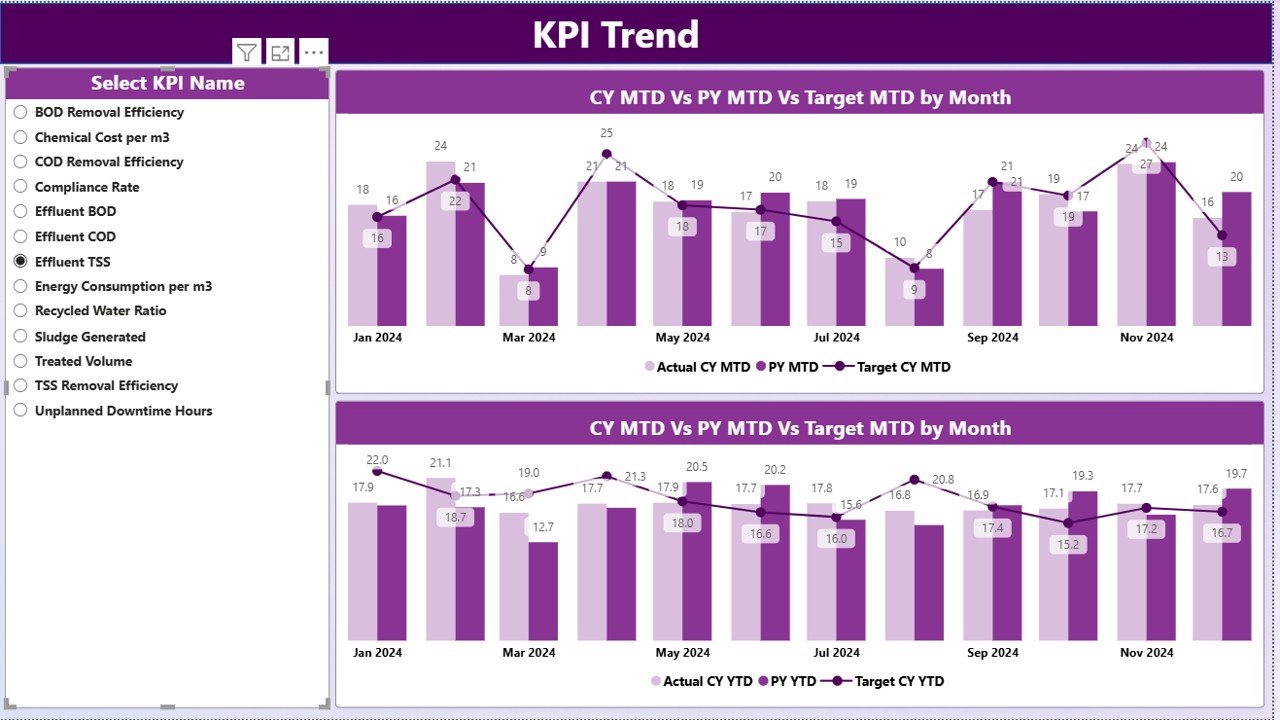
📊 KPI Trend Page
Interactive trend analysis using combo charts that show current year actuals, previous year values, and targets. A KPI selector allows deep-dive analysis for any single KPI.
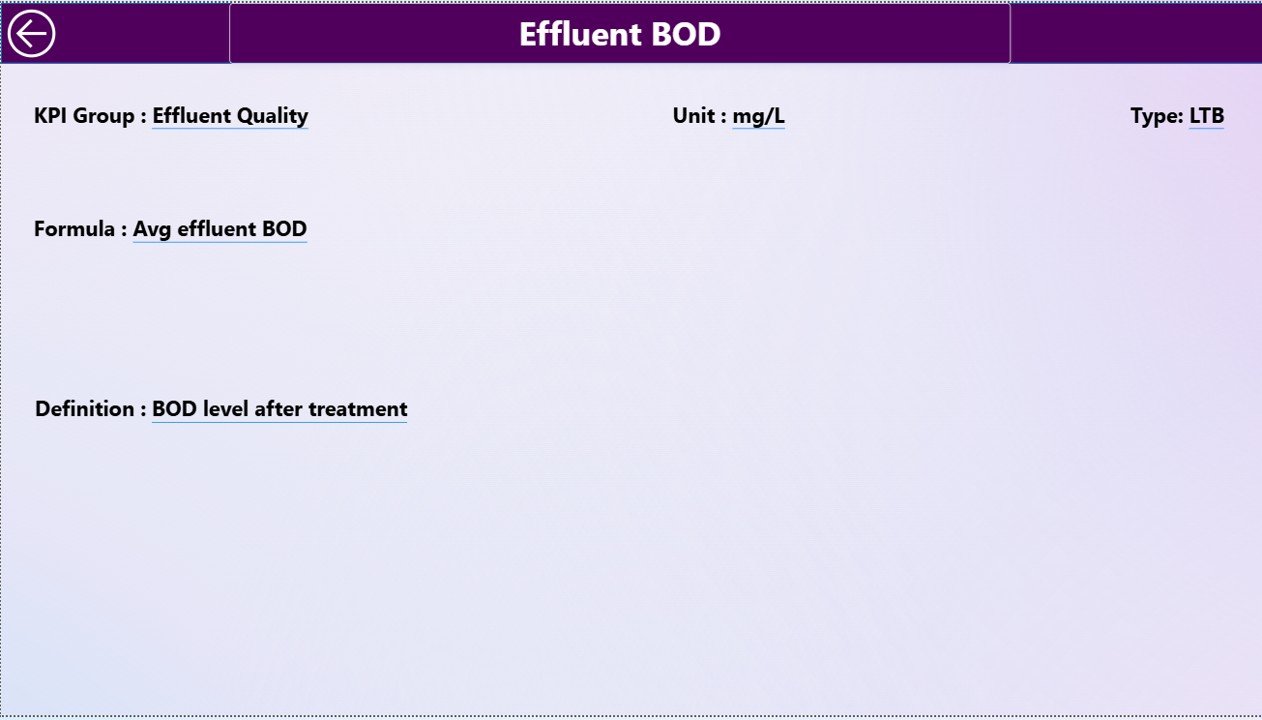
📘 KPI Definition Page
A hidden drill-through page that explains each KPI clearly, including unit, formula, definition, and type (LTB or UTB), ensuring clarity and standardization.
📂 Excel Data Source Structure
The dashboard connects to a simple Excel file containing:
-
Actual KPI values
-
Target KPI values
-
KPI master definitions
This design keeps data entry easy while ensuring powerful analytics.
## ⚙️ How to Use the Sewage Treatment KPI Dashboard in Power BI
Using this dashboard is simple and efficient:
1️⃣ Enter actual KPI values in the Input_Actual Excel sheet
2️⃣ Enter target values in the Input_Target sheet
3️⃣ Maintain KPI details in the KPI Definition sheet
4️⃣ Refresh the Power BI report
5️⃣ Instantly analyze performance using slicers, tables, and charts
Because of this Excel-based structure, even non-technical users can manage and update data confidently.
## 👥 Who Can Benefit from This Sewage Treatment KPI Dashboard in Power BI
🏛️ Municipal sewage treatment authorities
💧 Water and wastewater utility companies
⚙️ Plant managers and operations engineers
🌱 Environmental compliance teams
🏢 Government and regulatory agencies
🏭 Private wastewater treatment operators
If your organization needs clear visibility, faster decisions, and reliable performance tracking, this dashboard is built for you.
Click here to read the Detailed Blog Post
Watch the step-by-step video tutorial:
🎥 Visit our YouTube channel to learn step-by-step video tutorials and see real dashboard demonstrations.


Reviews
There are no reviews yet.