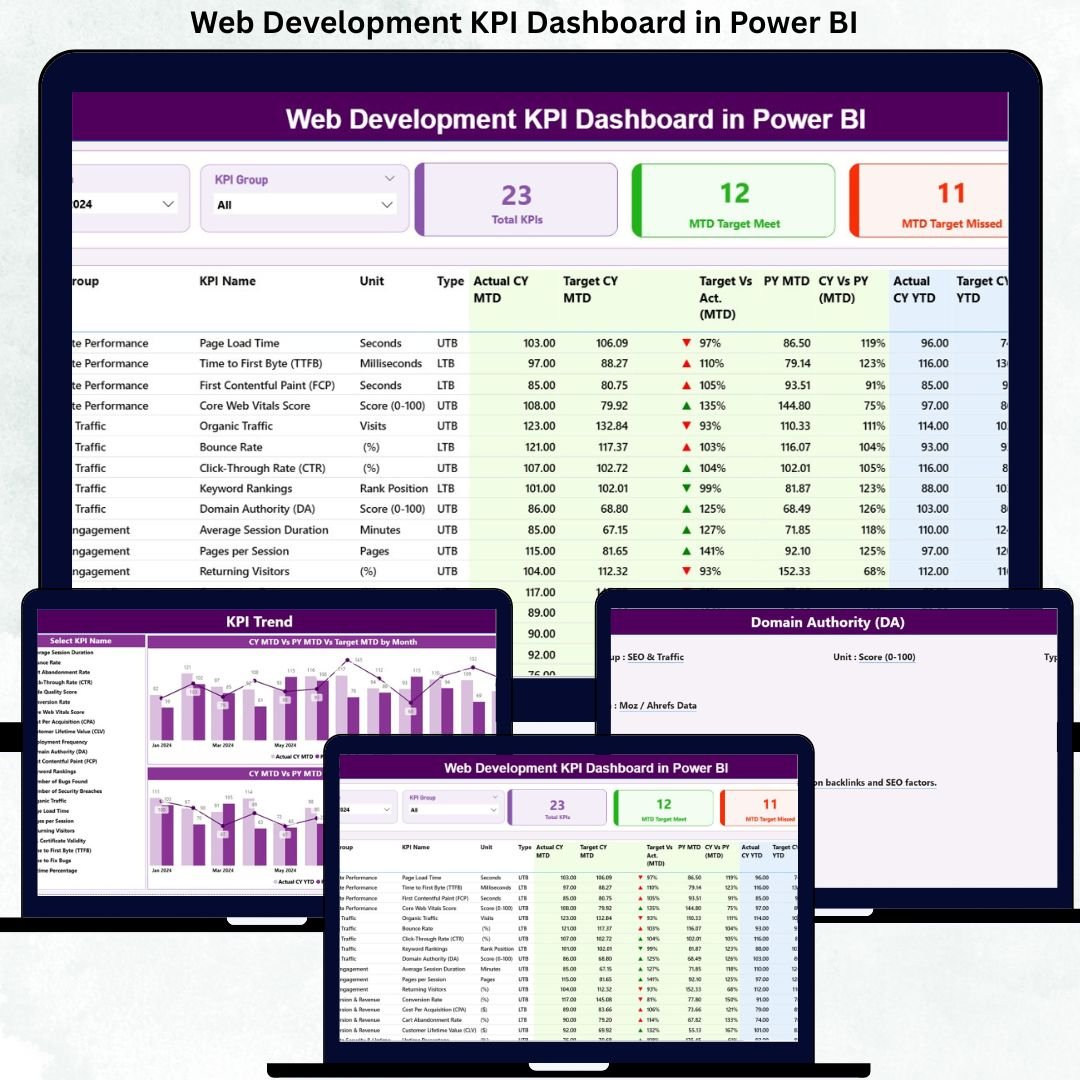
Web development teams handle multiple KPIs at the same time—delivery speed, quality, productivity, backlog resolution, and performance against targets. However, when these KPIs are tracked using scattered Excel sheets or static reports, teams struggle to understand real performance, identify gaps, and take timely action. That is exactly why the Web Development KPI Dashboard in Power BI becomes a powerful and practical performance management solution.
This ready-to-use Power BI dashboard helps organizations track, monitor, and compare web development KPIs using a structured, visual, and interactive approach. Instead of manually reviewing raw numbers, teams can instantly see which KPIs are meeting targets, which ones are lagging, and how performance compares against previous periods. As a result, decision-making becomes faster, clearer, and fully data-driven.
Because the dashboard uses Excel as the data source and Power BI for visualization, it remains flexible and easy to maintain. You simply update KPI actuals and targets in Excel, refresh the dashboard, and immediately view updated insights—without complex setup or advanced technical skills.
🔑 Key Features of Web Development KPI Dashboard in Power BI
💻 Centralized KPI Tracking – Monitor all web development KPIs in one interactive Power BI dashboard.
📊 MTD & YTD Performance Monitoring – Track short-term and long-term KPI performance effortlessly.
🎯 Target vs Actual Analysis – Instantly identify KPIs that meet or miss targets using visual indicators.
📈 CY vs PY Comparison – Compare current performance with previous year trends for better context.
🎛️ Dynamic Slicers – Filter insights by Month and KPI Group for focused analysis.
📂 What’s Inside the Web Development KPI Dashboard in Power BI
This professionally designed dashboard includes three structured and purpose-driven pages:
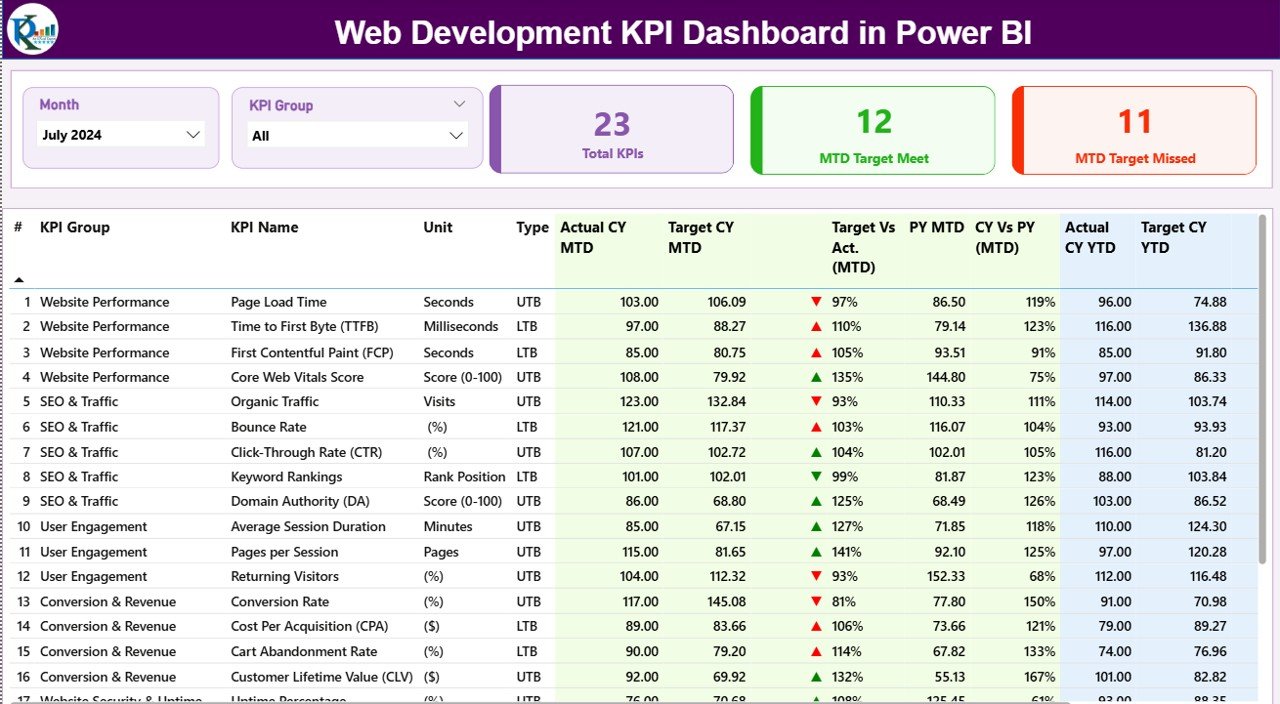
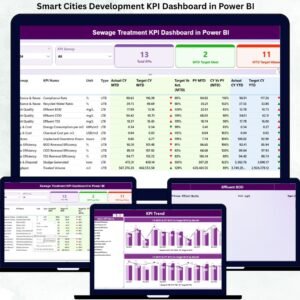
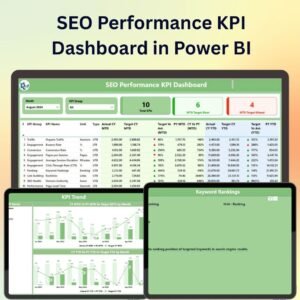
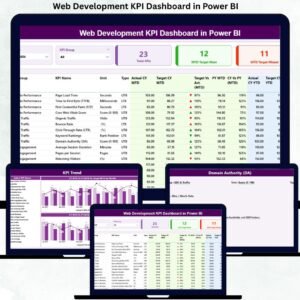
📌 Summary Page – The main control panel featuring Month and KPI Group slicers, three KPI cards (Total KPIs, MTD Target Met, MTD Target Missed), and a detailed KPI table covering MTD and YTD metrics, target comparisons, CY vs PY analysis, and visual status icons.
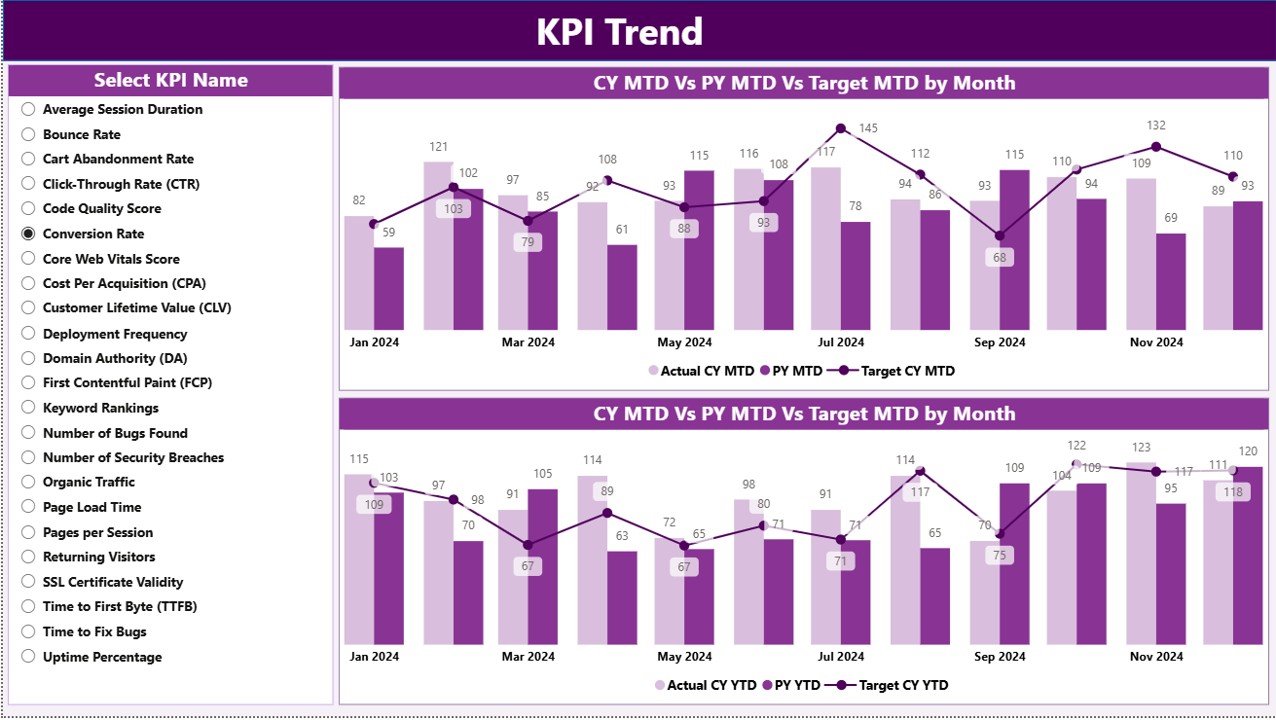
📈 KPI Trend Page – Displays two combo charts showing Actual CY, Previous Year, and Target values for both MTD and YTD. A KPI Name slicer allows focused trend analysis for individual KPIs.
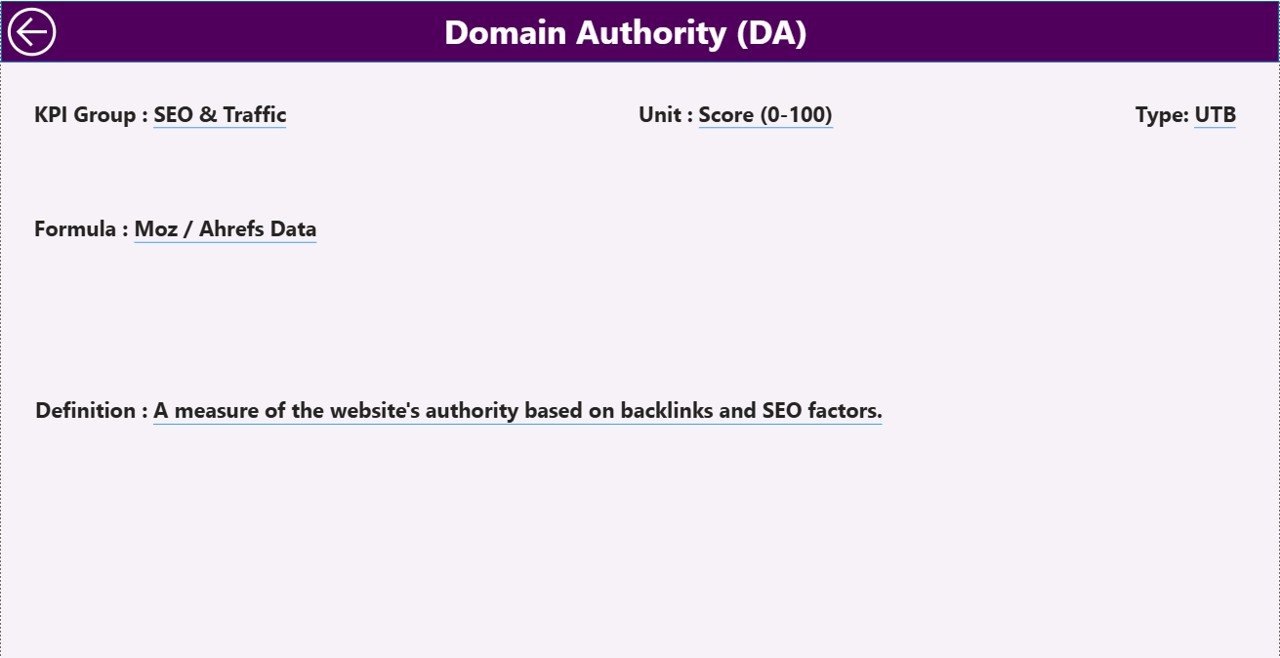
📘 KPI Definition Page – A hidden drill-through page that provides KPI Number, Group, Name, Unit, Formula, Definition, and Type (LTB/UTB). A back button allows easy navigation to the Summary Page.
▶️ How to Use the Web Development KPI Dashboard in Power BI
Using this dashboard is simple and user-friendly:
1️⃣ Enter actual KPI values in the Input_Actual Excel sheet (Month, MTD, and YTD).
2️⃣ Enter target KPI values in the Input_Target Excel sheet.
3️⃣ Maintain KPI details in the KPI Definition sheet.
4️⃣ Refresh the Power BI report to load updated data.
5️⃣ Use slicers, tables, and charts to analyze KPI performance instantly.
No advanced Power BI knowledge is required for end users.
👥 Who Can Benefit from This Web Development KPI Dashboard in Power BI
This dashboard is ideal for:
💼 Web Development Managers
📊 Project & Delivery Managers
🚀 Product Owners
📈 PMO & Leadership Teams
🧠 Business Analysts
🏢 IT & Digital Transformation Teams
Each stakeholder gains clarity, control, and confidence in KPI-driven decisions.
### 👉 Click here to read the Detailed Blog Post
Visit our YouTube channel to learn step-by-step video tutorials.


Reviews
There are no reviews yet.