
Aviation maintenance is not just about fixing aircraft—it is about ensuring safety, maximizing aircraft availability, meeting regulatory requirements, and protecting airline profitability. Aviation Maintenance KPI Dashboard in Power BI Even a minor delay in inspections or repairs can lead to grounded aircraft, disrupted schedules, and heavy financial losses. That is exactly why aviation organizations can no longer rely on manual logs, scattered spreadsheets, or delayed reports.
The Aviation Maintenance KPI Dashboard in Power BI is a powerful, ready-to-use analytics solution designed to help aviation teams monitor, analyze, and improve maintenance performance with confidence.
This dashboard transforms complex maintenance data into clear KPIs, trend visuals, and performance indicators. Instead of spending hours preparing reports, maintenance managers and leadership teams get instant visibility into what is working, what is not, and where action is required.
Built using Excel as the data source and Power BI for visualization, this dashboard remains easy to maintain, flexible to customize, and scalable for airlines, MROs, and aviation organizations of all sizes.
🚀 Key Features of Aviation Maintenance KPI Dashboard in Power BI
✅ Centralized Maintenance KPI Tracking – Monitor all maintenance KPIs from one unified dashboard
✅ MTD & YTD Performance Monitoring – Track short-term execution and long-term efficiency together
✅ Target vs Actual Analysis – Instantly identify missed inspections, delays, and performance gaps
✅ LTB & UTB KPI Classification – Clear evaluation for Lower-the-Better and Upper-the-Better KPIs
✅ Interactive Month & KPI Group Filters – Focus analysis in seconds
✅ Trend Analysis with Year-over-Year Comparison – Understand recurring issues and improvements
✅ Excel-Based Data Entry – Update data easily without advanced Power BI skills
✅ Drill-Through KPI Definitions – Improve transparency and avoid KPI misinterpretation
📦 What’s Inside the Aviation Maintenance KPI Dashboard in Power BI
This digital product includes a professionally designed Power BI file connected to a structured Excel data model.
📊 Power BI Pages Included
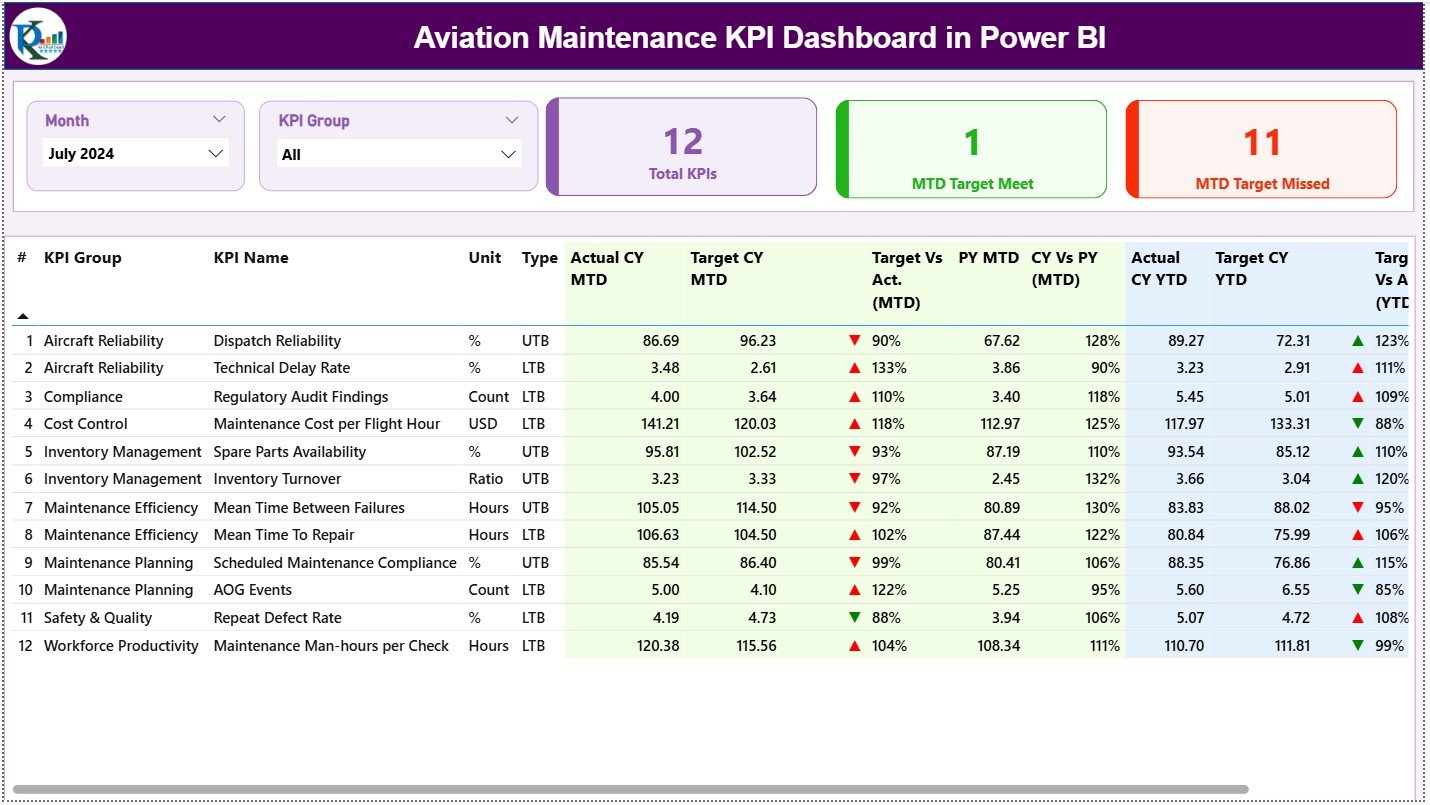
✈️ Summary Page
-
Month and KPI Group slicers
-
KPI cards showing Total KPIs, MTD Target Met, and MTD Target Missed
-
Detailed KPI table with MTD and YTD analysis
-
Visual indicators for quick performance status
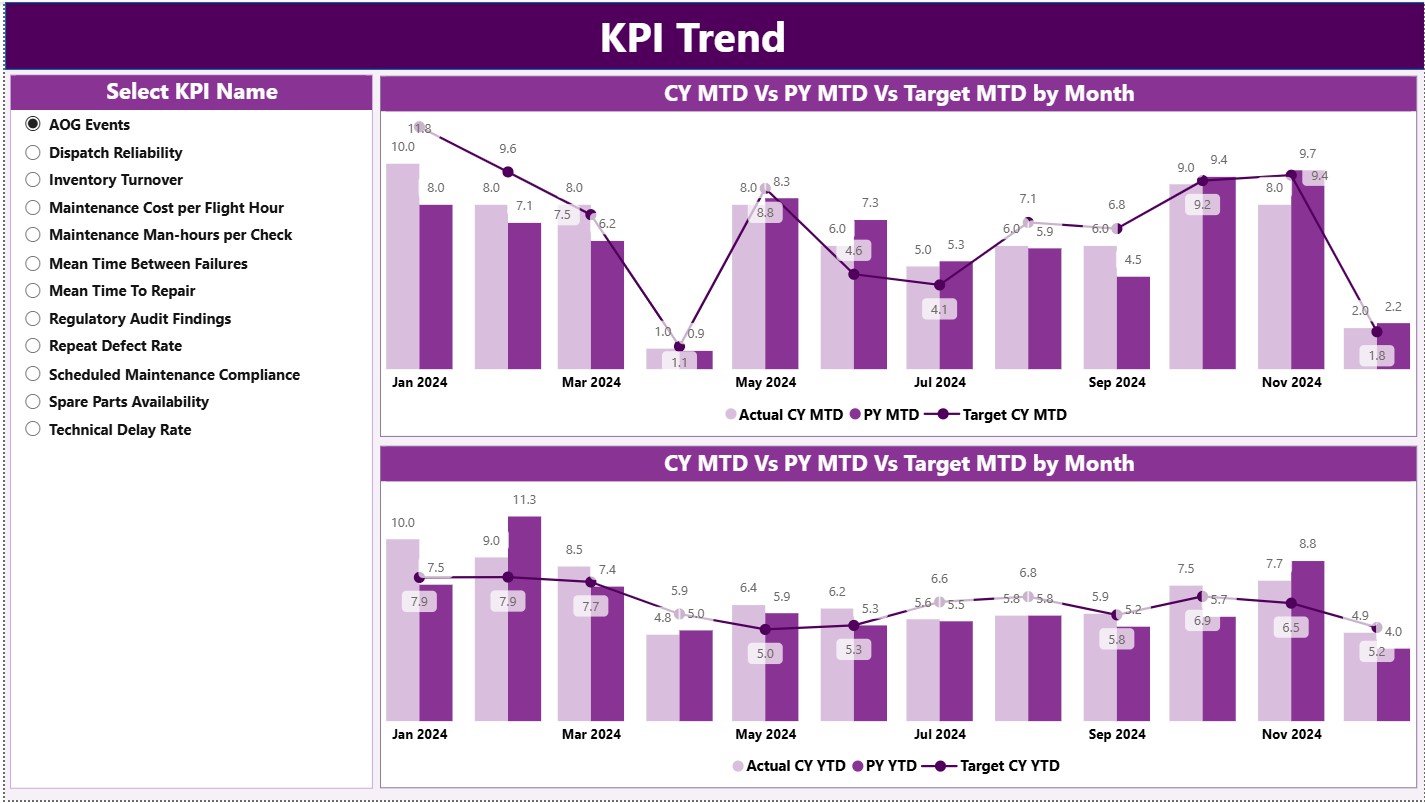
📈 KPI Trend Page
-
MTD trend combo chart
-
YTD trend combo chart
-
KPI selector to analyze individual maintenance KPIs over time
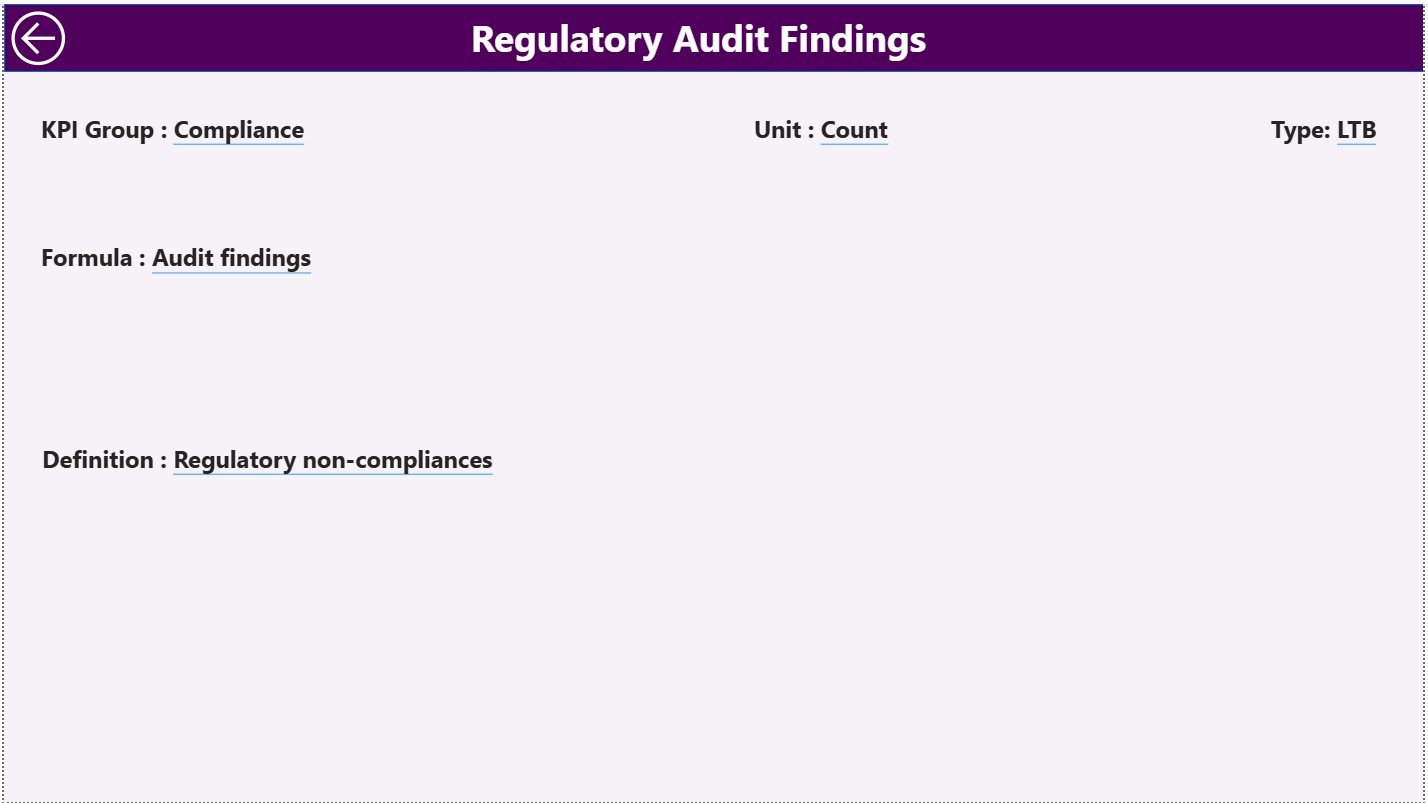
📘 KPI Definition (Drill-Through) Page
-
KPI Formula
-
KPI Definition
-
KPI Type (LTB / UTB)
-
Ensures clarity, consistency, and governance
📁 Excel Data Source Sheets
📌 Input Actual Sheet – Actual maintenance MTD and YTD values
📌 Input Target Sheet – Target maintenance performance values
📌 KPI Definition Sheet – KPI number, group, unit, formula, and type
🧭 How to Use the Aviation Maintenance KPI Dashboard in Power BI
Using this dashboard is simple and efficient:
1️⃣ Enter actual maintenance performance data in the Input Actual Excel sheet
2️⃣ Update target values in the Input Target sheet
3️⃣ Define or modify KPIs in the KPI Definition sheet
4️⃣ Refresh the Power BI file
5️⃣ Analyze maintenance performance using slicers, tables, and charts
No complex modeling or advanced Power BI knowledge is required.
👥 Who Can Benefit from This Aviation Maintenance KPI Dashboard in Power BI
✈️ Aviation Maintenance Managers – Monitor inspections, repairs, and performance gaps
🛠️ Aircraft Engineers – Track maintenance efficiency and recurring issues
📅 Maintenance Planners – Improve scheduling and resource allocation
📊 Operations Analysts – Analyze trends and performance drivers
🏢 Airline & MRO Leadership Teams – Make fast, data-driven decisions
This dashboard adapts easily to airlines, MRO providers, and aviation maintenance teams of any scale.
📖 Click here to read the Detailed blog post
📺 Visit our YouTube channel to learn step-by-step video tutorials


Reviews
There are no reviews yet.