
Modern marketing no longer depends on a single channel. Today’s businesses engage customers through email campaigns, social media platforms, paid ads, websites, mobile apps, and offline campaigns. However, when marketing data remains scattered across different tools and platforms, teams struggle to understand what is working and what is not. As a result, performance visibility reduces, decision-making slows down, and marketing budgets often get wasted.
That is exactly where the Multichannel Marketing KPI Dashboard in Google Sheets becomes a powerful and practical solution.
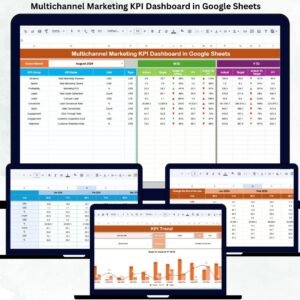
This ready-to-use dashboard brings all your marketing KPIs into one centralized, interactive, and easy-to-use Google Sheets dashboard. Instead of switching between multiple tools and reports, marketing teams can instantly track performance, compare channels, monitor targets, and improve ROI—all from one place.
Because the dashboard is built in Google Sheets, it remains cloud-based, collaborative, flexible, and cost-effective. You do not need expensive BI tools or technical expertise. Simply update the data, select a month, and the dashboard automatically refreshes with real-time insights.

🚀 Key Features of the Multichannel Marketing KPI Dashboard
-
📊 Centralized tracking of all marketing channels
-
📅 Dynamic month selection with automatic updates
-
🎯 MTD, YTD, Target & Previous Year comparisons
-
📈 KPI trend analysis for performance monitoring
-
🔽 Visual performance indicators (up/down arrows)
-
🔍 Clear KPI definitions for consistency
-
🤝 Real-time collaboration in Google Sheets
-
⚙️ Fully customizable structure
📦 What’s Inside the Multichannel Marketing KPI Dashboard
The dashboard is designed with 6 structured worksheet tabs, each serving a specific purpose.
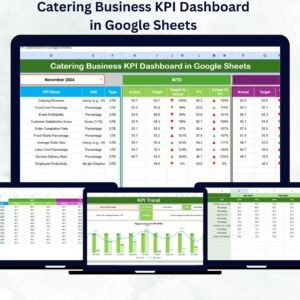
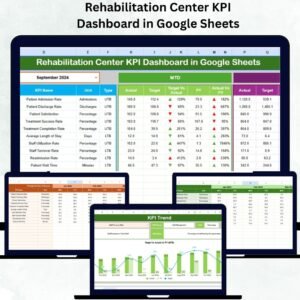
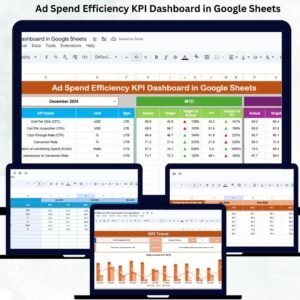
🧩 Dashboard Sheet Tab (Main Dashboard)
This is the central performance view.
You select a month from cell D3, and the entire dashboard updates automatically.
Displayed Metrics Include:
-
MTD Actual, Target & Previous Year
-
Target vs Actual
-
Previous Year vs Actual
-
YTD Actual, Target & Previous Year
-
Performance indicators using arrows
This sheet helps leadership understand marketing performance within seconds.
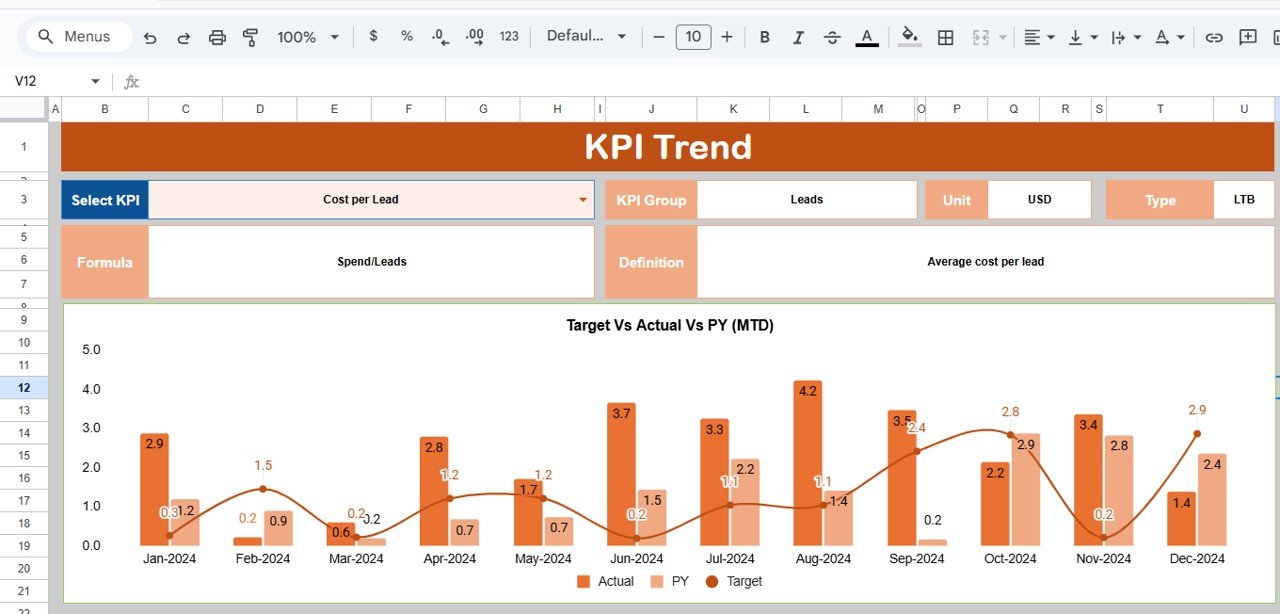
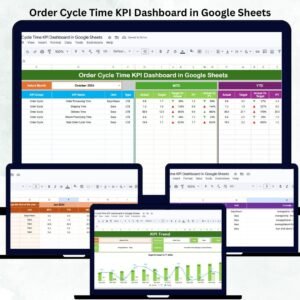
📉 KPI Trend Sheet Tab
This sheet allows deep analysis of individual KPIs.
You select a KPI from cell C3, and the sheet displays:
-
KPI Group
-
Unit of Measurement
-
KPI Type (Upper the Better / Lower the Better)
-
KPI Formula
-
KPI Definition
-
Monthly trend chart
This makes it easy to analyze seasonality, growth patterns, and performance gaps.
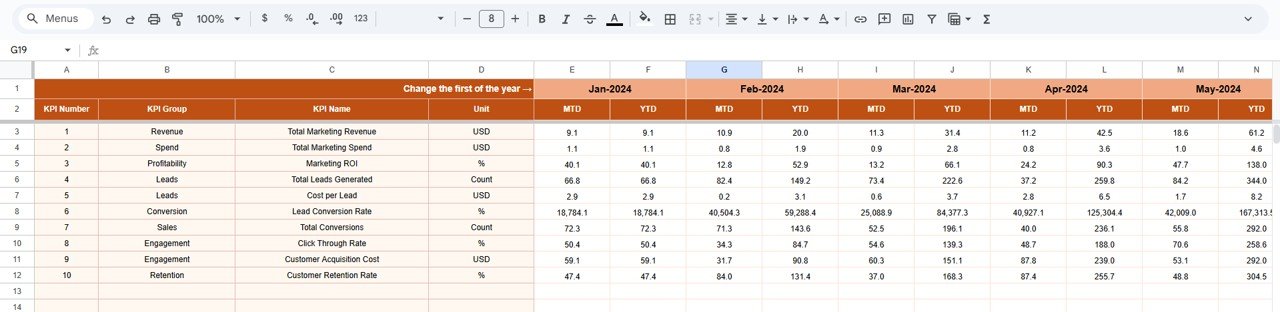
🧮 Actual Number Sheet Tab
This sheet stores all actual MTD and YTD values.
-
Select the first month of the year in cell E1
-
Enter actual performance values
-
All dashboards update automatically
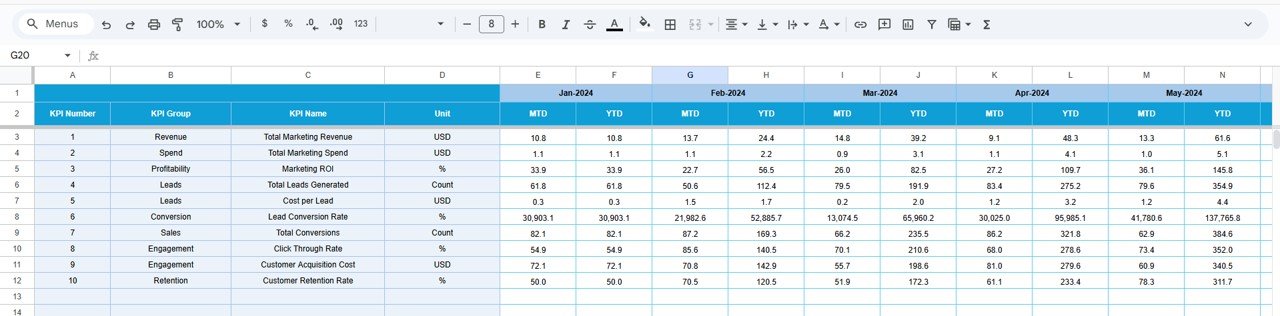
🎯 Target Sheet Tab
This sheet stores:
-
Monthly targets (MTD)
-
Annual targets (YTD)
Targets help marketing teams measure expectations against real results.
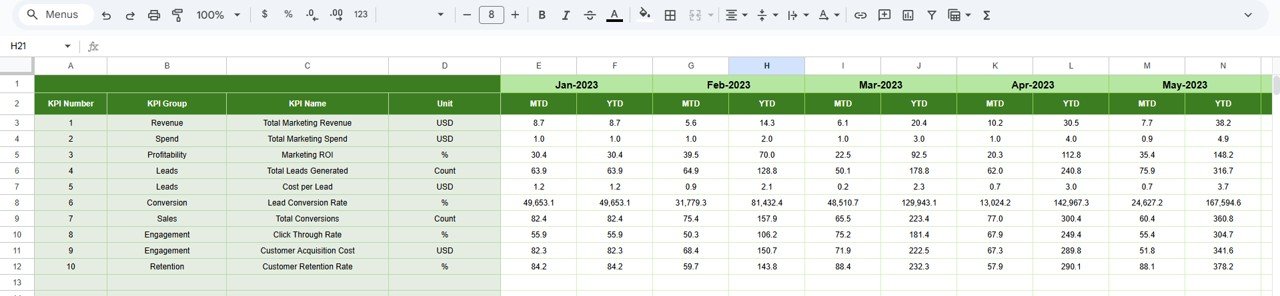
⏮️ Previous Year Number Sheet Tab
This sheet contains last year’s KPI values.
It enables:
-
Year-over-year comparison
-
Growth trend analysis
-
Long-term performance tracking
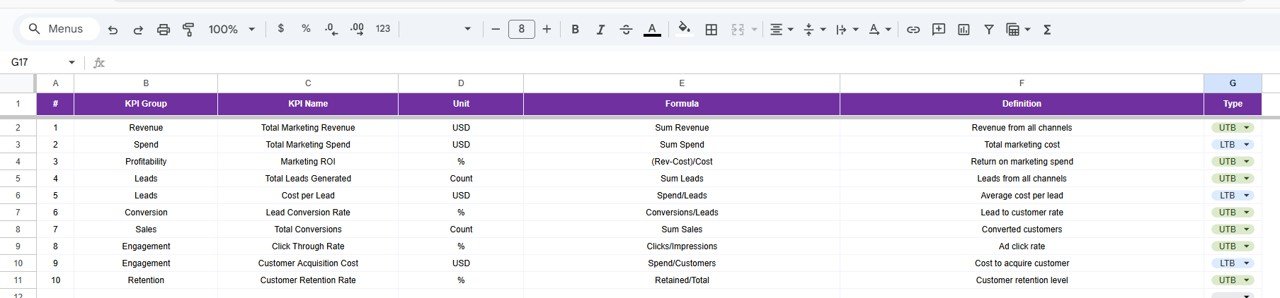
📘 KPI Definition Sheet Tab
This is the control and reference sheet containing:
-
KPI Name
-
KPI Group
-
Unit
-
Formula
-
Definition
-
KPI Type (UTB / LTB)
It ensures clarity, standardization, and alignment across teams.
🛠️ How to Use the Multichannel Marketing KPI Dashboard
1️⃣ Update monthly marketing data
2️⃣ Select the month from the dropdown
3️⃣ Review MTD and YTD performance
4️⃣ Compare targets vs actuals
5️⃣ Analyze trends using KPI Trend Sheet
6️⃣ Optimize channel strategy based on insights
👥 Who Can Benefit from This Dashboard
-
📢 Marketing Managers
-
🚀 Growth & Performance Teams
-
📊 Digital Marketing Analysts
-
🧠 CMOs & Marketing Heads
-
🏢 Business Owners & Founders
### Click here to read the Detailed blog post
Watch the step-by-step video tutorial:


Reviews
There are no reviews yet.