


In the fast-paced world of travel retail, gut feeling is no longer enough. Duty-free stores operate in high-pressure environments where every passenger, minute, and square foot matters. To stay ahead, you need real-time visibility, performance clarity, and data-driven confidence. Duty-Free Retail KPI Dashboard in Power BI That is exactly what the Duty-Free Retail KPI Dashboard in Power BI delivers.
Duty-Free Retail KPI Dashboard in Power BI This professionally designed Power BI dashboard transforms raw Excel data into clear, interactive, and actionable insights. Instead of juggling spreadsheets or static reports, you get a centralized KPI control center that shows what is working, what is failing, and where to act next—instantly.
🚀 Key Features of Duty-Free Retail KPI Dashboard in Power BI
✅ Interactive Power BI Dashboard – Analyze KPIs using dynamic visuals instead of static tables
📅 Month & KPI Group Slicers – Filter performance instantly by period and category
🎯 MTD & YTD Performance Tracking – Monitor short-term and long-term performance together
📊 Target vs Actual Analysis – Identify gaps and achievements at a glance
🔁 Current Year vs Previous Year Comparison – Track true business growth accurately
⬆️⬇️ Visual Performance Indicators – Green/red icons highlight success or risk instantly
📘 Drill-Through KPI Definitions – Understand every KPI without leaving the dashboard
📂 Excel-Based Data Source – Easy to update, flexible, and business-friendly
📦 What’s Inside the Duty-Free Retail KPI Dashboard
This Power BI product includes a three-page, professionally structured dashboard, built specifically for duty-free retail operations.
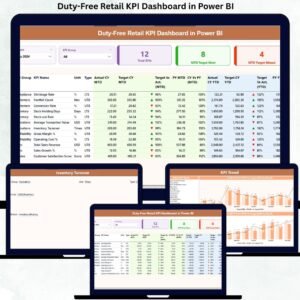
🔹 Summary Page

Acts as the main control center. It displays:
-
Total KPIs Count
-
MTD Target Met Count
-
MTD Target Missed Count
-
A detailed KPI table with MTD & YTD Actuals, Targets, Previous Year values, and percentage comparisons
🔹 KPI Trend Page
Designed for deep analysis using:
-
MTD Trend Combo Chart
-
YTD Trend Combo Chart
-
Current Year vs Previous Year vs Target visualization
🔹 KPI Definition Page (Drill-Through)
Provides:
-
KPI Formula
-
KPI Definition
-
Unit, Group, and Type (LTB / UTB)
-
Easy navigation back to Summary Page
Together, these pages ensure clarity, transparency, and confidence in every decision.
🛠️ How to Use the Duty-Free Retail KPI Dashboard
Using this dashboard is simple—even for non-technical users.
1️⃣ Enter Actual KPI values in the Input Actual Excel sheet
2️⃣ Update Targets in the Input Target Excel sheet
3️⃣ Maintain KPI details in the KPI Definition sheet
4️⃣ Refresh Power BI to update all visuals automatically
5️⃣ Use slicers, tables, and charts to analyze performance
Because Excel is the data source, updates remain quick, controlled, and scalable.
👥 Who Can Benefit from This Duty-Free Retail KPI Dashboard?
This dashboard is ideal for:
✈️ Duty-Free Retail Managers
🏬 Airport Retail Operations Teams
📈 Sales & Commercial Heads
📊 Business Analysts & MIS Teams
💼 Retail Strategy & Planning Teams
🌍 Multi-location Travel Retail Businesses
If you need accurate KPI tracking, faster decisions, and better performance control, this dashboard is built for you.
🔎 Click here to read the Detailed blog post
👉 Visit our YouTube channel to learn step-by-step video tutorials


Reviews
There are no reviews yet.