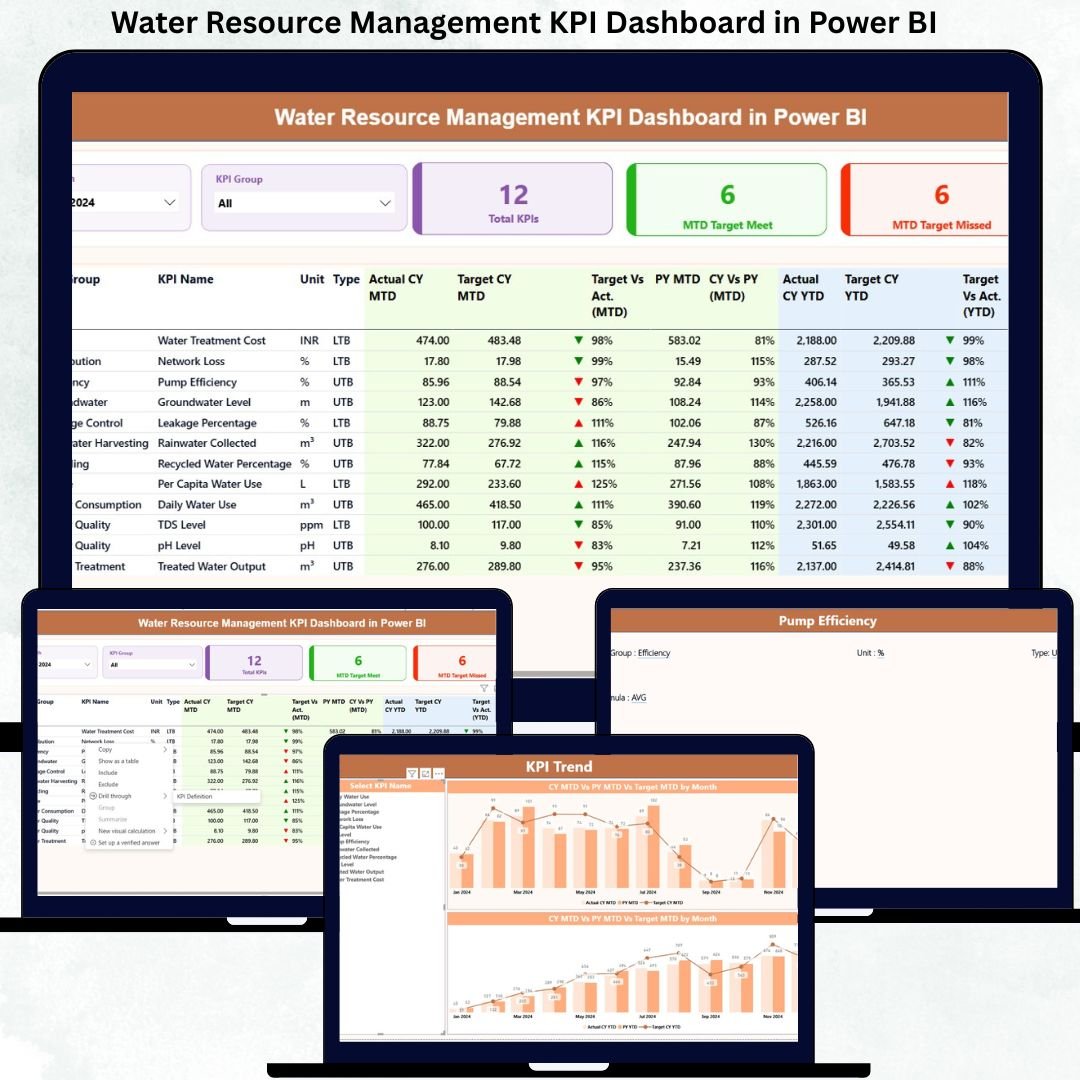
Managing water resources efficiently is no longer optional—it is a business, sustainability, and compliance necessity. Organizations that rely on scattered Excel files, static reports, or manual tracking often miss early warning signs of water losses, inefficiencies, and target deviations. That is exactly why the Water Resource Management KPI Dashboard in Power BI is designed—to give you complete visibility, control, and actionable insights from one powerful dashboard.
This ready-to-use Power BI dashboard converts raw water data into clear KPIs, trend analysis, and performance comparisons, helping organizations make faster, smarter, and more responsible water management decisions. Built with Excel as the data source, it ensures simplicity, flexibility, and easy customization without complex system integrations.
🚀 Key Features of Water Resource Management KPI Dashboard in Power BI
📊 Centralized KPI Monitoring – Track all water-related KPIs from a single interactive dashboard
📅 MTD & YTD Performance Tracking – Instantly compare Month-to-Date and Year-to-Date results
🎯 Target vs Actual Analysis – Identify gaps using automatic variance calculations
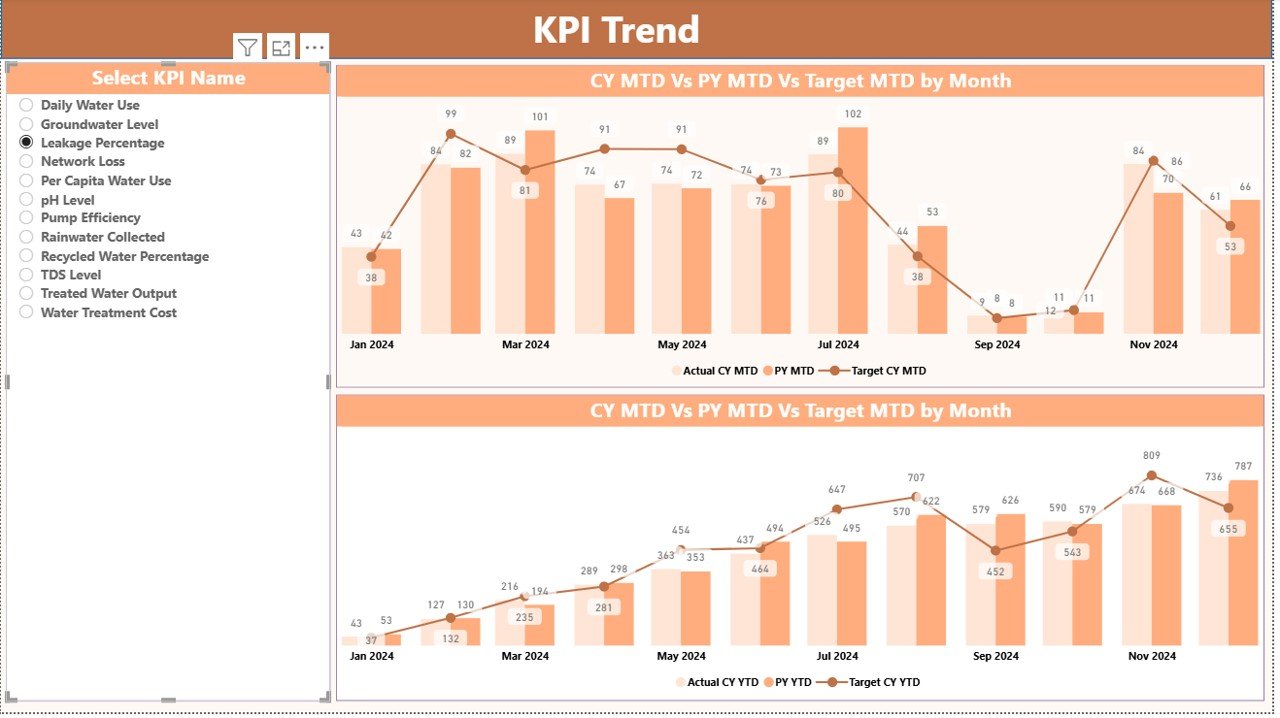
📈 Trend Analysis with Visuals – Compare current year, previous year, and targets
🔎 Interactive Slicers – Filter data by Month and KPI Group for focused analysis
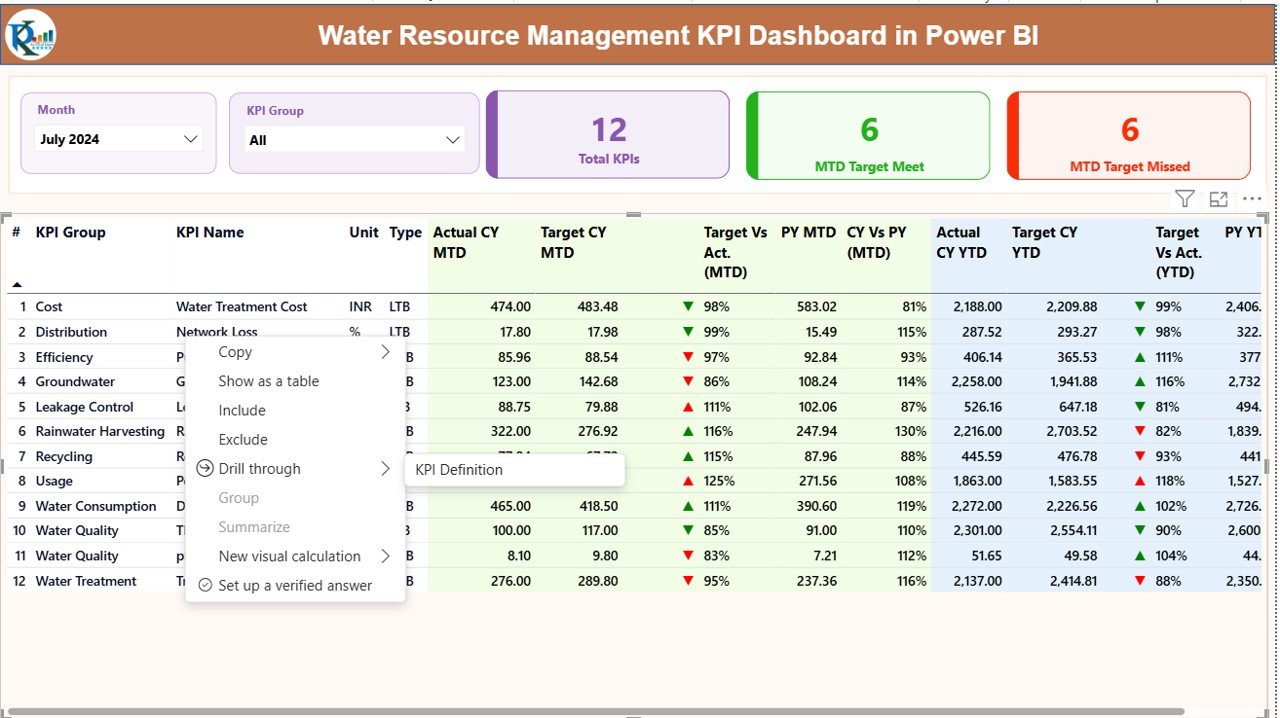
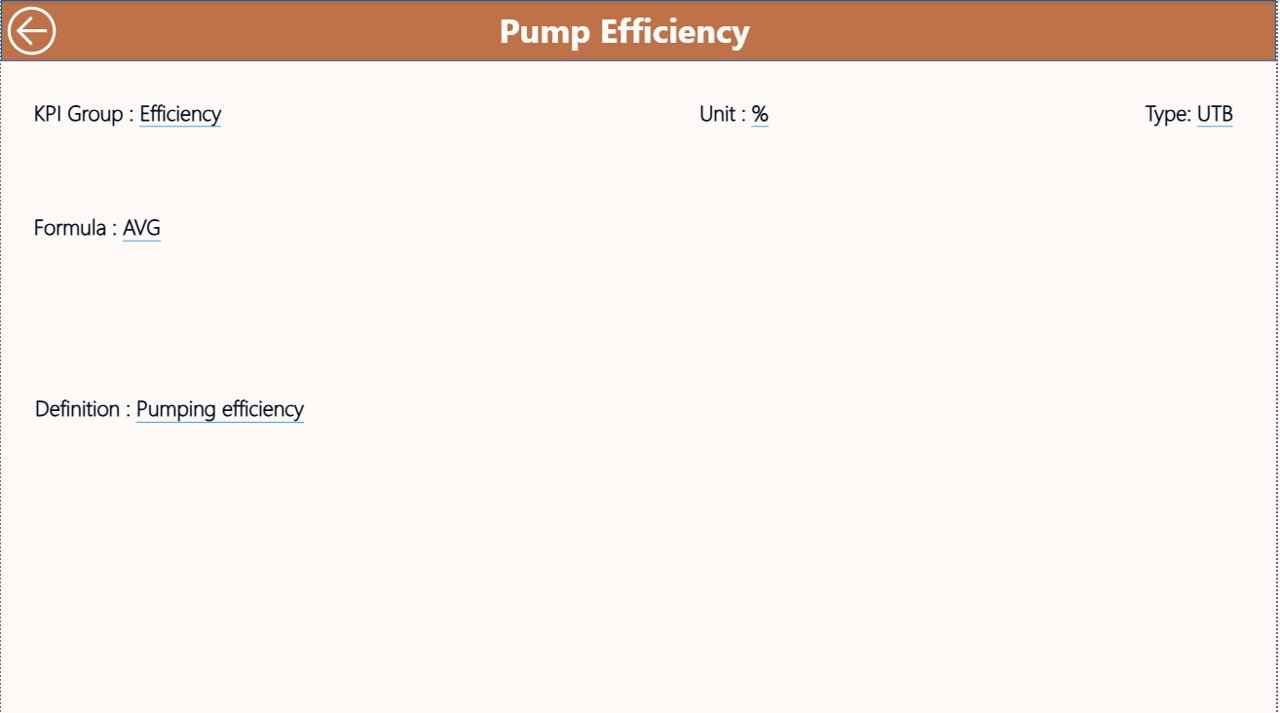
🧠 Drill-Through KPI Definitions – Understand formulas, definitions, and KPI types instantly
🟢🔴 Visual Performance Indicators – Green and red icons highlight target achievement
📂 Excel-Based Data Input – Easy to maintain without technical expertise
📦 What’s Inside the Water Resource Management KPI Dashboard
This digital product includes a professionally designed Power BI dashboard supported by a structured Excel data model.
Power BI Dashboard Pages
-
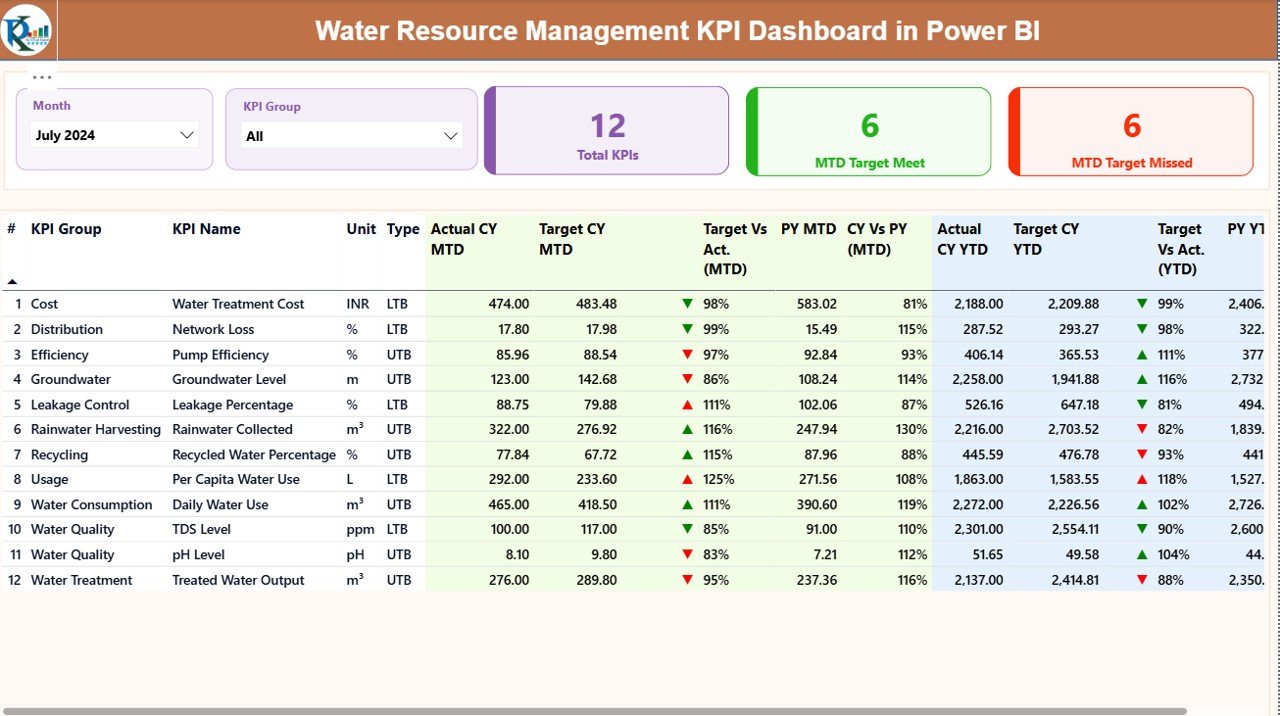
Summary Page – High-level performance view with KPI cards and detailed KPI table
-
KPI Trend Page – MTD and YTD trend charts comparing Actual, Target, and Previous Year
-
KPI Definition Page – Drill-through page showing KPI formula, definition, and type
Excel Data Input Sheets
-
Input_Actual – Enter monthly MTD and YTD actual values
-
Input_Target – Define monthly MTD and YTD targets
-
KPI Definition – Maintain KPI structure, units, formulas, and types
All calculations, comparisons, and visuals update automatically once the data is refreshed.
🛠️ How to Use the Water Resource Management KPI Dashboard
Using this dashboard is simple and user-friendly:
1️⃣ Enter KPI definitions in the KPI Definition sheet
2️⃣ Update monthly data in Input_Actual and Input_Target
3️⃣ Refresh the Power BI dashboard
4️⃣ Use slicers to analyze KPIs by Month and KPI Group
5️⃣ Review MTD, YTD, Target vs Actual, and Previous Year performance
6️⃣ Drill through KPIs to understand formulas and definitions
No advanced Power BI or technical skills are required.
👥 Who Can Benefit from This Water Resource Management KPI Dashboard
This dashboard is ideal for:
🏭 Manufacturing Plants – Monitor consumption, losses, and efficiency
🏙️ Municipal Corporations – Track water supply and leakage KPIs
💧 Water Utilities – Improve operational performance and compliance
🌱 Sustainability Teams – Measure water efficiency and environmental impact
🏢 Facility Managers – Control departmental water usage
📋 Compliance & Environmental Officers – Support regulatory reporting
📊 Leadership & Decision-Makers – Enable data-driven water strategies
Any organization managing water resources can use this dashboard effectively.
Click here to read the Detailed Blog Post
Watch the step-by-step video tutorial:
Visit our YouTube channel to learn step-by-step video tutorials
<a href=”https://youtube.com/@PKAnExcelExpert” target=”_blank”>YouTube.com/@PKAnExcelExpert</a>


Reviews
There are no reviews yet.