Managing seed and fertilizer manufacturing operations without clear performance visibility often leads to production delays, cost overruns, quality issues, and missed targets. When data is scattered across Excel files or static reports, managers struggle to identify problems early and take corrective action.
That is exactly where the Seed & Fertilizer Manufacturing KPI Dashboard in Power BI becomes a game-changing performance management solution.
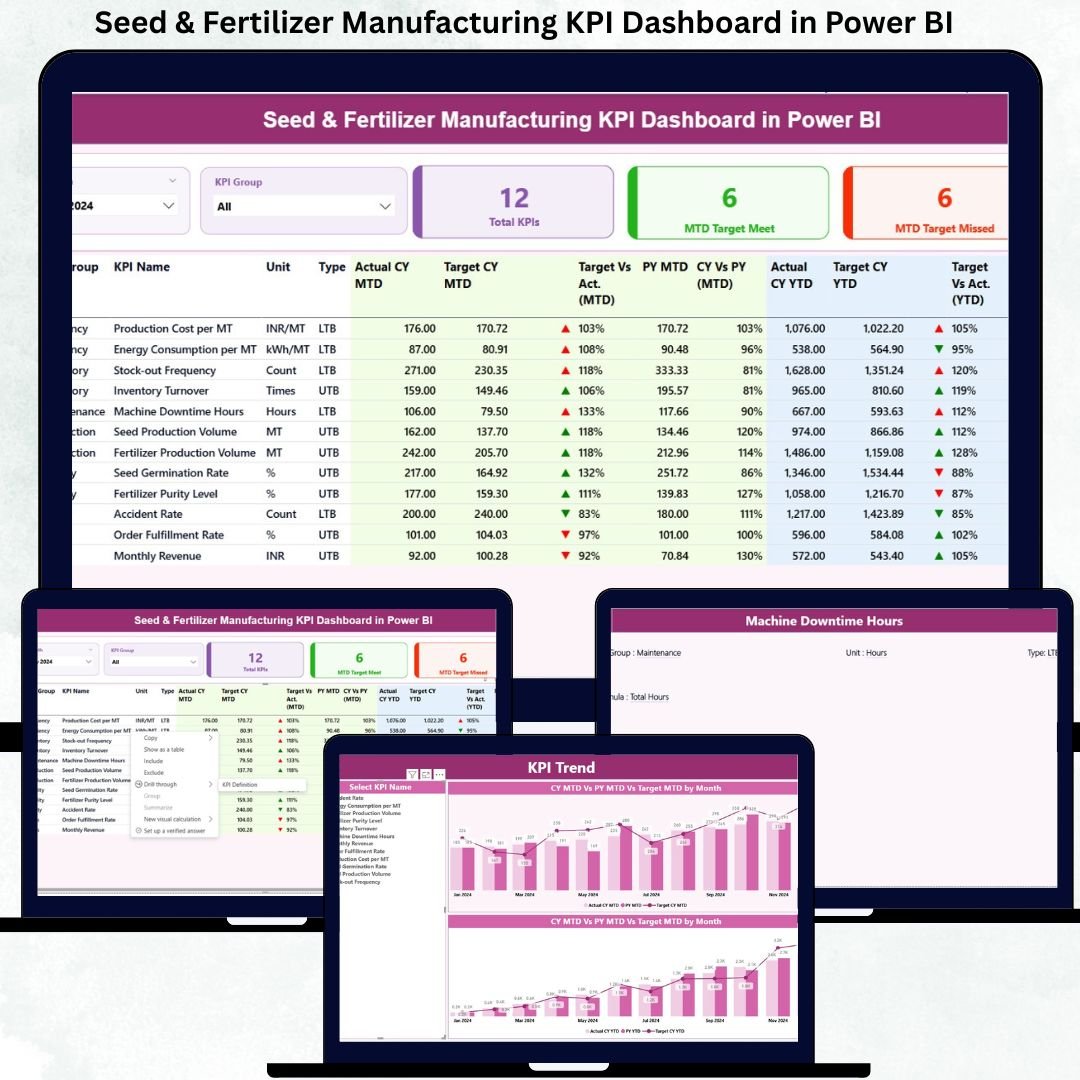
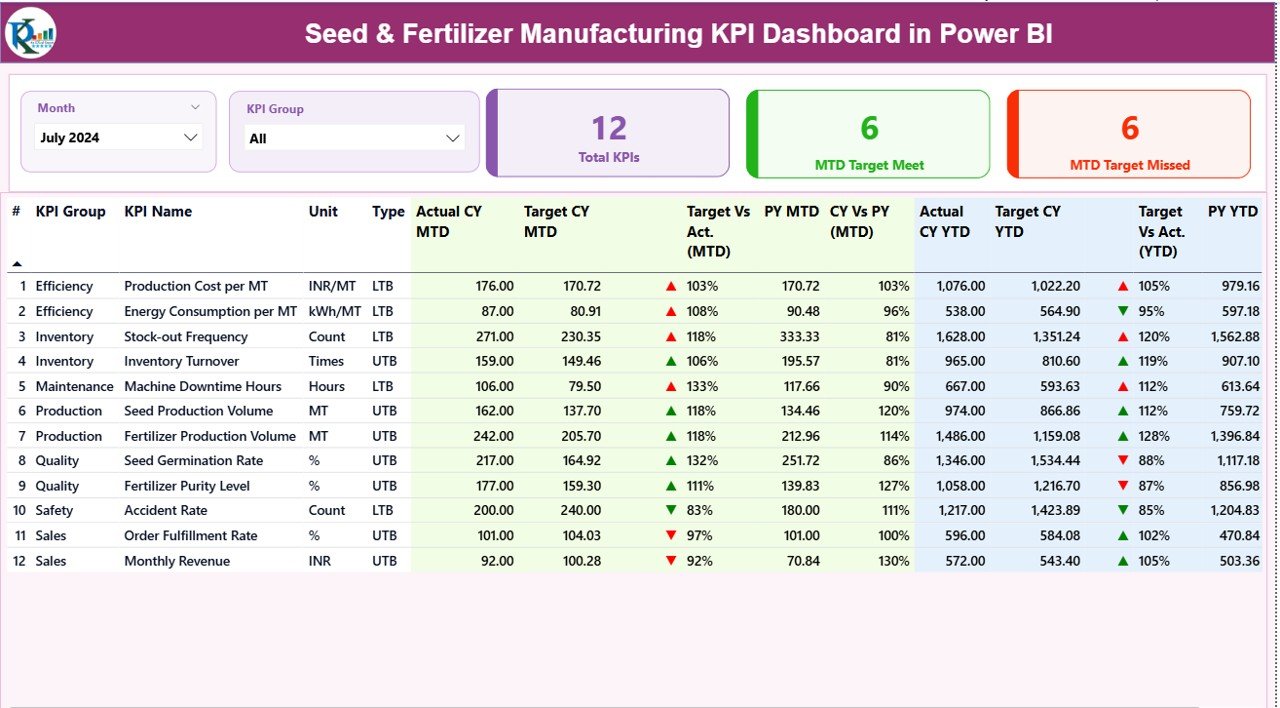
This professionally designed dashboard transforms raw operational data into clear KPIs, visual comparisons, and actionable insights. It allows manufacturing teams, plant managers, and leadership to monitor MTD, YTD, Target vs Actual, and Previous Year performance from a single interactive Power BI dashboard—without technical complexity.
Built using Power BI with Excel as the data source, this dashboard offers the perfect balance of simplicity, flexibility, and advanced analytics, making it ideal for seed and fertilizer manufacturing environments.
🚀 Key Features of Seed & Fertilizer Manufacturing KPI Dashboard in Power BI
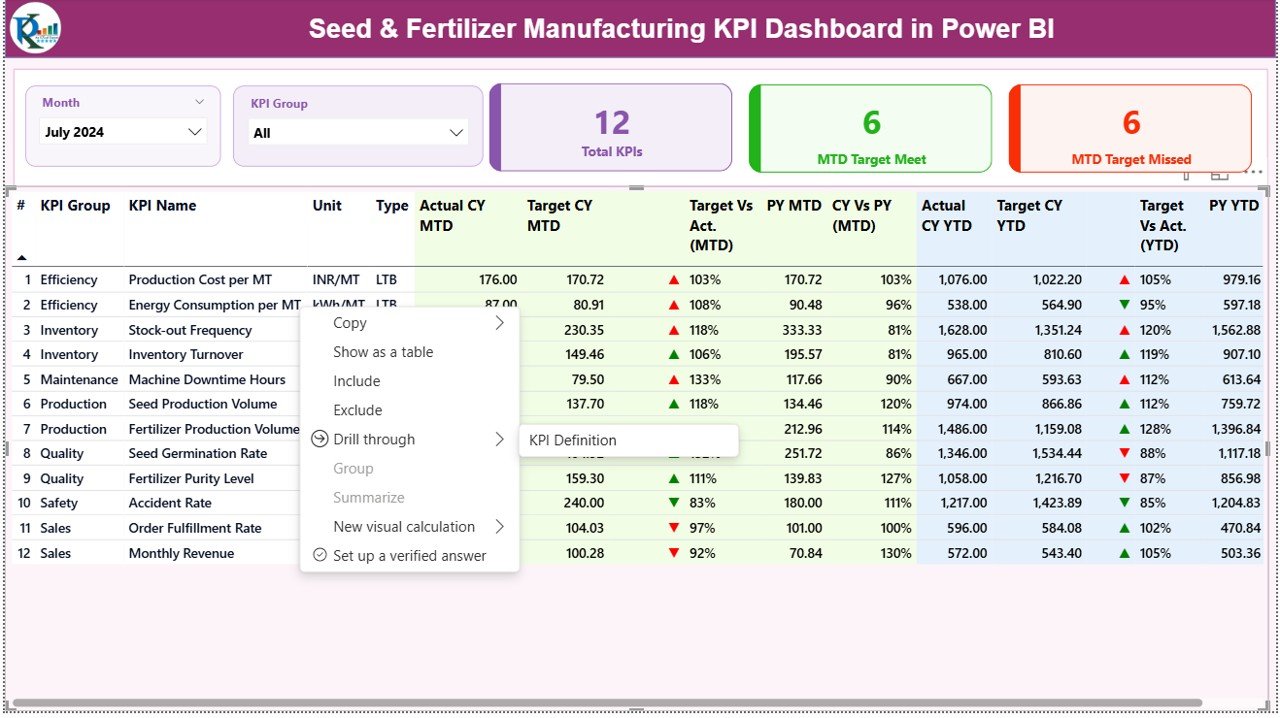
✅ Centralized KPI Monitoring – Track all critical manufacturing KPIs from one interactive Power BI dashboard
📊 MTD & YTD Performance Tracking – Monitor Monthly-to-Date and Year-to-Date performance instantly
🎯 Target vs Actual Comparison – Identify gaps with automatic variance calculations and visual indicators
📈 Previous Year Analysis – Compare current performance against last year to detect trends
🔍 Dynamic Slicers – Filter data by Month, KPI Group, and KPI Name for focused analysis
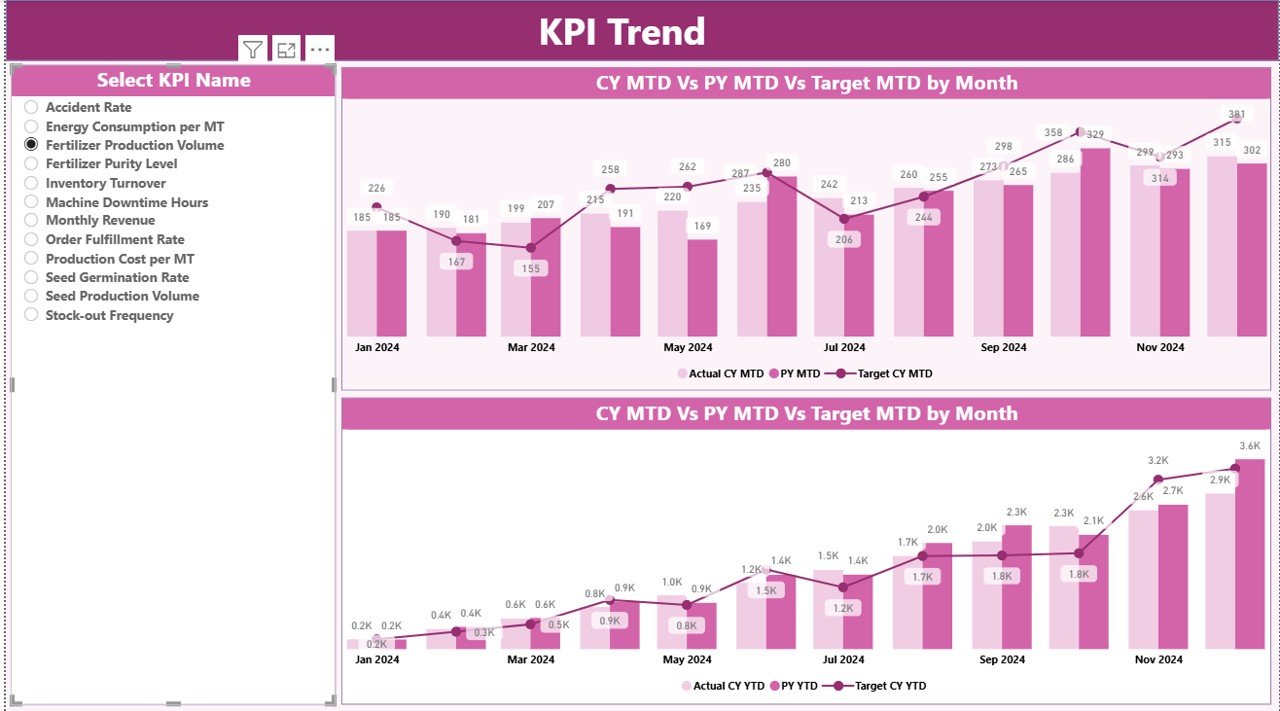
📉 Trend Analysis Charts – Visualize performance movement using MTD and YTD combo charts
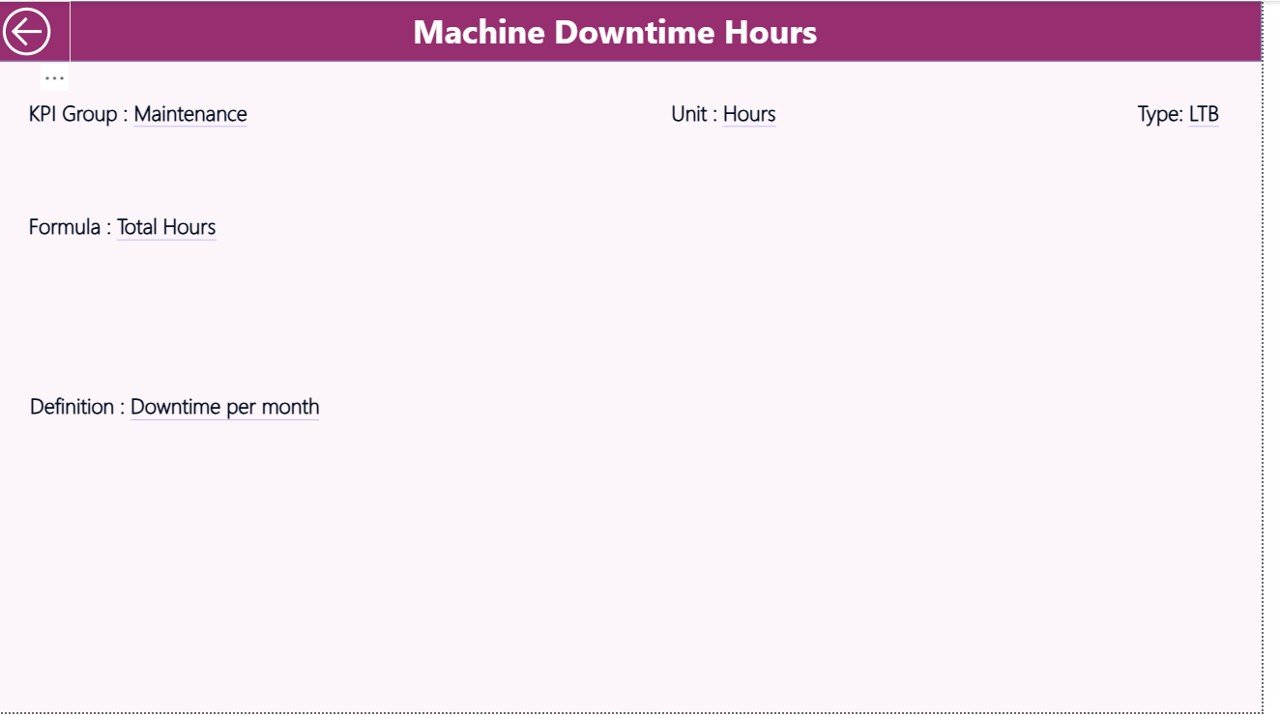
📘 KPI Definition Drill-Through – Ensure KPI clarity with formulas, definitions, and KPI types
📂 Excel-Based Data Input – Simple data entry with powerful Power BI visualization
📦 What’s Inside the Seed & Fertilizer Manufacturing KPI Dashboard
This digital product includes a Power BI dashboard file connected to a structured Excel data source.
Power BI Pages:
-
Summary Page – Overall performance snapshot with KPI cards and detailed KPI table
-
KPI Trend Page – MTD and YTD trend analysis with Actual, Target, and Previous Year comparison
-
KPI Definition Page – Drill-through page showing KPI formulas, units, definitions, and types
Excel Data Sheets:
-
Input_Actual – Enter MTD and YTD actual performance values
-
Input_Target – Define planned MTD and YTD target values
-
KPI Definition – Standardize KPI logic, units, formulas, and KPI types (LTB / UTB)
This structure ensures clean data flow, accurate reporting, and consistent KPI interpretation.
🛠️ How to Use the Seed & Fertilizer Manufacturing KPI Dashboard
Using this dashboard is simple and user-friendly:
1️⃣ Enter actual performance data in the Input_Actual Excel sheet
2️⃣ Update target values in the Input_Target sheet
3️⃣ Maintain KPI definitions in the KPI Definition sheet
4️⃣ Refresh the Power BI dashboard
5️⃣ Use slicers to analyze KPIs by month, group, or individual KPI
No advanced Power BI skills are required—basic refresh and slicer usage is enough.
👥 Who Can Benefit from This Dashboard
This dashboard is ideal for:
🏭 Manufacturing Managers – Monitor production efficiency and target achievement
🏢 Plant Heads – Track operational health at a glance
🔍 Quality Control Teams – Analyze yield, rejection rates, and process consistency
📦 Supply Chain Teams – Monitor inventory, fulfillment, and operational flow
💰 Finance & Cost Analysts – Track cost-related KPIs and efficiency metrics
📊 Senior Leadership – Make faster, data-driven decisions
Both mid-sized and large seed & fertilizer manufacturers can easily scale this dashboard.
Click here to read the Detailed Blog Post
Watch the step-by-step video tutorial:


Reviews
There are no reviews yet.