
Managing a dairy business today is more complex than ever. From milk procurement and production efficiency to quality control, energy costs, distribution, and profitability—every decision depends on accurate data. However, when performance data is scattered across Excel files, ERP exports, and manual reports, leaders struggle to see the full picture.
That is exactly where the Dairy Industry KPI Dashboard in Power BI becomes a game-changing solution.
This professionally designed, ready-to-use dashboard converts raw dairy data into clear, visual, and actionable insights. It helps dairy owners, plant managers, analysts, and executives monitor critical KPIs in real time and take faster, smarter, and data-driven decisions—all from one interactive Power BI file.
✅ Key Features of Dairy Industry KPI Dashboard in Power BI
📊 Centralized KPI Monitoring – Track production, quality, cost, sales, and profitability KPIs in a single dashboard
📅 MTD & YTD Performance Tracking – Monitor short-term and long-term performance effortlessly
🎯 Target vs Actual Analysis – Instantly identify target achievements and gaps
📈 Year-over-Year Comparison – Measure growth and improvement against previous years
🟢 Visual Status Indicators – Up/down arrows and color indicators highlight performance trends
🎛️ Interactive Slicers – Filter by Month and KPI Group for focused analysis
📉 Trend Analysis Charts – Identify improving or declining KPIs quickly
🧩 Excel-Based Data Source – Simple data entry with familiar Excel sheets
📦 What’s Inside the Dairy Industry KPI Dashboard
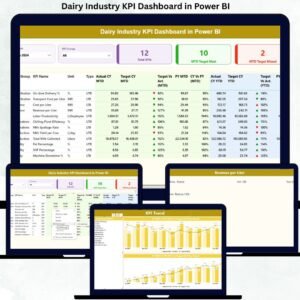
This digital product includes a fully structured Power BI dashboard with three powerful pages:
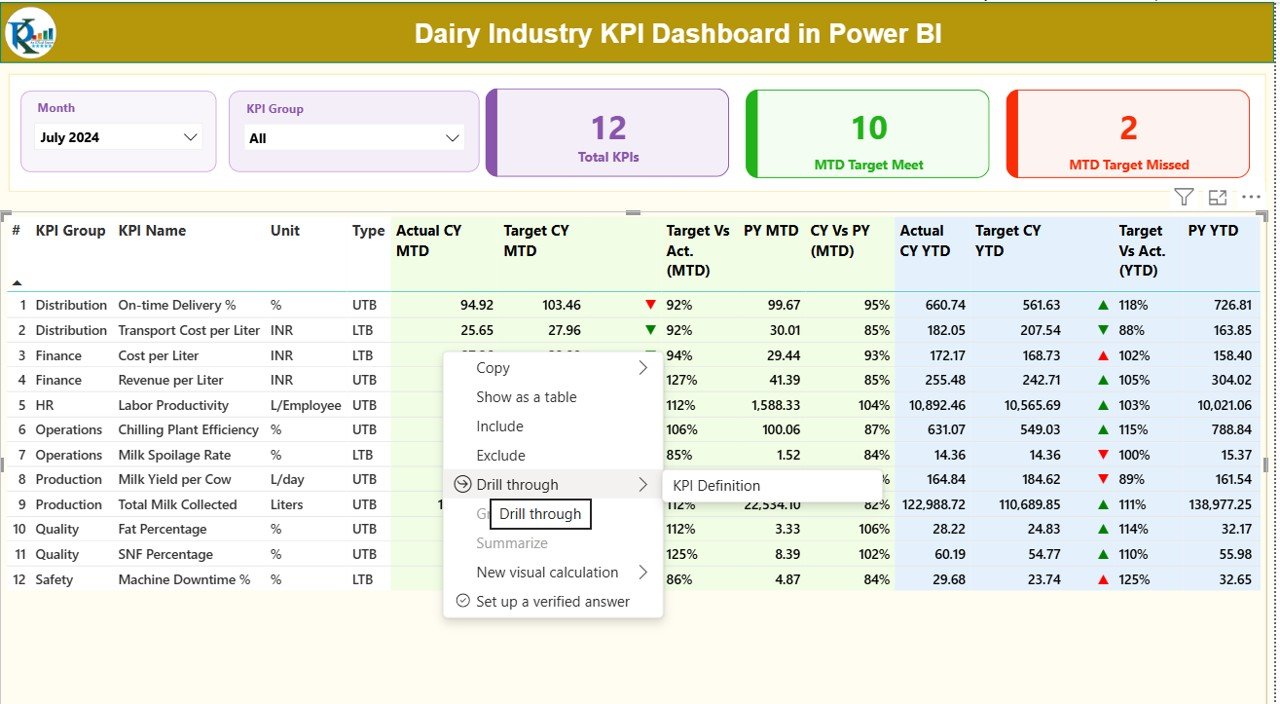
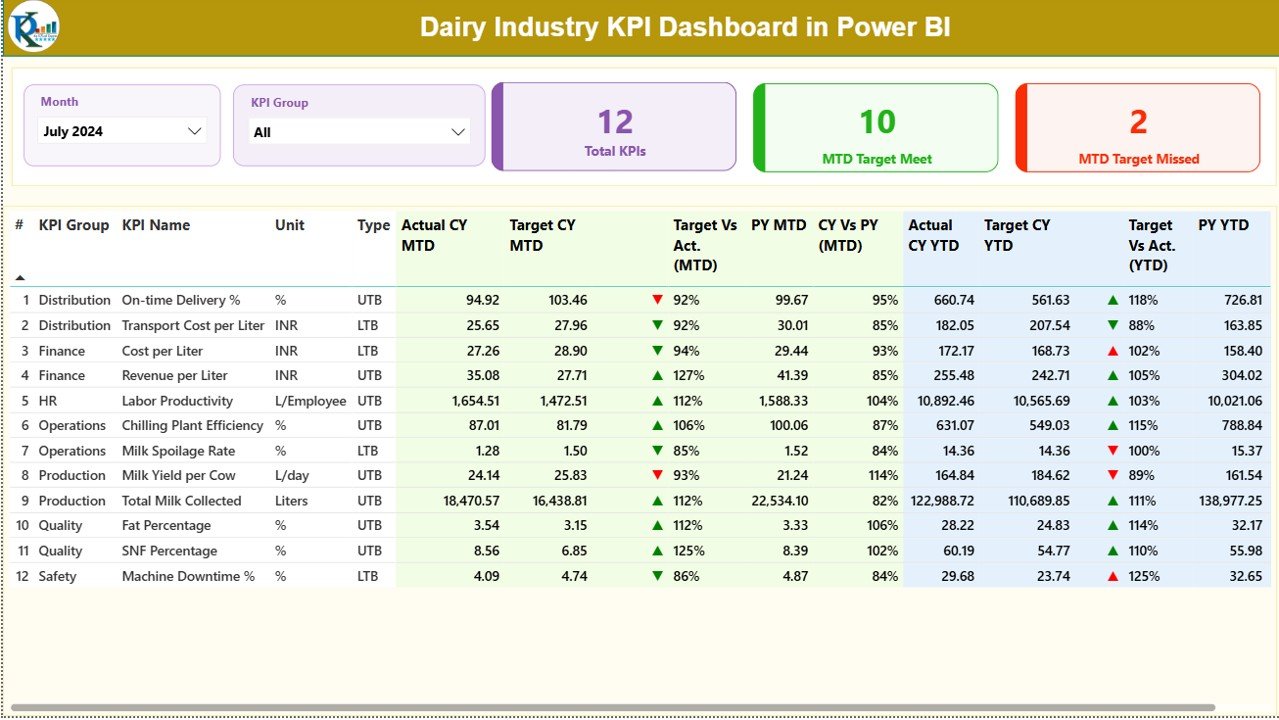
🔹 Summary Page
Acts as the command center of the dashboard with KPI cards, slicers, and a detailed KPI performance table showing MTD, YTD, targets, and previous year comparisons.
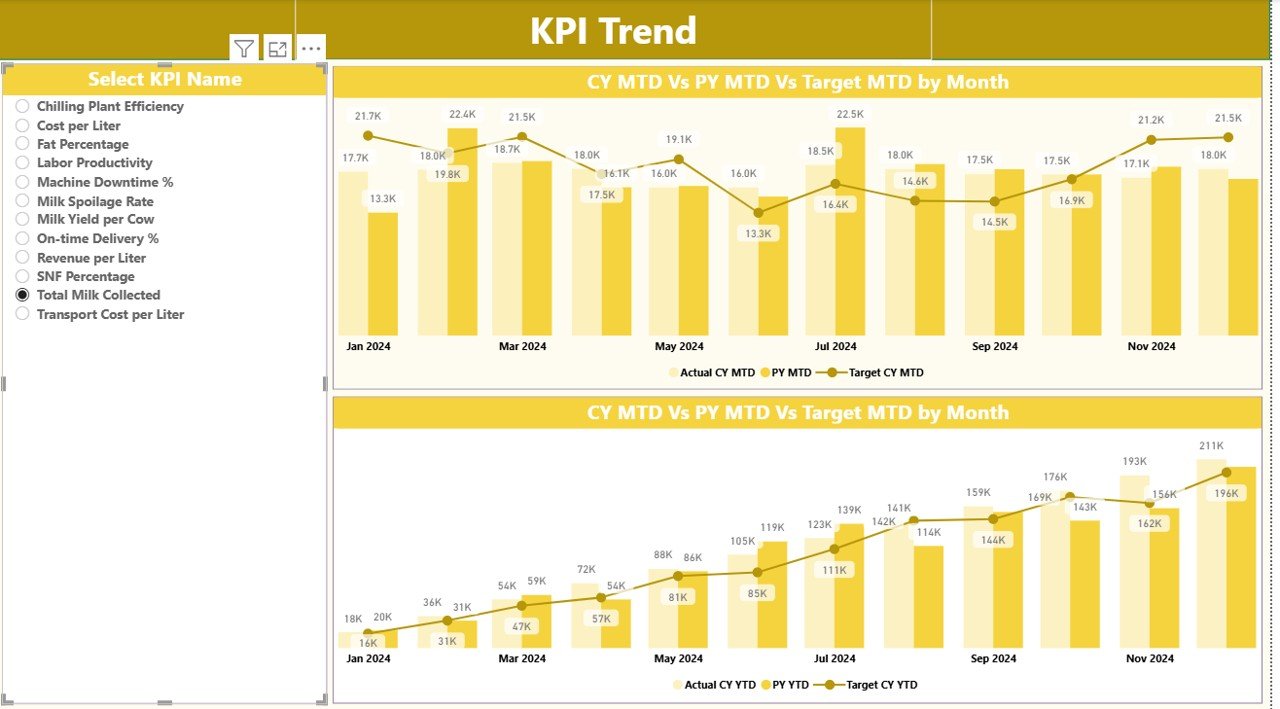
🔹 KPI Trend Page
Displays combo charts for MTD and YTD trends, allowing users to visually analyze KPI movement over time using KPI name slicers.
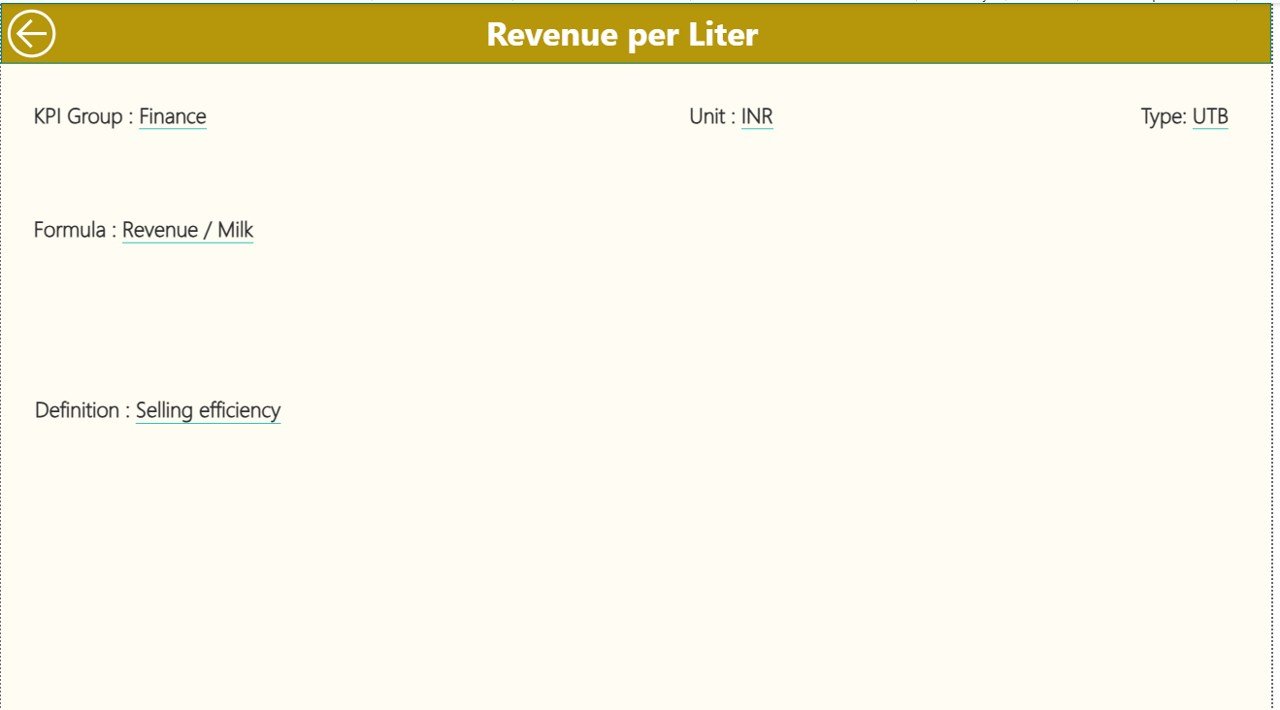
🔹 KPI Definition Page
Serves as a governance and reference layer, showing KPI formulas, definitions, units, and KPI type (LTB / UTB). This page works as a drill-through for deeper clarity.
📁 Excel Data Source Sheets Included
-
Input_Actual
-
Input_Target
-
KPI Definition
These sheets ensure structured data management and easy customization.
🛠️ How to Use the Dairy Industry KPI Dashboard
Using this dashboard is simple and business-friendly:
1️⃣ Enter actual and target values into the predefined Excel sheets
2️⃣ Open the Power BI file and refresh the data
3️⃣ Use slicers to select Month and KPI Group
4️⃣ Review KPI cards, tables, and charts
5️⃣ Drill through KPIs to understand definitions and logic
No advanced Power BI skills are required—basic familiarity is enough to get started.
👥 Who Can Benefit from This Dairy Industry KPI Dashboard?
This dashboard is ideal for:
🥛 Dairy Plant Owners & Operators
🏭 Production & Operations Managers
📊 MIS & Business Analysts
💰 Finance & Cost Control Teams
📦 Supply Chain & Distribution Managers
📈 Senior Management & Executives
🧠 Strategy & Performance Improvement Teams
Whether you manage a small dairy unit or a large processing plant, this dashboard adapts to your scale.
Click here to read the Detailed Blog Post
Watch the step-by-step video tutorial:
Visit our YouTube channel to learn step-by-step video tutorials:
<a href=”https://youtube.com/@PKAnExcelExpert” target=”_blank”>YouTube channel</a>


Reviews
There are no reviews yet.