Managing leases without real-time visibility often leads to cost overruns, missed renewals, and compliance risks. When lease data is scattered across spreadsheets and emails, organizations struggle to control expenses and make timely decisions.
That is exactly where the Lease Management KPI Dashboard in Excel becomes a powerful, ready-to-use solution 📊.
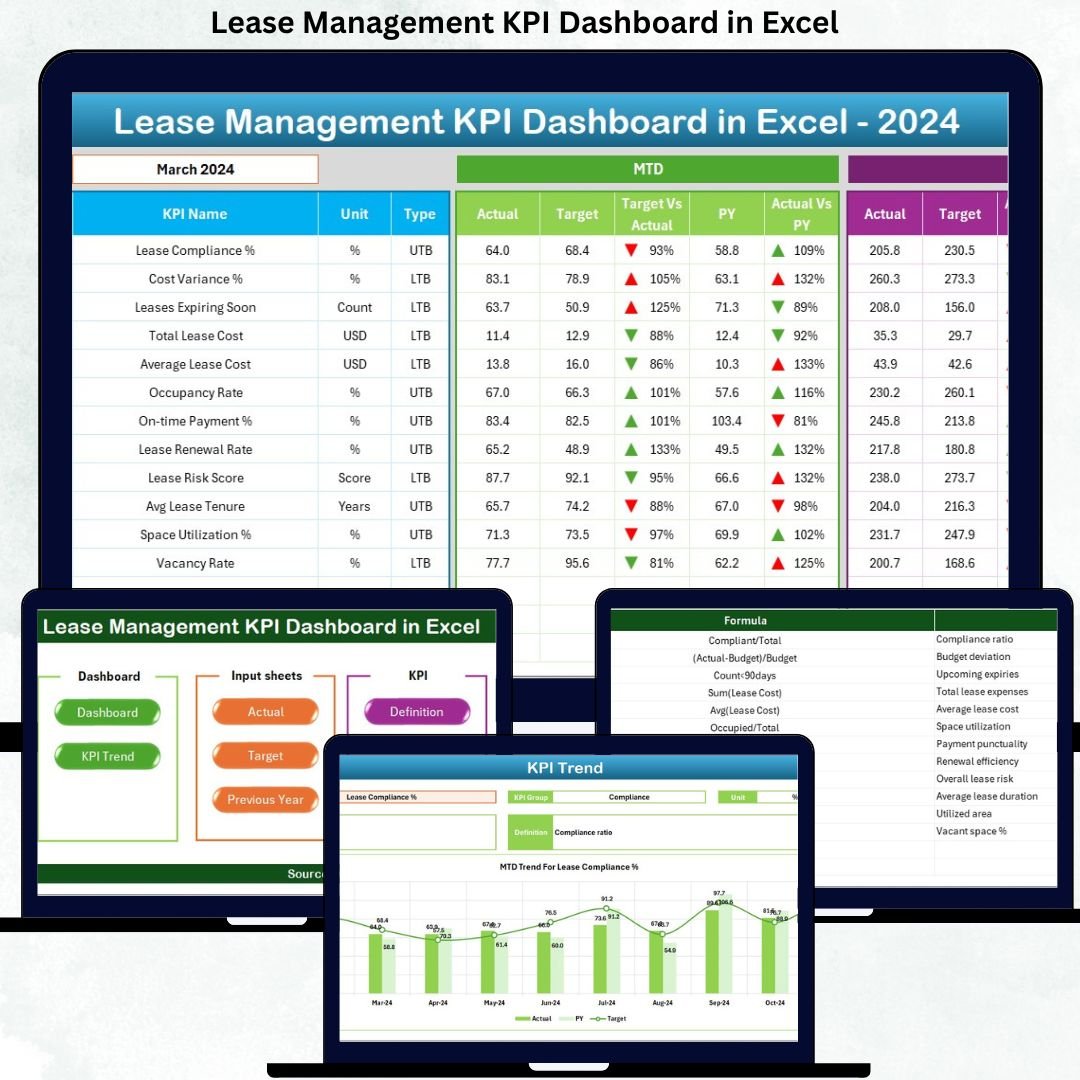
This professionally designed Excel dashboard transforms complex lease data into clear, visual, and actionable insights. Instead of manual tracking and guesswork, you get a centralized system that monitors lease performance, costs, targets, and trends—all from a single Excel file. Best of all, it works entirely in Excel, without any expensive software or IT dependency.
Whether you manage a small lease portfolio or multiple properties across locations, this dashboard helps you stay in control, reduce financial leakage, and improve decision-making.
🔑 Key Features of the Lease Management KPI Dashboard in Excel
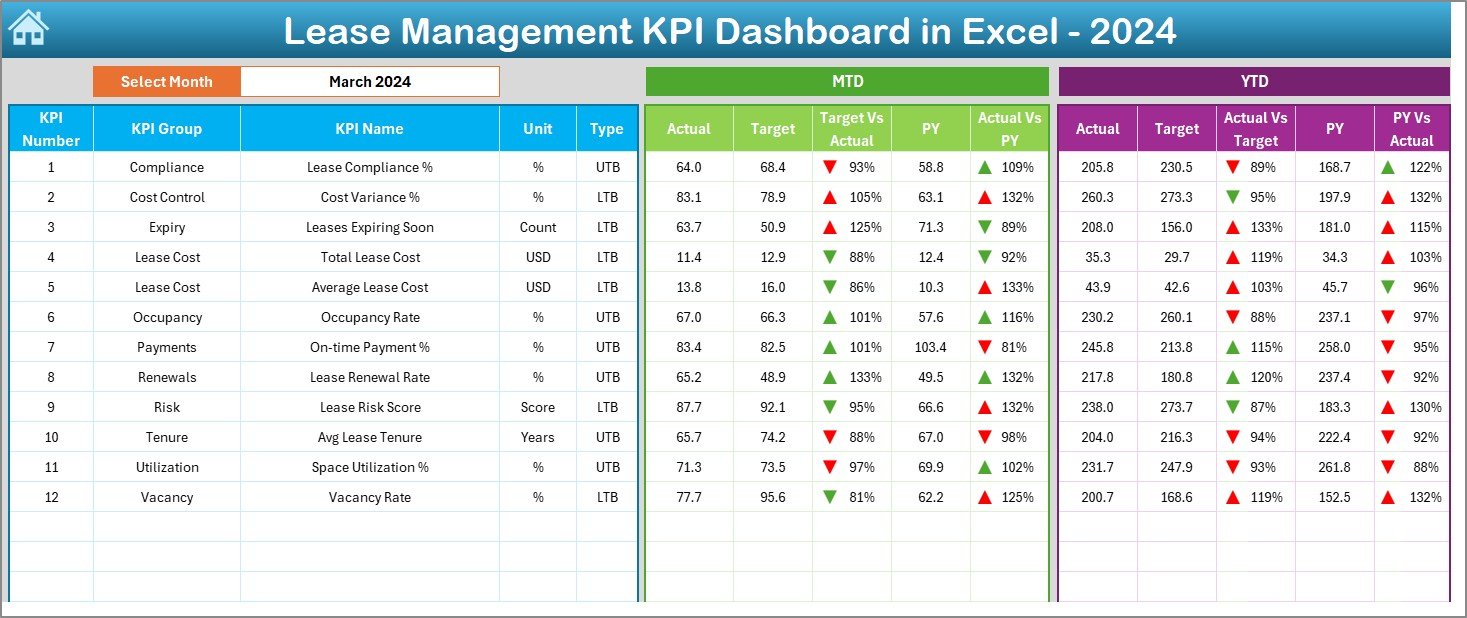
✨ Dynamic Month Selection – Instantly update the entire dashboard by selecting a month
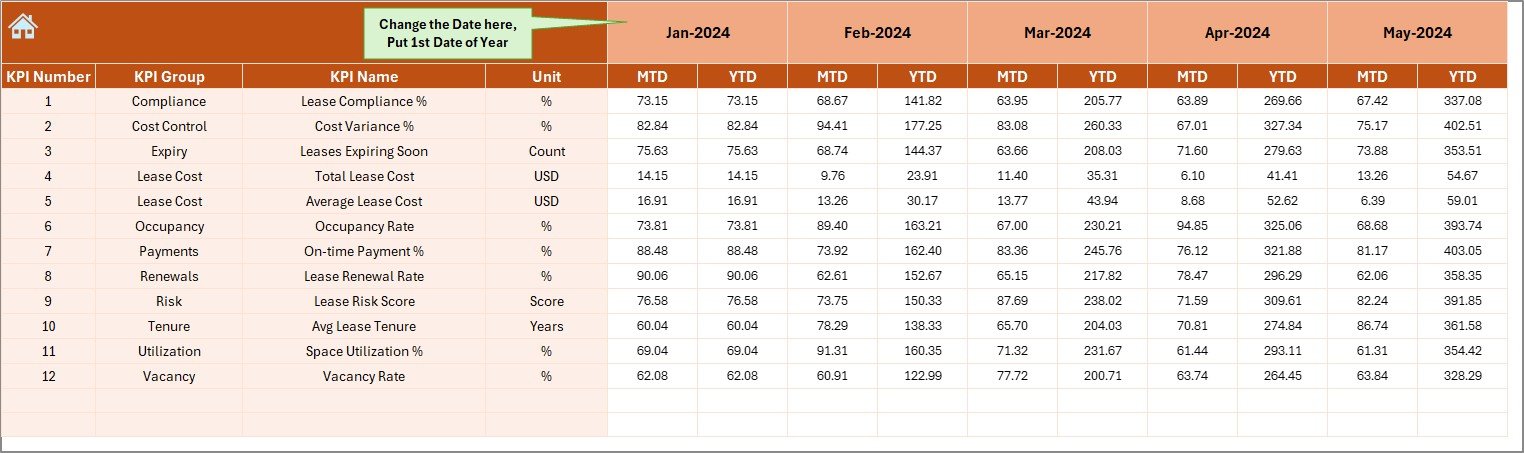
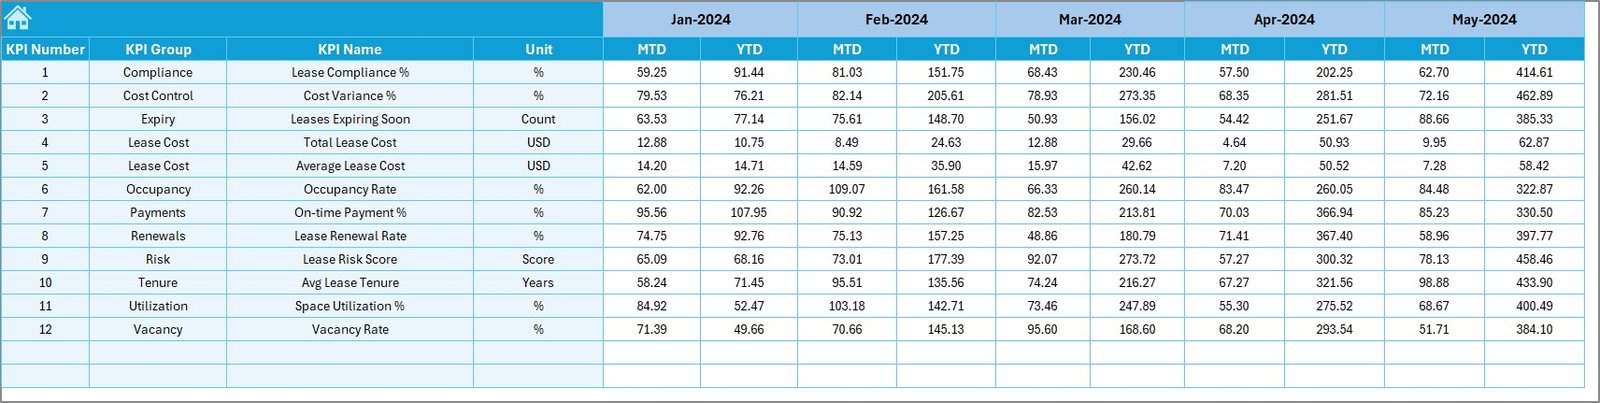
📈 MTD & YTD Performance Tracking – Monitor short-term and cumulative lease performance
🎯 Target vs Actual Analysis – Quickly identify cost overruns or savings
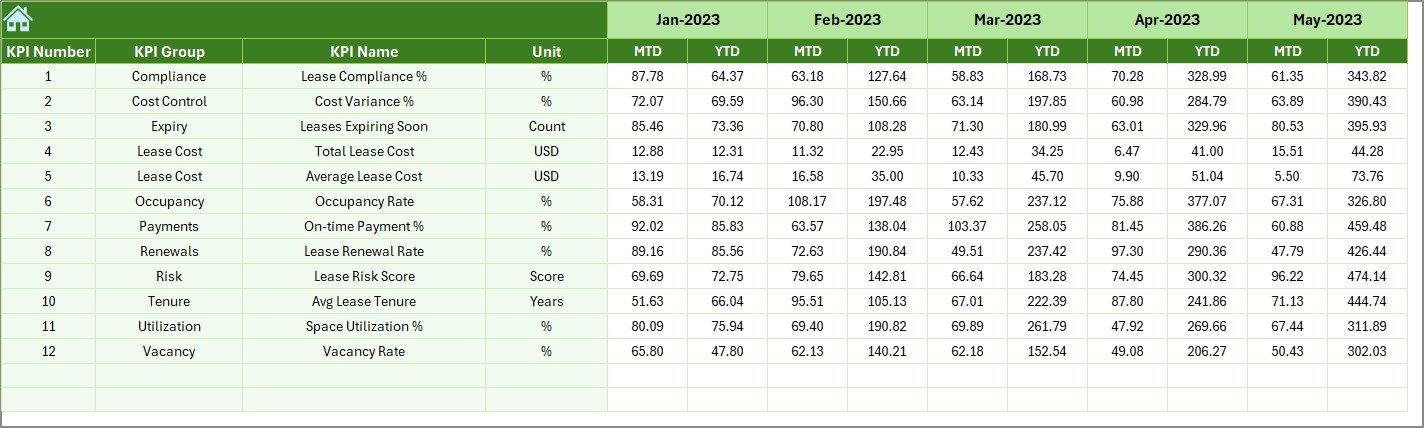
📊 Previous Year Comparison – Analyze year-over-year lease trends
⬆️⬇️ Visual Performance Indicators – Conditional formatting with up/down arrows for instant insights
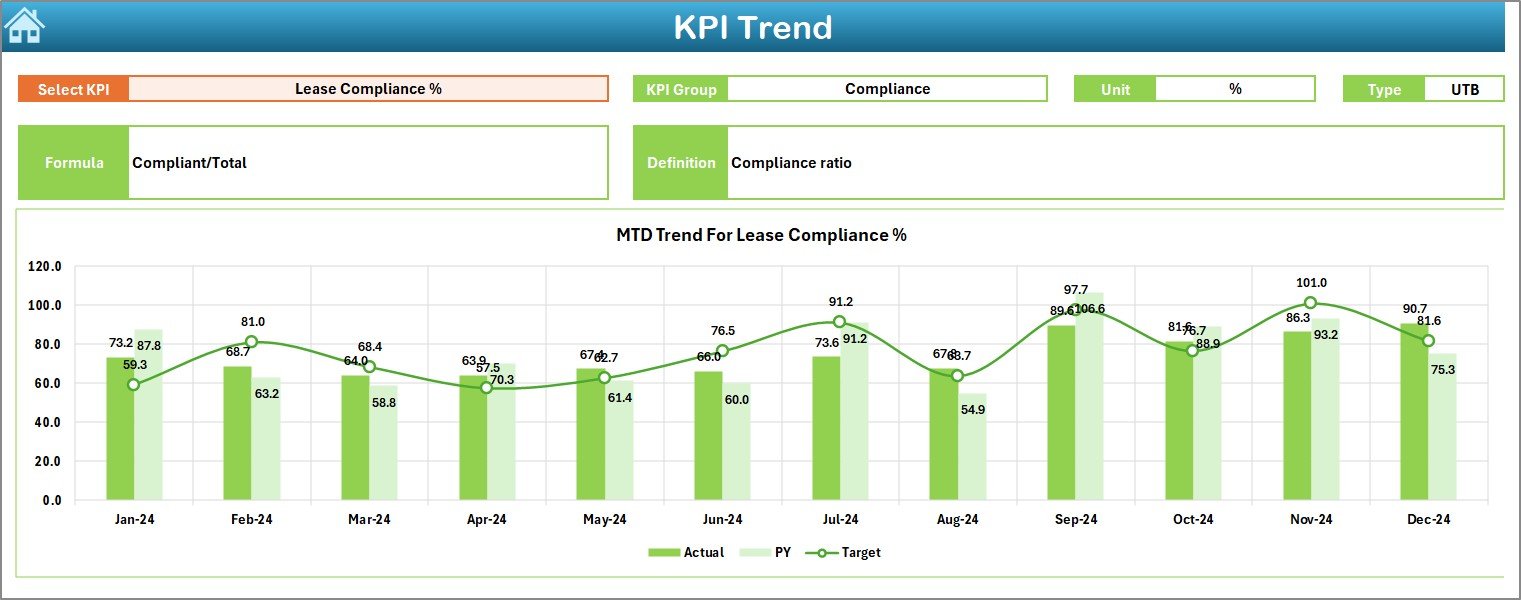
📉 Dedicated KPI Trend Analysis – Track KPI movement across months
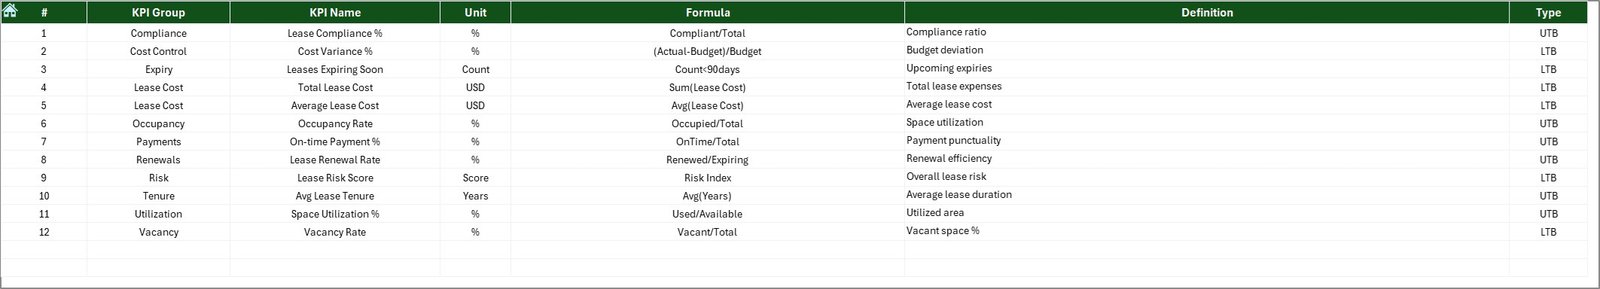
🧩 Customizable KPI Definitions – Modify KPIs, formulas, and units easily
🧮 Structured Data Input Sheets – Clean, organized sheets for Actual, Target, and PY data
💻 100% Excel-Based Solution – No macros, no coding, no external tools required
📦 What’s Inside the Lease Management KPI Dashboard in Excel
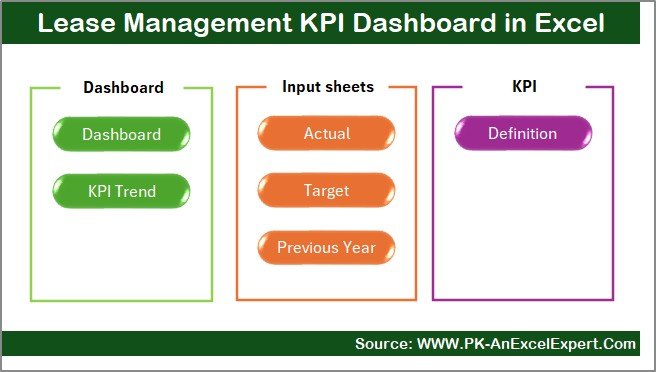
This dashboard includes 7 well-structured worksheets, each designed for clarity and ease of use:
📘 Summary Page – Navigation hub with one-click buttons
📊 Dashboard Sheet – MTD & YTD KPIs with variances and visual indicators
📈 Trend Analysis Sheet – KPI-wise MTD and YTD trend charts
🧾 Actual Data Input Sheet – Enter real performance values
🎯 Target Sheet – Define monthly and yearly performance goals
📅 Previous Year Data Sheet – Store historical data for comparison
📖 KPI Definition Sheet – Define KPI name, group, unit, formula, and description
Everything is logically connected so that updates in data automatically reflect across the dashboard.
🛠️ How to Use the Lease Management KPI Dashboard in Excel
Using the dashboard is simple and intuitive:
1️⃣ Define your lease KPIs in the KPI Definition sheet
2️⃣ Enter Actual, Target, and Previous Year data in respective sheets
3️⃣ Select the reporting month from the dropdown
4️⃣ Instantly view MTD and YTD performance on the dashboard
5️⃣ Use trend charts and arrows to identify risks and opportunities
No advanced Excel skills are required—basic knowledge is enough.
👥 Who Can Benefit from This Lease Management KPI Dashboard in Excel
This dashboard is ideal for:
🏢 Lease & Property Managers – Monitor lease costs and renewals
💰 Finance & Accounts Teams – Control expenses and improve budgeting
🏗️ Facility & Real Estate Teams – Track asset performance
📊 Business Owners & Management – Make informed, data-driven decisions
🧑💼 Compliance & Audit Teams – Improve reporting transparency
Both technical and non-technical users can use this dashboard comfortably.
Click here to read the Detailed Blog Post
Watch the step-by-step video tutorial:
Visit our YouTube channel to learn step-by-step video tutorials
YouTube channel


Reviews
There are no reviews yet.