
In today’s knowledge-driven economy, corporate universities are no longer optional—they are strategic engines for talent development, leadership readiness, and business growth. Organizations invest heavily in training programs, digital learning platforms, certifications, and leadership academies. Corporate Universities KPI Dashboard in Power BI However, without structured measurement, even the most advanced learning initiatives struggle to demonstrate real impact.
The Corporate Universities KPI Dashboard in Power BI is designed to solve this exact challenge. It transforms complex learning and development data into clear, interactive, and decision-ready insights. Corporate Universities KPI Dashboard in Power BI With automated calculations, visual indicators, and trend analysis, this dashboard helps organizations track training effectiveness, learner engagement, operational efficiency, and year-over-year improvement—without relying on manual reports or disconnected spreadsheets. 🚀
Built using Power BI with Excel as the data source, this dashboard combines simplicity with analytical power. Learning leaders, HR teams, and executives gain instant visibility into performance at both Month-to-Date (MTD) and Year-to-Date (YTD) levels, ensuring learning outcomes stay aligned with business goals.
Key Features of the Corporate Universities KPI Dashboard in Power BI ✨
This dashboard is carefully structured to support strategic learning analytics:
✨ 3 Powerful Analytical Pages – Summary, KPI Trend, and KPI Definition
📊 Automated KPI Cards – Instantly view Total KPIs, MTD Target Met & Missed Count
🎯 Interactive Slicers – Filter by Month and KPI Group in one click
📈 MTD & YTD Performance Tracking – Monitor short-term and long-term progress
🔄 Target vs Actual Comparison – Identify gaps using percentage metrics
📉 CY vs PY Analysis – Compare current performance with previous year
📘 Drill-Through KPI Definitions – Full transparency of formulas and logic
🧮 Excel-Based Data Input – Simple, controlled, and scalable data updates
⚡ Real-Time Refresh – Power BI updates visuals instantly after refresh
This dashboard turns learning metrics into actionable intelligence.
What’s Inside the Corporate Universities KPI Dashboard in Power BI 📂
You get a complete performance monitoring framework built around three key pages:
📌 Summary Page
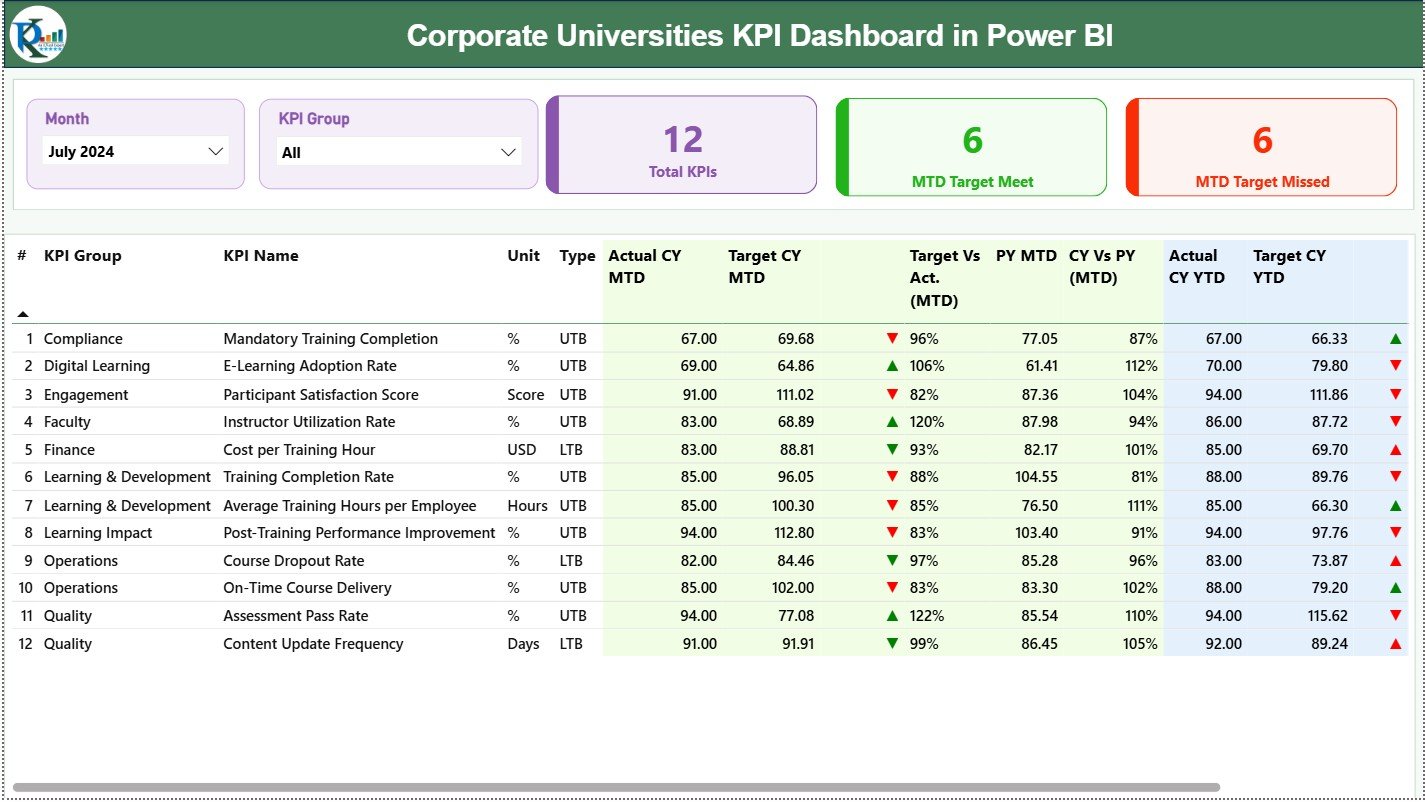
The central control panel showing:
-
Month & KPI Group slicers
-
KPI cards (Total KPIs, Target Met, Target Missed)
-
Detailed KPI table with MTD, YTD, Target vs Actual, CY vs PY, and visual arrows (▲ ▼)
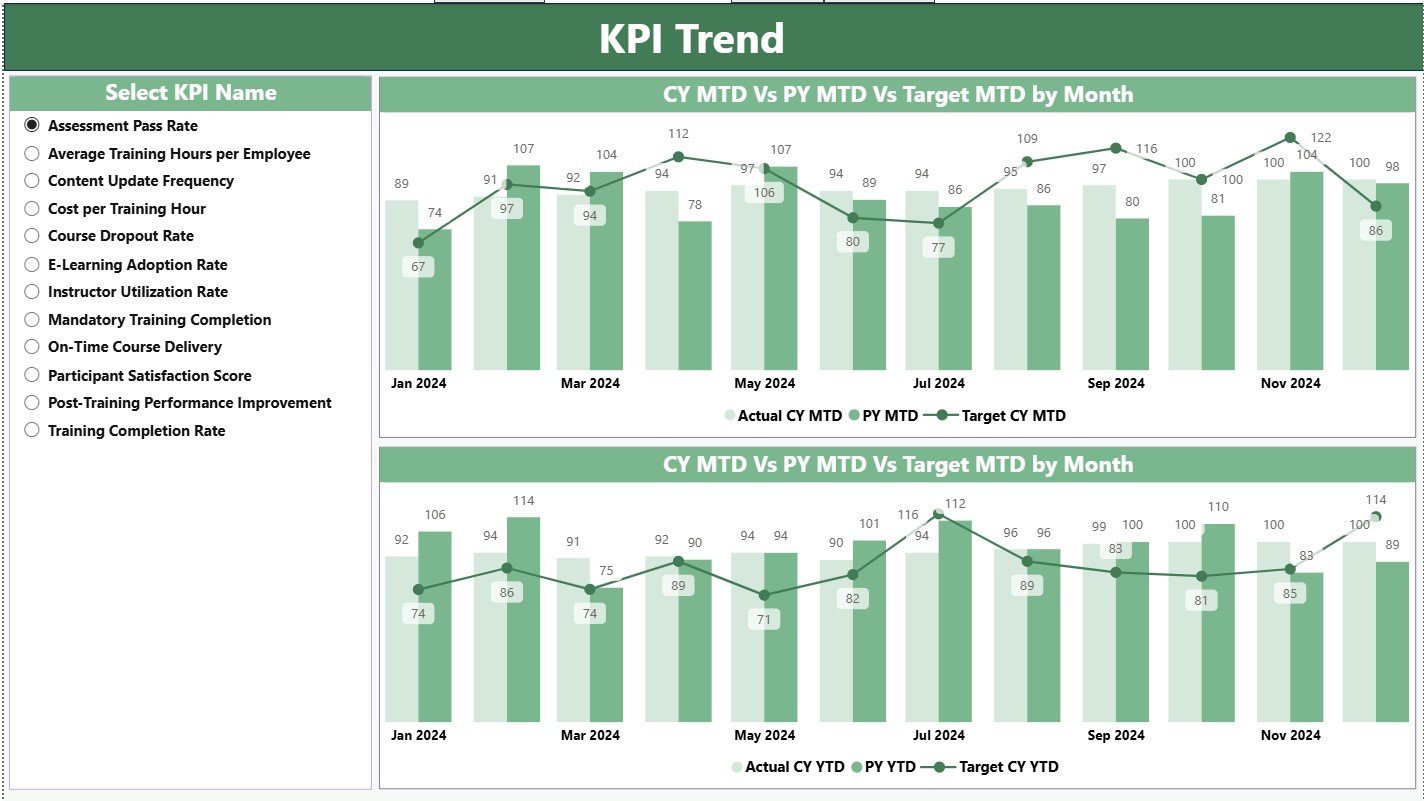
📌 KPI Trend Page
Designed for performance movement analysis:
-
KPI selector slicer
-
MTD Trend chart (Actual CY, Actual PY, Target)
-
YTD Trend chart (Actual CY, Actual PY, Target)
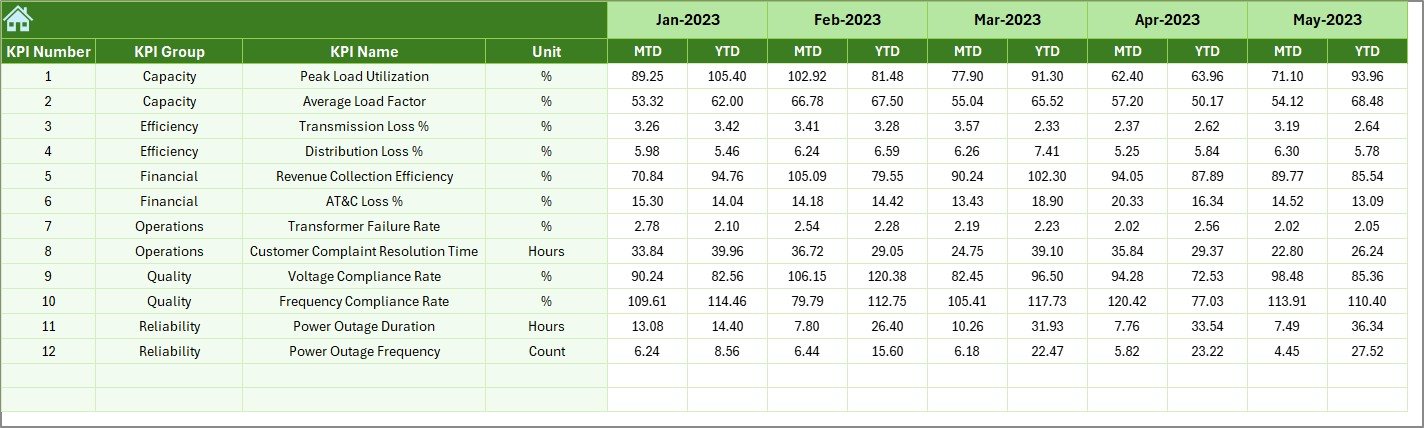
📌 KPI Definition Page
A drill-through governance page displaying:
-
KPI Number, Group, Name
-
Unit, Formula, Definition
-
KPI Type (UTB / LTB)
Additionally, the dashboard uses a structured Excel data model with:
✔ Input Actual sheet
✔ Input Target sheet
✔ KPI Definition sheet
This ensures accuracy, standardization, and ease of maintenance.
How to Use the Corporate Universities KPI Dashboard in Power BI 🛠️
Using the dashboard is simple and beginner-friendly:
1️⃣ Update actual KPI values in the Excel Input Actual sheet
2️⃣ Update targets in the Input Target sheet
3️⃣ Maintain definitions in the KPI Definition sheet
4️⃣ Refresh the Power BI file
5️⃣ Use slicers to analyze by Month or KPI Group
6️⃣ Review KPI cards, tables, and trend charts
7️⃣ Drill through to understand KPI definitions when needed
Within minutes, you get professional, board-ready insights—without complex tools or coding. ⚡
Who Can Benefit from This Corporate Universities KPI Dashboard? 👥
This dashboard is ideal for all stakeholders involved in learning and performance:
🎓 Corporate University Heads – Measure overall learning effectiveness
📊 Learning & Development Managers – Track engagement and outcomes
🧠 HR Analytics Teams – Monitor KPI performance systematically
📈 Talent & Leadership Teams – Align learning with business goals
🏢 Business Executives – Review learning ROI with confidence
📑 Strategy & Performance Teams – Support data-driven decisions
If your organization wants visibility, accountability, and measurable learning impact—this dashboard is a must-have.


Reviews
There are no reviews yet.