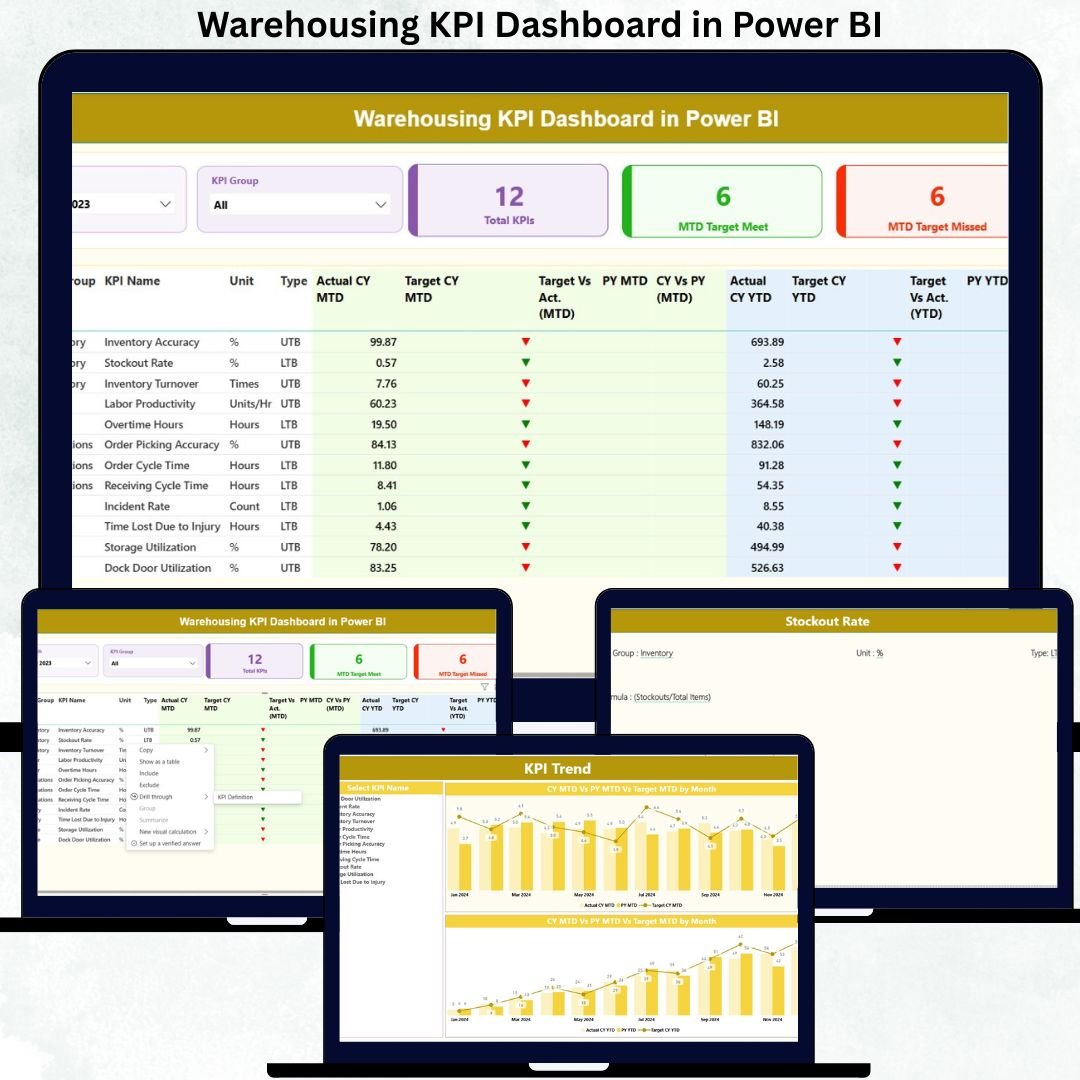
A high-performing warehouse needs speed, accuracy, and complete visibility. But manual reports slow teams, hide mistakes, and make monthly reviews stressful. The Warehousing KPI Dashboard in Power BI solves this problem instantly. It transforms raw Excel data into meaningful visuals, trend insights, and KPI scores—helping warehouse managers make faster, smarter, and more confident decisions.
This ready-to-use Power BI template gives you a complete system to track order processing, inventory accuracy, receiving, dispatch performance, turnaround times, and workforce productivity—all in one place. Whether you manage a growing warehouse or a multi-location distribution center, this dashboard gives you real-time clarity without any technical effort.
✨ Key Features of the Warehousing KPI Dashboard in Power BI
This dashboard is designed to simplify warehouse reporting and supercharge decision-making.
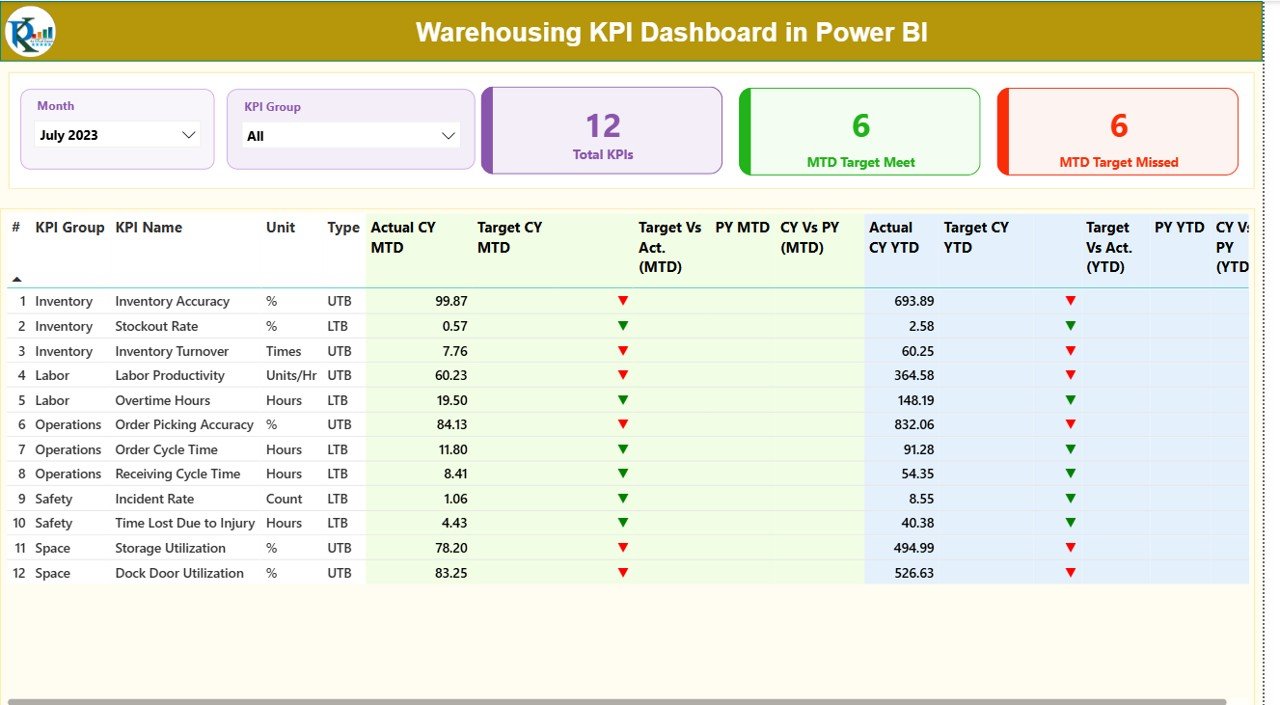
🔹 Real-Time KPI Insights – Instantly monitor MTD & YTD performance for every KPI.
🔹 Smart Slicers – Filter data by Month, KPI Group, or KPI Name to get laser-focused insights.
🔹 Interactive KPI Cards – View Total KPIs Count, Target Met Count, and Target Missed Count instantly.
🔹 Detailed Performance Table – Compare Actual vs Target vs Previous Year numbers with clear up/down indicators.
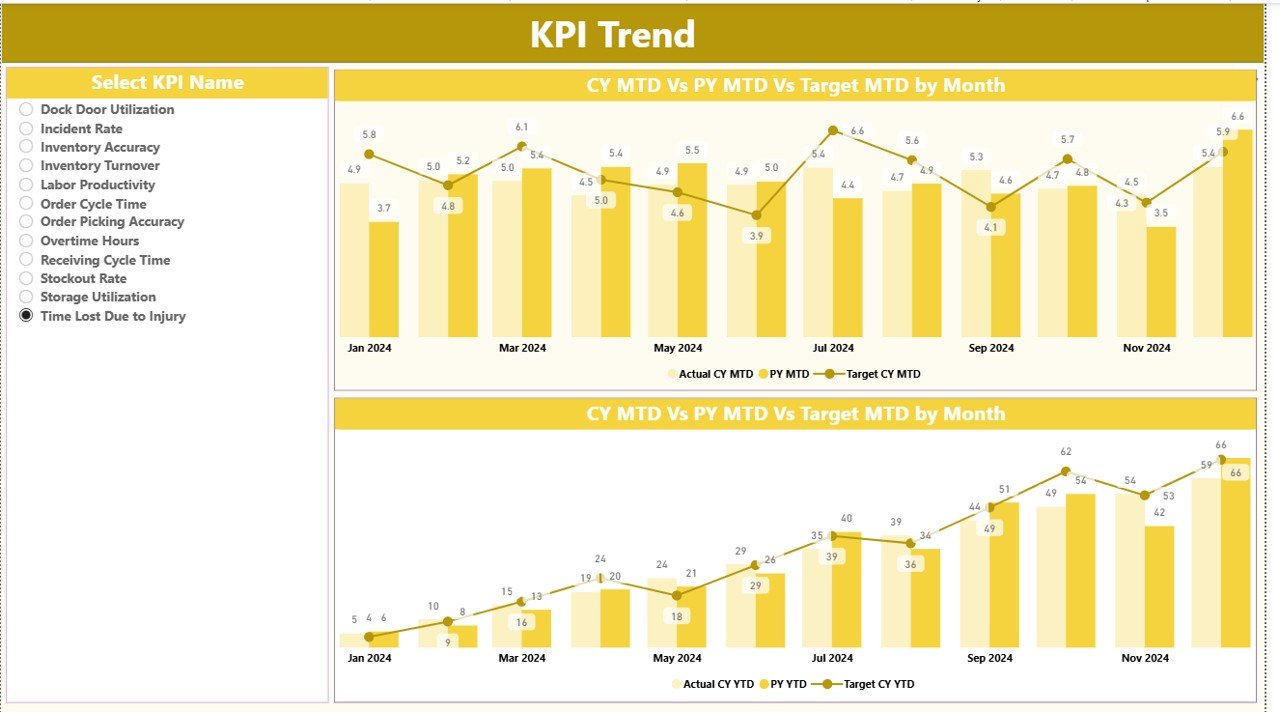
🔹 Trend Analytics – Visualize performance patterns across months and years using combo charts.
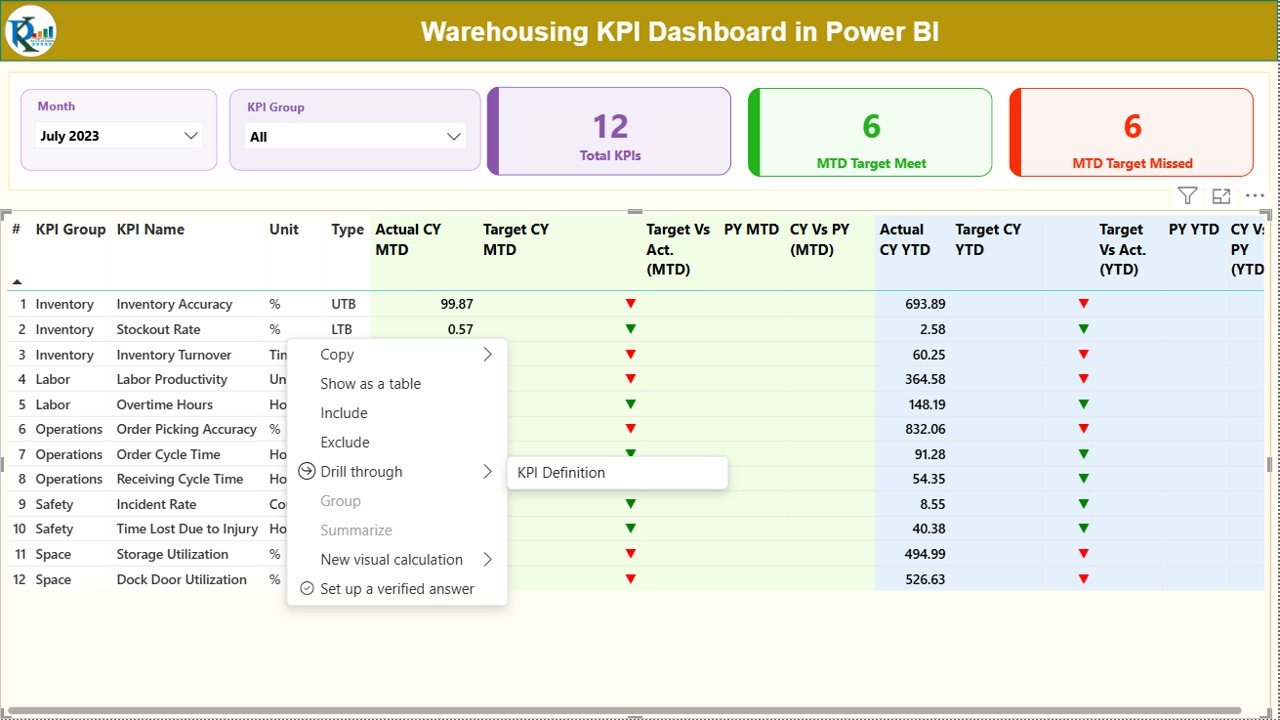
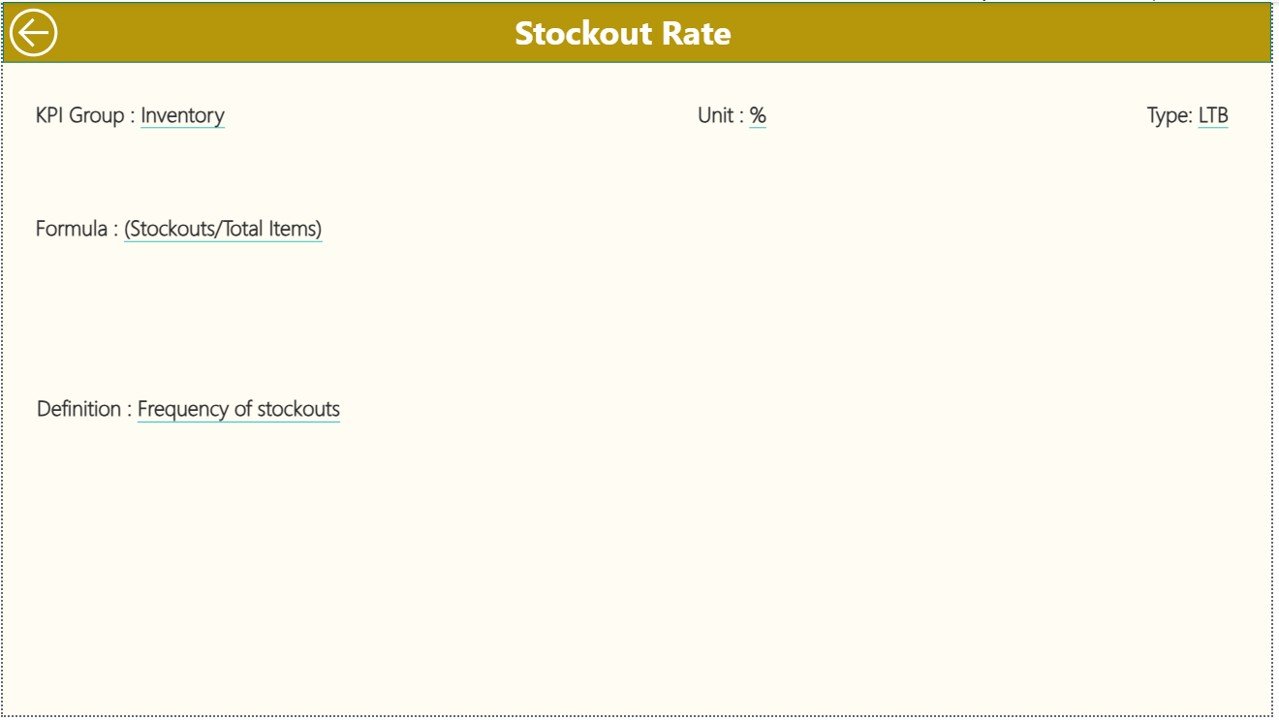
🔹 Drill-Through KPI Definition Page – Understand each KPI’s formula, unit, and meaning with one click.
🔹 Easy Excel Integration – Maintain all data through simple Excel sheets—no technical skills required.
These features make monthly reporting faster, error-free, and far more organized.
📦 What’s Inside the Warehousing KPI Dashboard in Power BI
Inside this professional dashboard package, you get a complete warehouse performance tracking system, including:
📁 Power BI Dashboard File (.PBIX) with
-
Summary Page
-
KPI Trend Page
-
KPI Definition Page (Drill-through)
📊 Excel Data Source Template, including
-
Input_Actual Sheet (MTD & YTD Actuals)
-
Input_Target Sheet (MTD & YTD Targets)
-
KPI Definition Sheet (KPI Logic, Unit, Formula, LTB/UTB Type)
📘 KPI Dictionary for easy understanding of all KPIs
🧭 Clean Navigation Controls for quick movement between dashboard pages
📌 Conditional Formatting Arrows for visual performance evaluation
Everything is structured so you can start using it within minutes.
🛠️ How to Use the Warehousing KPI Dashboard in Power BI
Using the dashboard is extremely simple—even if you are not a Power BI expert.
1️⃣ Fill the Excel Data Sheets
Add your KPI Actual, Target, and KPI Definitions in the provided template.
2️⃣ Load the Data into Power BI
The dashboard automatically pulls everything and updates visuals.
3️⃣ Use Slicers for Smart Filtering
Choose any Month, KPI Group, or KPI Name to instantly update all visuals.
4️⃣ Analyze Summary & Trends
Use the Summary Page for monthly performance and the Trend Page for historical comparison.
5️⃣ Drill Through for KPI Definitions
Right-click any KPI to understand its formula, type, and meaning.
6️⃣ Refresh Monthly
Just update your Excel file each month—Power BI does the rest automatically.
This makes reporting extremely fast, accurate, and repeatable.
👥 Who Can Benefit from This Warehousing KPI Dashboard in Power BI
This dashboard is ideal for anyone who deals with warehouse operations and needs structured performance insights.
👨💼 Warehouse Managers – Track operational results effortlessly.
📦 Logistics Teams – Improve order processing, shipping speed, and delivery accuracy.
📈 Supply Chain Analysts – Identify trends, bottlenecks, and improvement areas.
🏭 Operations Heads – Ensure targets are met across inbound, outbound, and inventory functions.
📊 Business Owners – Monitor warehouse health across multiple locations.
🎓 Learners & Analysts – Perfect for training and mastering KPI-based reporting.
If warehousing performance matters to you, this dashboard is your most valuable tool.
### Click Here to Read the Detailed Blog Post
Watch the step-by-step video tutorial:


Reviews
There are no reviews yet.