Managing airport operations without clear KPI visibility is no longer practical in today’s data-driven aviation environment. Airports must track passenger traffic, flight operations, safety performance, baggage handling, service quality, and revenue efficiency—often all at once. When this information lives in scattered Excel files, decision-making becomes slow and reactive.
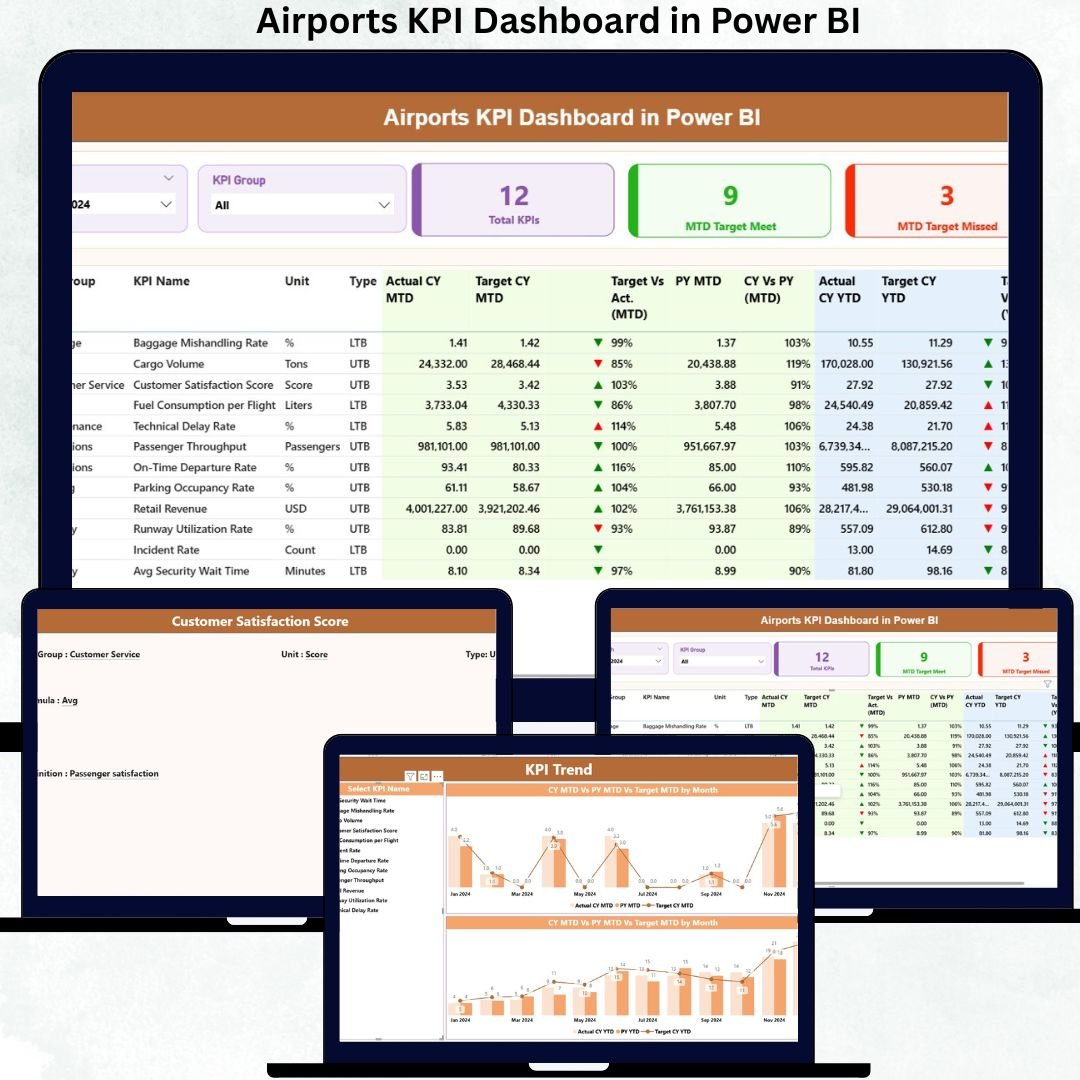
That is exactly where the Airports KPI Dashboard in Power BI becomes a powerful, ready-to-use performance management solution ✈️📊.
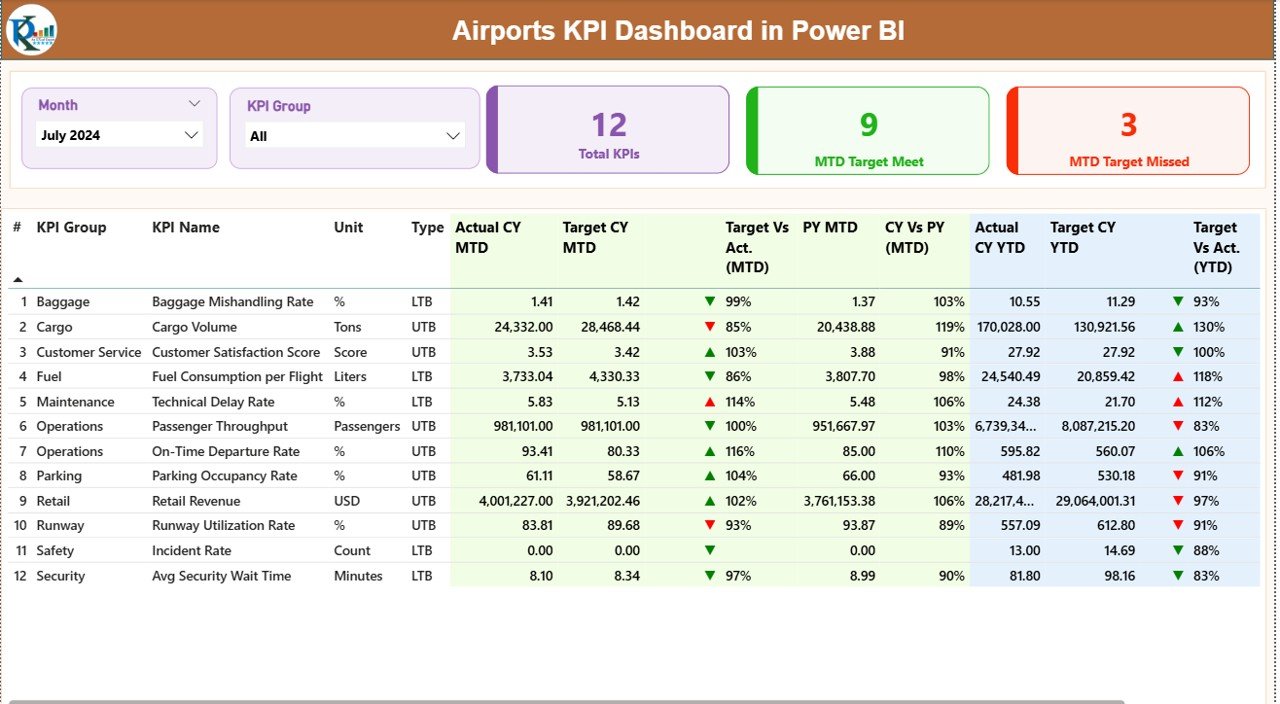
This professionally designed dashboard converts structured Excel KPI data into interactive visuals, performance indicators, trend charts, and status icons—giving airport authorities and operations teams instant clarity on what is working and what needs attention. Instead of spending hours preparing reports, teams can focus on analyzing performance and taking timely action.
🚀 Key Features of Airports KPI Dashboard in Power BI
-
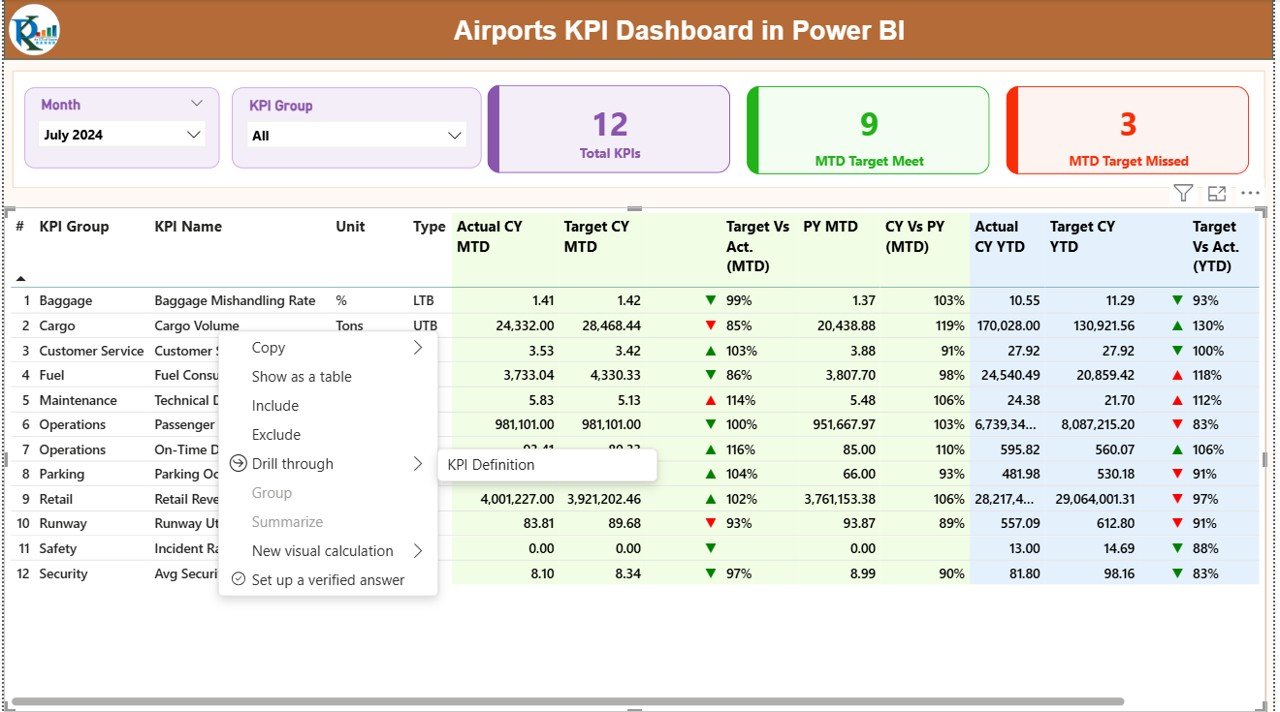
📊 Centralized KPI Monitoring
Track all airport KPIs in one clean and interactive Power BI dashboard. -
📅 Dynamic Month & KPI Group Slicers
Instantly filter performance by month or KPI group without touching formulas. -
✅ MTD & YTD Performance Tracking
Monitor Month-to-Date and Year-to-Date metrics side by side for short-term and long-term visibility. -
🎯 Target vs Actual Comparison
Identify performance gaps instantly using automated percentage calculations. -
📈 Current Year vs Previous Year Trends
Spot growth patterns, seasonality, and recurring issues. -
🔍 Visual Status Indicators
Green ▲ and Red ▼ icons highlight target achievement and underperformance. -
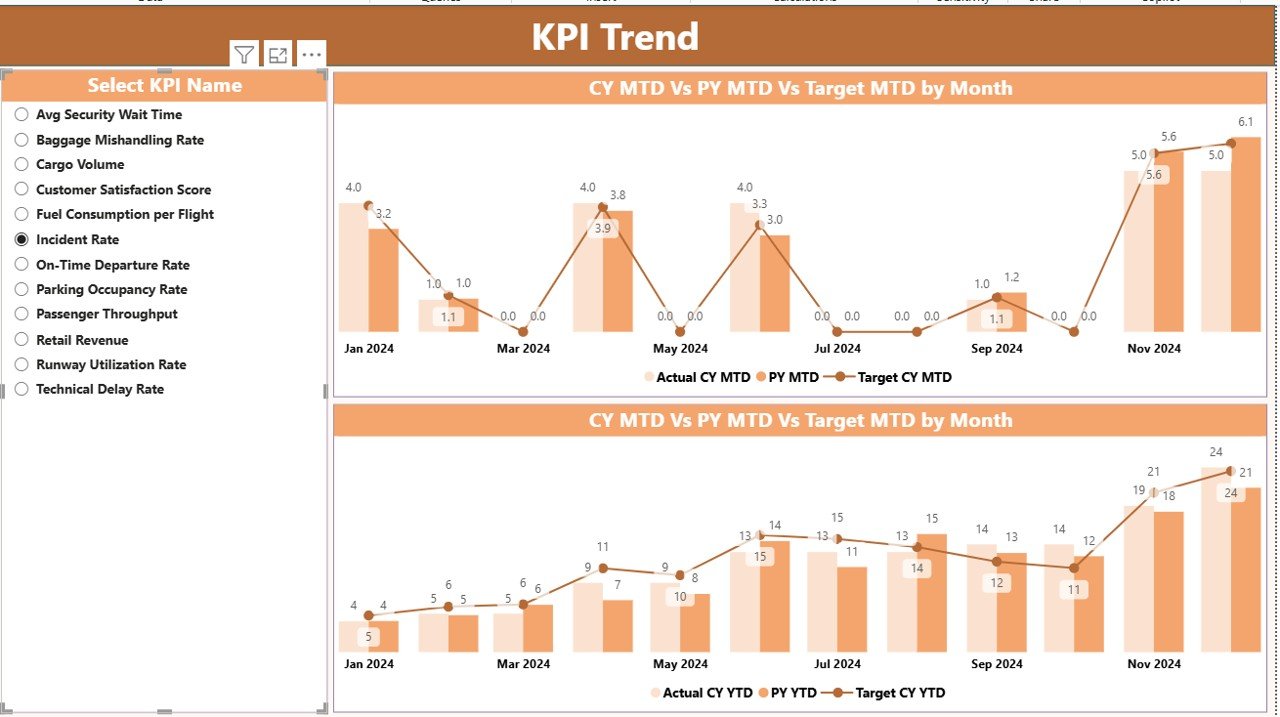
📉 Detailed KPI Trend Analysis
Interactive combo charts for both MTD and YTD trends. -
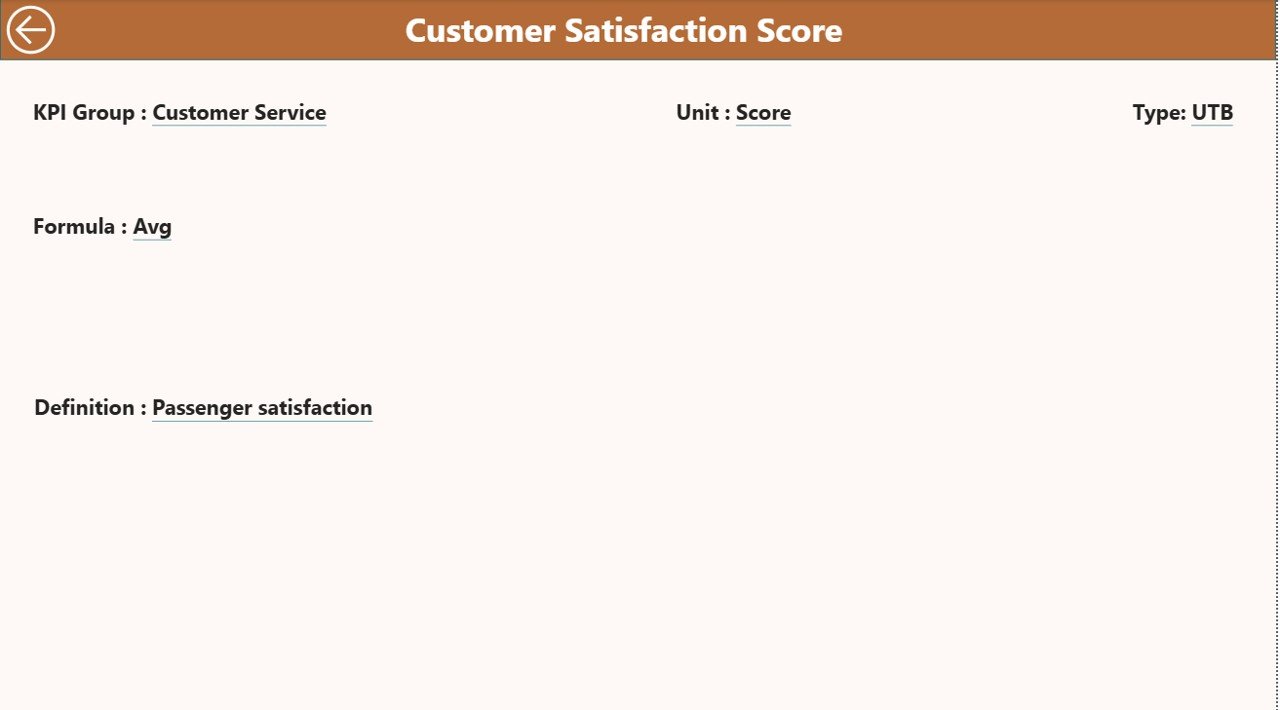
📘 Built-in KPI Definition Page
View KPI formula, definition, and KPI type (LTB / UTB) directly within the dashboard.
📦 What’s Inside the Airports KPI Dashboard in Power BI
This digital product includes a fully structured Power BI Desktop file connected to Excel data sources.
📄 Dashboard Pages
-
Summary Page – Overall KPI snapshot with cards, slicers, and a detailed KPI table
-
KPI Trend Page – MTD & YTD trend analysis using interactive charts
-
KPI Definition Page – Drill-through reference for KPI logic and descriptions
📊 Excel Data Structure
-
Input_Actual Sheet – Capture actual MTD and YTD KPI values
-
Input_Target Sheet – Maintain target benchmarks
-
KPI Definition Sheet – Store master KPI details such as unit, formula, and KPI type
This structure ensures easy maintenance, scalability, and accuracy.
🧭 How to Use the Airports KPI Dashboard in Power BI
Using this dashboard does not require advanced Power BI skills.
-
📝 Update actual and target KPI data in the Excel sheets
-
🔄 Refresh the Power BI Desktop file
-
🎚️ Select month and KPI group using slicers
-
📊 Analyze MTD & YTD performance using cards, tables, and charts
-
✅ Take data-backed operational decisions
With this workflow, reporting becomes simple, fast, and reliable.
👥 Who Can Benefit from This Airports KPI Dashboard
This dashboard is ideal for:
-
✈️ Airport Operations Managers
-
🏢 Airport Authority Executives
-
📊 Performance & Planning Teams
-
📈 Strategy and Analytics Professionals
-
🧾 Aviation Consultants & Auditors
Whether managing a single airport or preparing performance reviews, this dashboard fits perfectly.
### Click here to read the Detailed Blog Post
Watch the step-by-step video tutorial:


Reviews
There are no reviews yet.