Running a specialty bookstore today is no longer just about stocking great titles. Store owners must constantly track orders, profits, returns, customer satisfaction, and trends across stores and book categories. However, when data stays locked inside spreadsheets or basic reports, important insights remain hidden—and opportunities get missed.
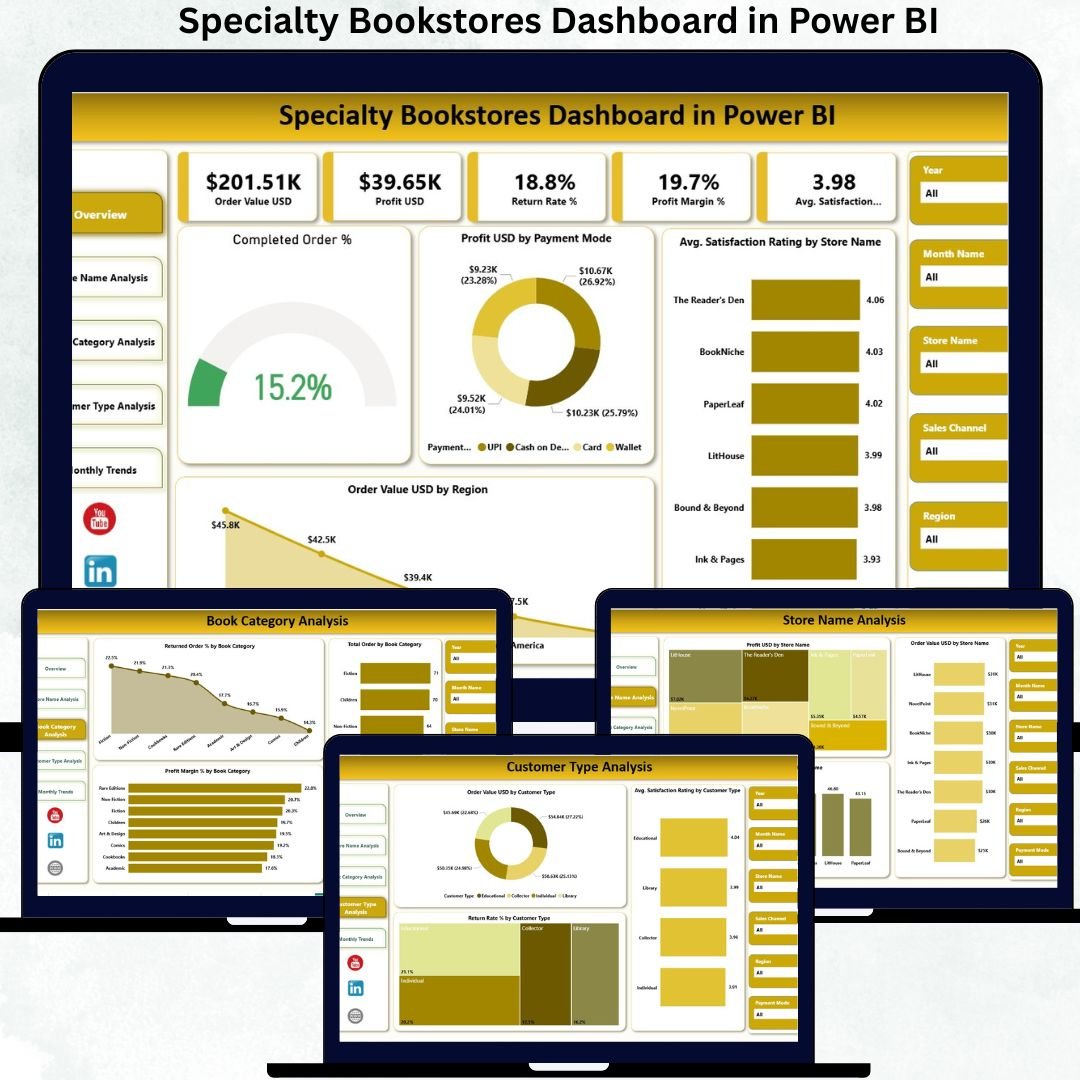
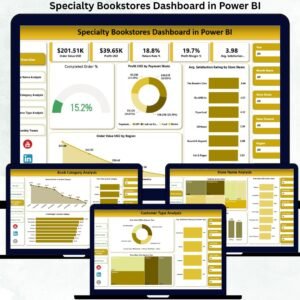
The Specialty Bookstores Dashboard in Power BI solves this problem by transforming raw bookstore data into interactive, visual, and decision-ready insights. Specialty Bookstores Dashboard in Power BI This ready-to-use Power BI dashboard gives bookstore owners, managers, and retail analysts a single control center to monitor sales performance, profitability, returns, customer behavior, and time-based trends with confidence.
By using Power BI’s powerful visuals, slicers, and filters, this dashboard helps specialty bookstores move from reactive reporting to proactive, data-driven retail management.
🚀 Key Features of the Specialty Bookstores Dashboard in Power BI
📚 Centralized Bookstore Performance Tracking – All KPIs in one interactive dashboard
📊 Real-Time Sales & Profit Visibility – Instantly analyze order value and profitability
🔄 Return Rate & Margin Analysis – Identify low-margin or high-return areas
⭐ Customer Satisfaction Tracking – Measure experience by store and customer type
🏬 Store-Wise Performance Comparison – Spot high and low performing locations
📈 Monthly Trend Analysis – Understand seasonality and demand patterns
🎛️ Power BI Slicers & Filters – Drill down by store, category, customer, and time
⚡ Fast & Visual Insights – No manual reporting or guesswork
📦 What’s Inside the Specialty Bookstores Dashboard
This Power BI dashboard contains five professionally designed analytical pages, each focusing on a critical retail question:
🟢 Overview Page
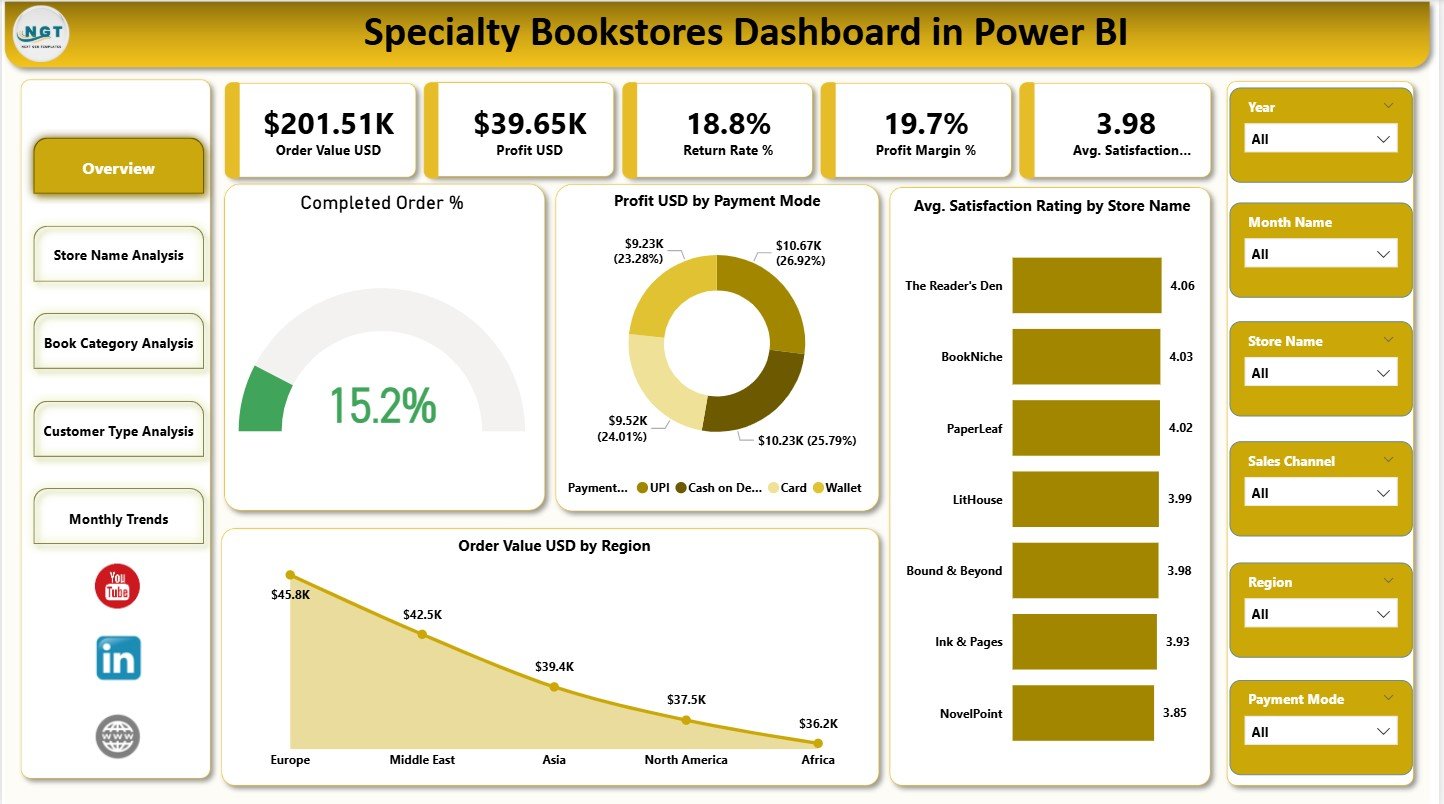
Acts as the executive snapshot of bookstore performance. It displays KPI cards for Order Value, Profit, Return Rate, Profit Margin, and Average Satisfaction Rating, along with charts such as Completed Order %, Profit by Payment Mode, Store-wise Satisfaction, and Region-wise Sales.
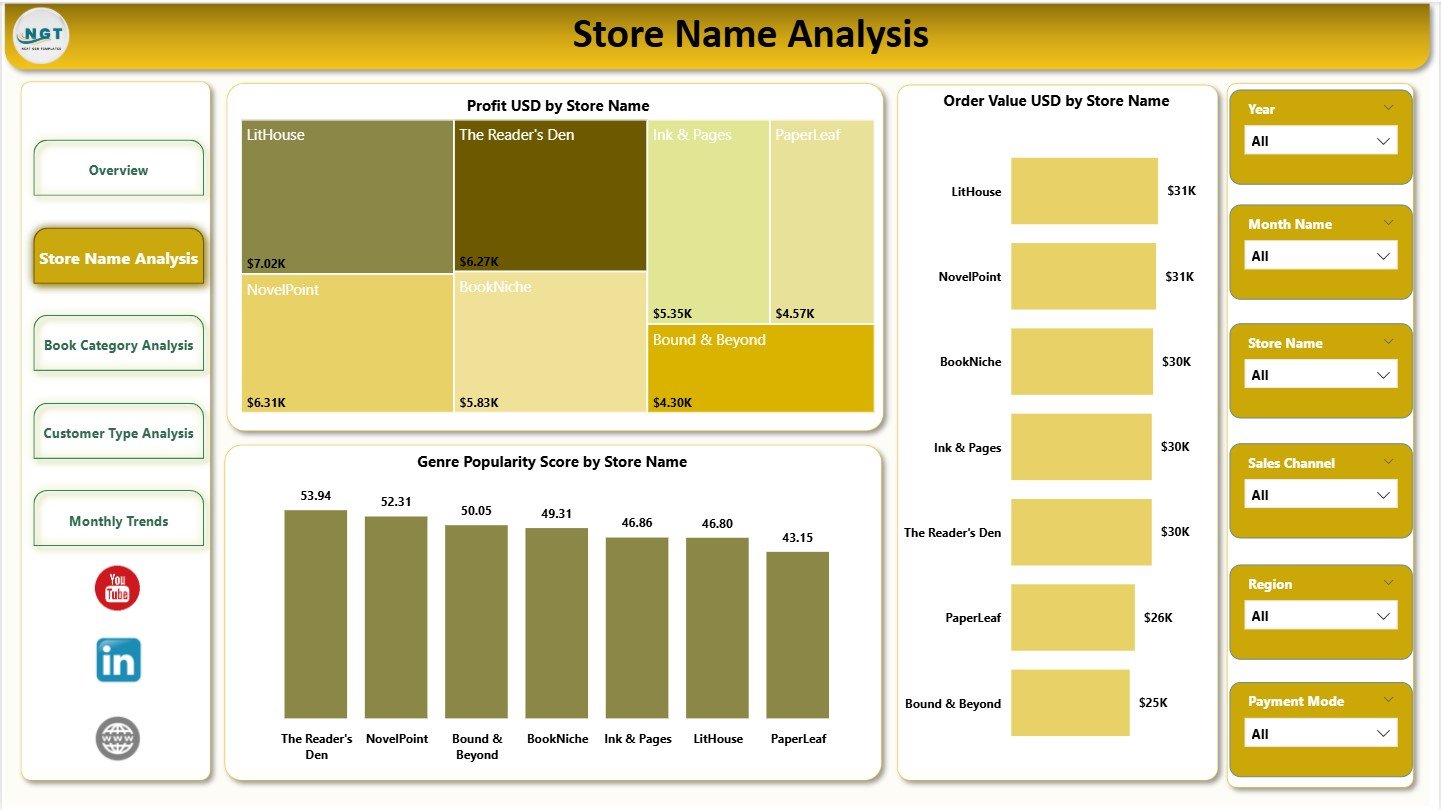
🏬 Store Name Analysis Page
Compares bookstore locations using visuals like Profit USD by Store, Order Value by Store, and Genre Popularity Score by Store. This page helps identify which stores deserve attention, promotion, or process improvement.
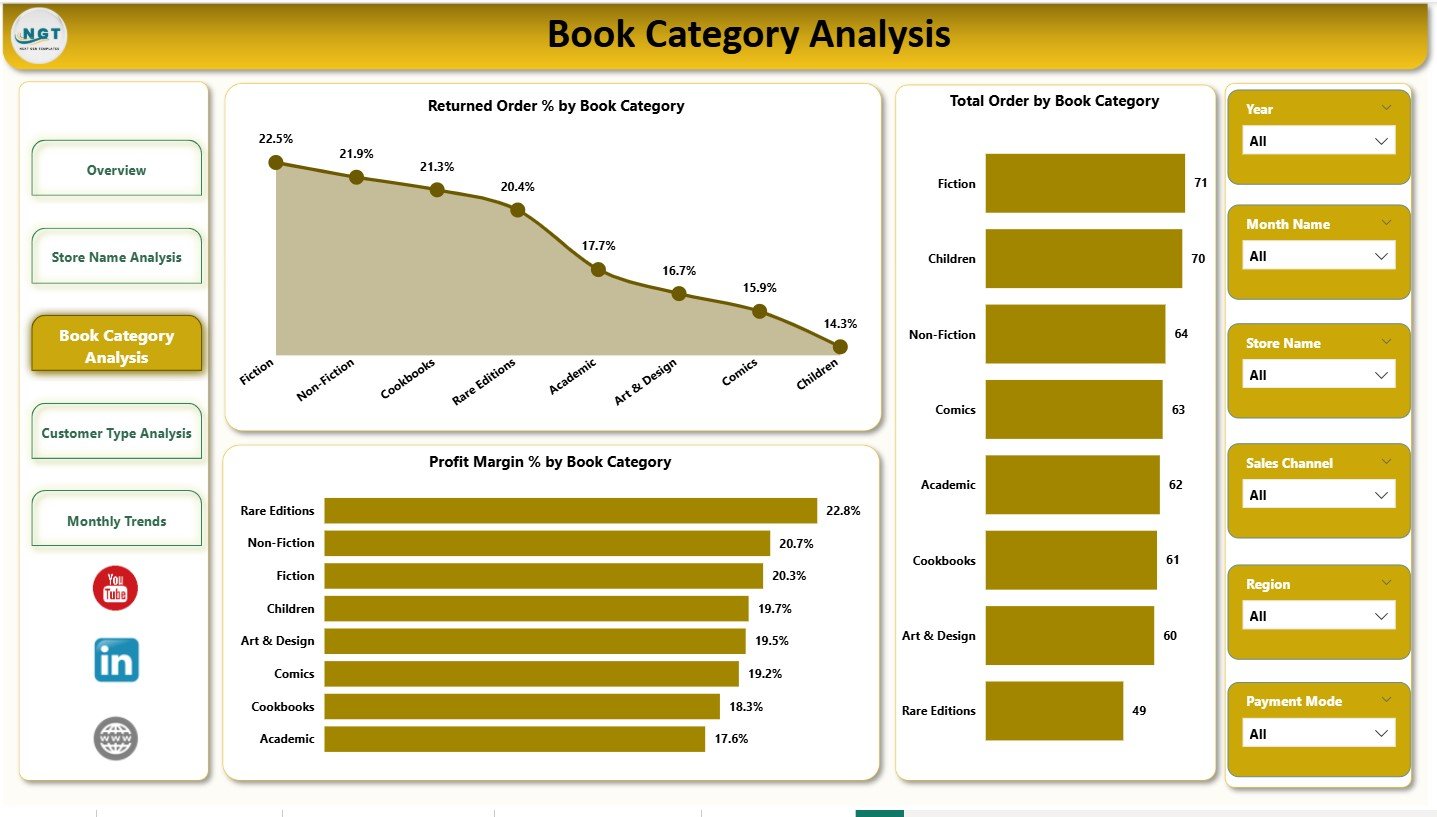
📖 Book Category Analysis Page
Focuses on genre performance with charts such as Returned Order % by Book Category, Total Orders by Category, and Profit Margin % by Genre. It helps optimize inventory, reduce returns, and focus on high-margin genres.
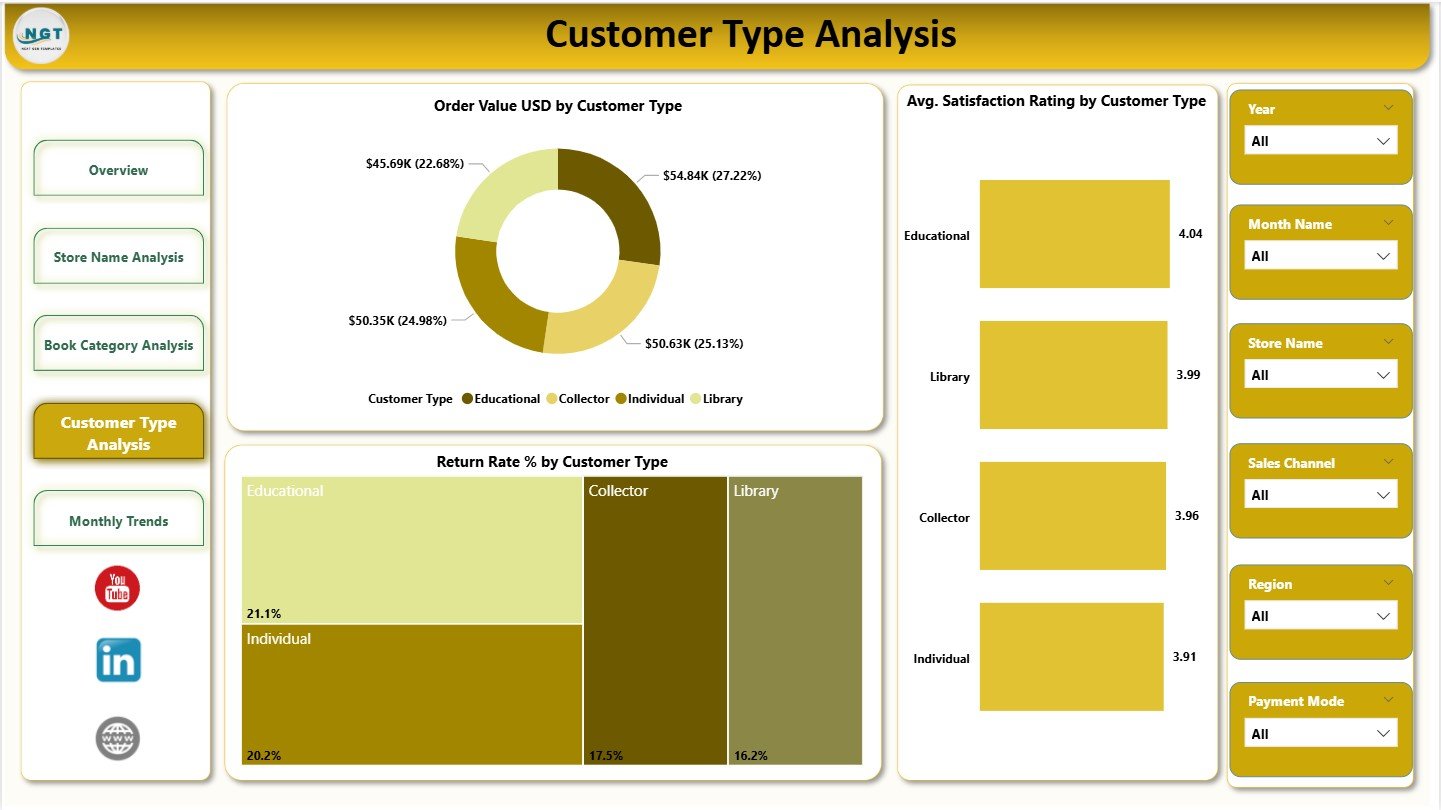
👥 Customer Type Analysis Page
Analyzes customer behavior using Order Value by Customer Type, Satisfaction Rating by Customer Type, and Return Rate % by Customer Type. This insight supports loyalty programs and targeted promotions.
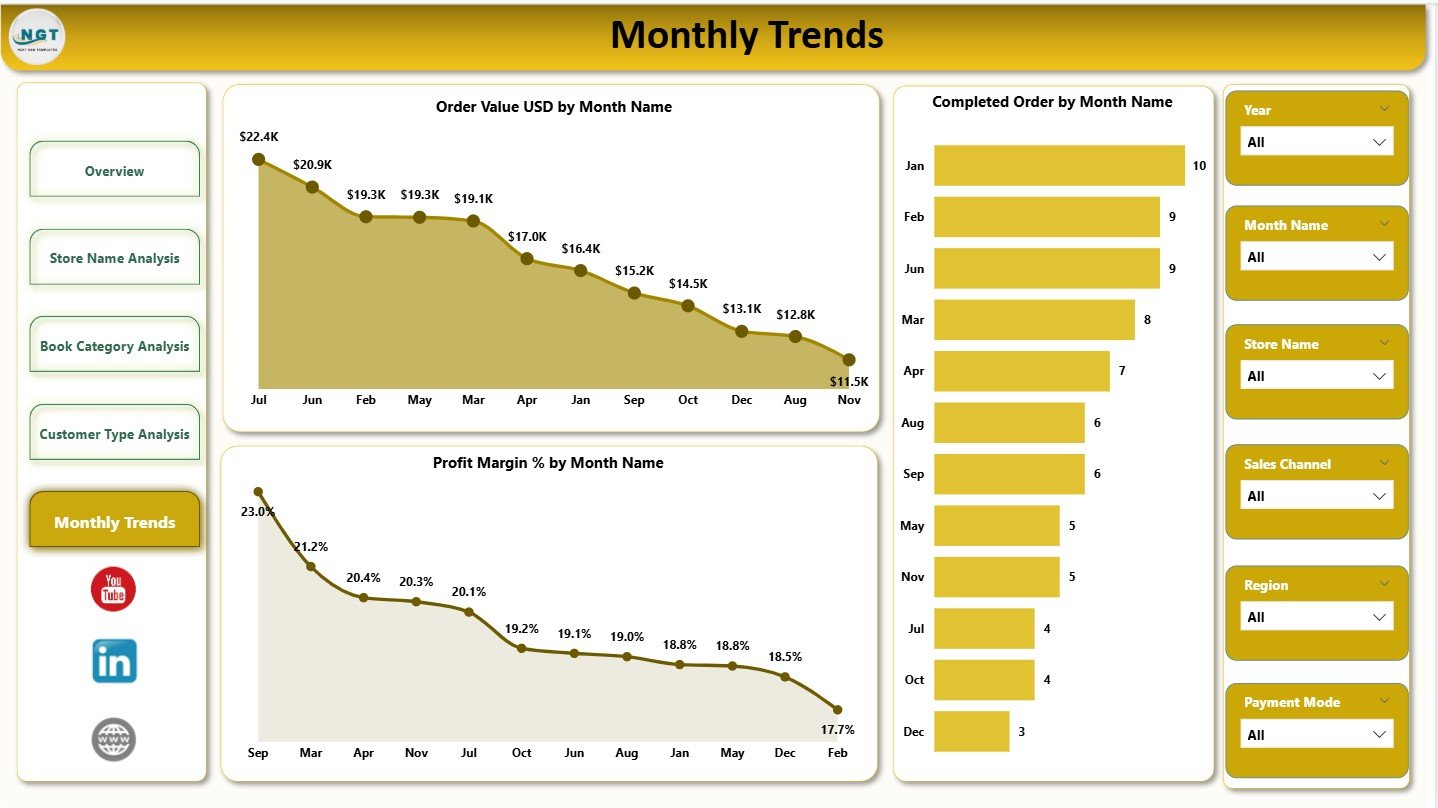
📅 Monthly Trends Page
Tracks performance changes over time using Order Value by Month, Completed Orders by Month, and Profit Margin % by Month, helping stores prepare for seasonal peaks and slowdowns.
🛠️ How to Use the Specialty Bookstores Dashboard
✅ Step 1: Load bookstore sales and transaction data into Power BI
✅ Step 2: Use slicers to select store, category, customer type, or date
✅ Step 3: Review KPI cards for quick performance checks
✅ Step 4: Deep dive into store, category, and customer insights
✅ Step 5: Use monthly trends for planning and forecasting
No advanced Power BI skills are required—this dashboard is ready for everyday retail users.
👥 Who Can Benefit from This Dashboard?
📚 Specialty Bookstore Owners
🏬 Store & Regional Managers
📊 Retail Analytics Teams
💰 Sales & Pricing Teams
⭐ Customer Experience Teams
👔 Senior Retail Leadership
Any bookstore looking to increase profitability, reduce returns, and improve customer satisfaction will benefit from this dashboard.
🔗 Click here to read the Detailed blog post
🎥 Visit our YouTube channel to learn step-by-step video tutorials


Reviews
There are no reviews yet.