Procurement decisions directly impact cost control, supplier reliability, and overall operational efficiency. Yet many procurement teams still rely on manual reports, disconnected spreadsheets, and delayed summaries. As procurement volumes grow, this approach increases cost leakage, delivery delays, and weak supplier accountability.
This is exactly where a Procurement Analytics Dashboard in Excel becomes a powerful competitive advantage.
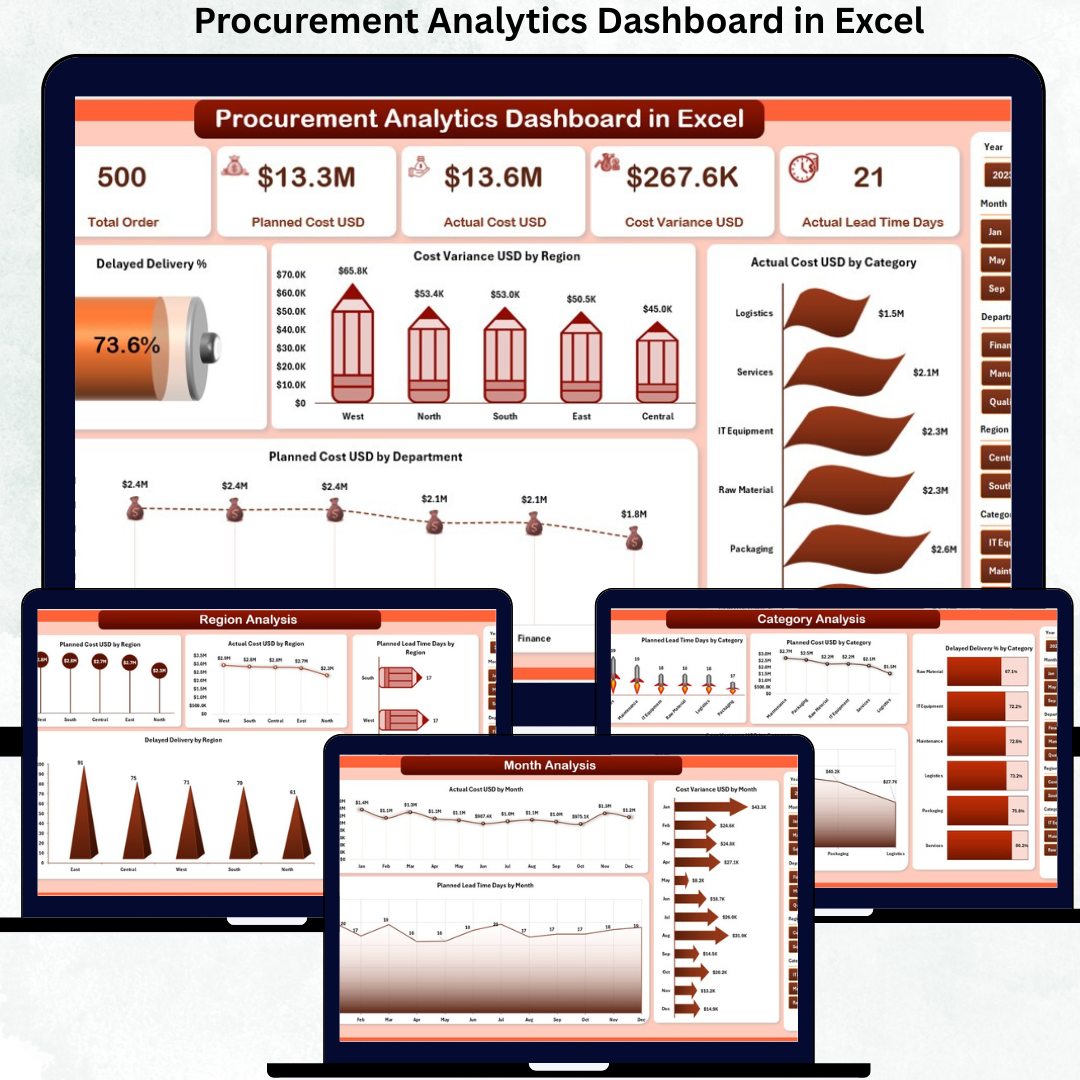
The Procurement Analytics Dashboard in Excel is a ready-to-use, interactive analytics solution designed to provide complete visibility over procurement cost, delivery performance, planning efficiency, and trends—all inside Excel. Instead of reacting to issues after they escalate, procurement teams gain early insights and actionable intelligence.
Built entirely in Excel, this dashboard converts raw procurement data into clear KPIs, visual charts, and slicer-driven analysis. No additional software, coding, or BI tools are required, making it easy to adopt for teams of any size.
✨ Key Features of the Procurement Analytics Dashboard in Excel
This dashboard includes five structured analytical pages, each answering a critical procurement question.
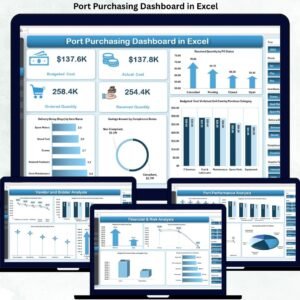
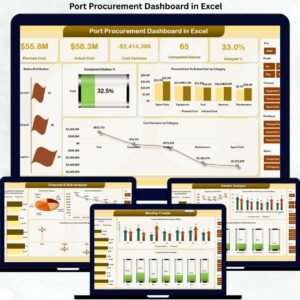
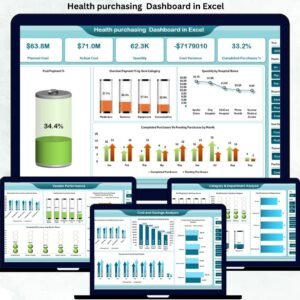
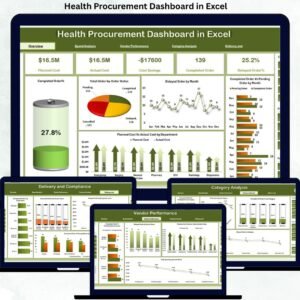
⭐ Overview Page – Complete Procurement Snapshot
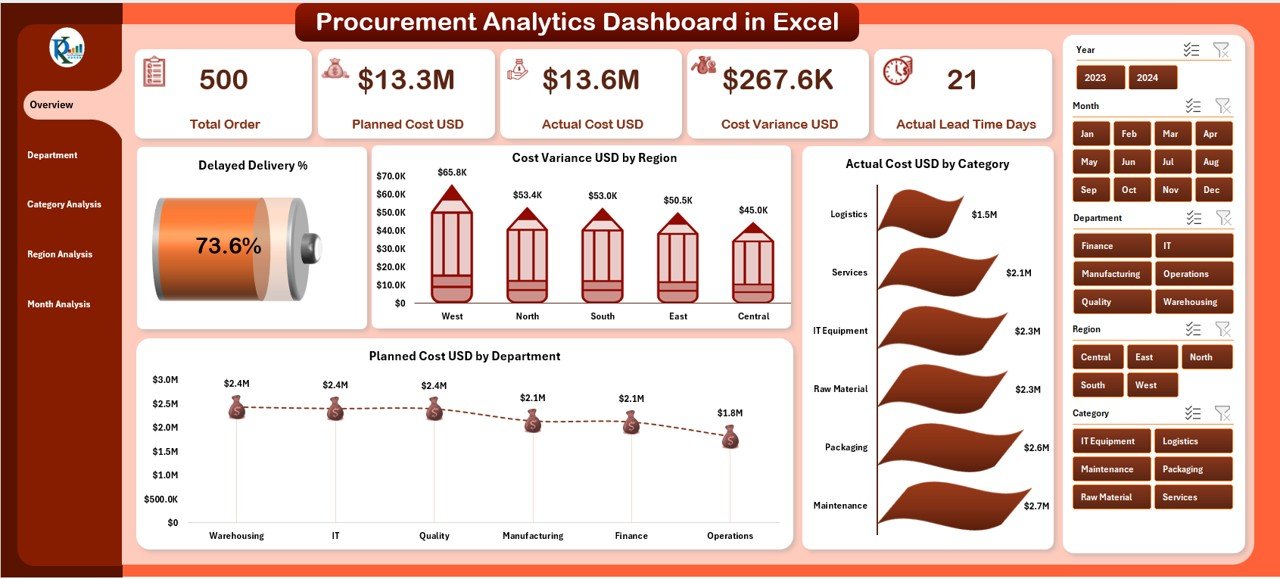
✔ Five KPI cards highlighting key performance metrics
✔ Right-side slicers for instant filtering
✔ High-impact charts including:
-
Delayed Delivery %
-
Cost Variance USD by Region
-
Actual Cost USD by Category
-
Planned Cost USD by Department
This page serves as the command center, helping leadership instantly spot cost overruns and delivery risks.
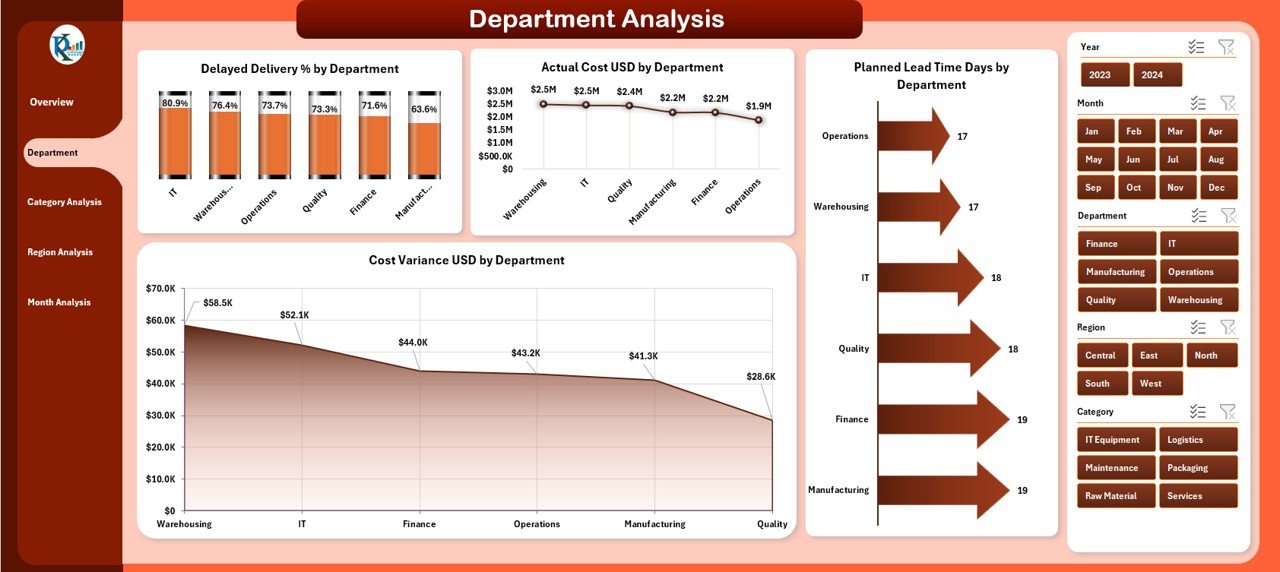
⭐ Department Analysis – Performance by Department
✔ Delayed Delivery % by Department
✔ Cost Variance USD by Department
✔ Actual Cost USD by Department
✔ Planned Lead Time Days by Department
With this view, organizations identify departments that require process correction or better planning discipline.
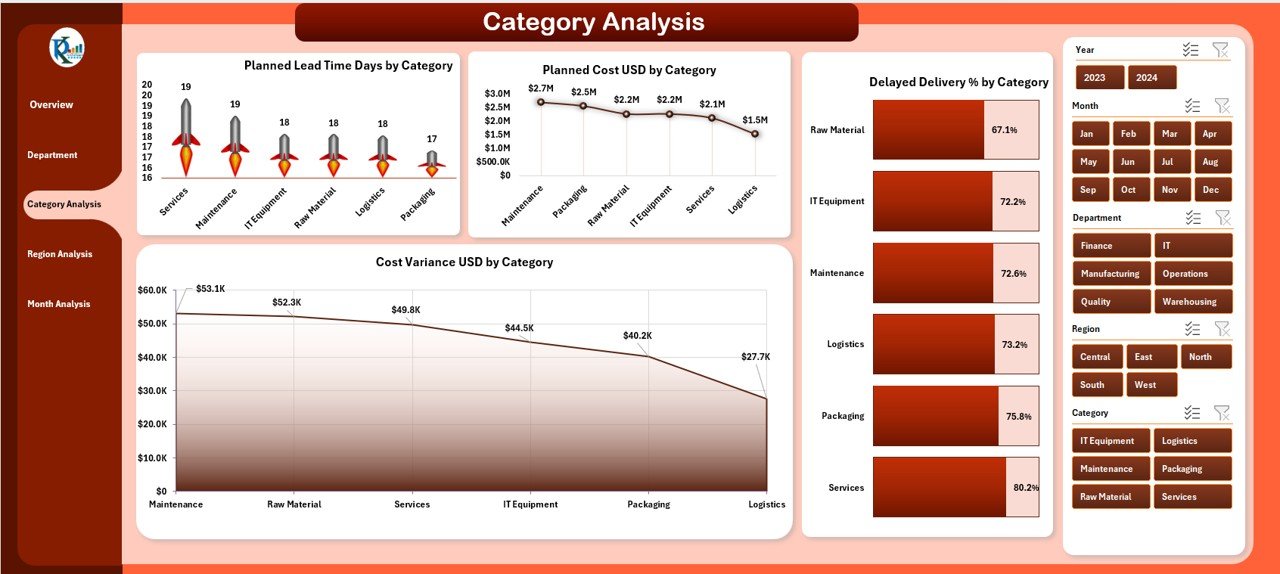
⭐ Category Analysis – Cost & Delivery Insights
✔ Planned Lead Time Days by Category
✔ Planned Cost USD by Category
✔ Delayed Delivery % by Category
✔ Cost Variance USD by Category
This page strengthens strategic sourcing and contract negotiations by revealing category-level inefficiencies.
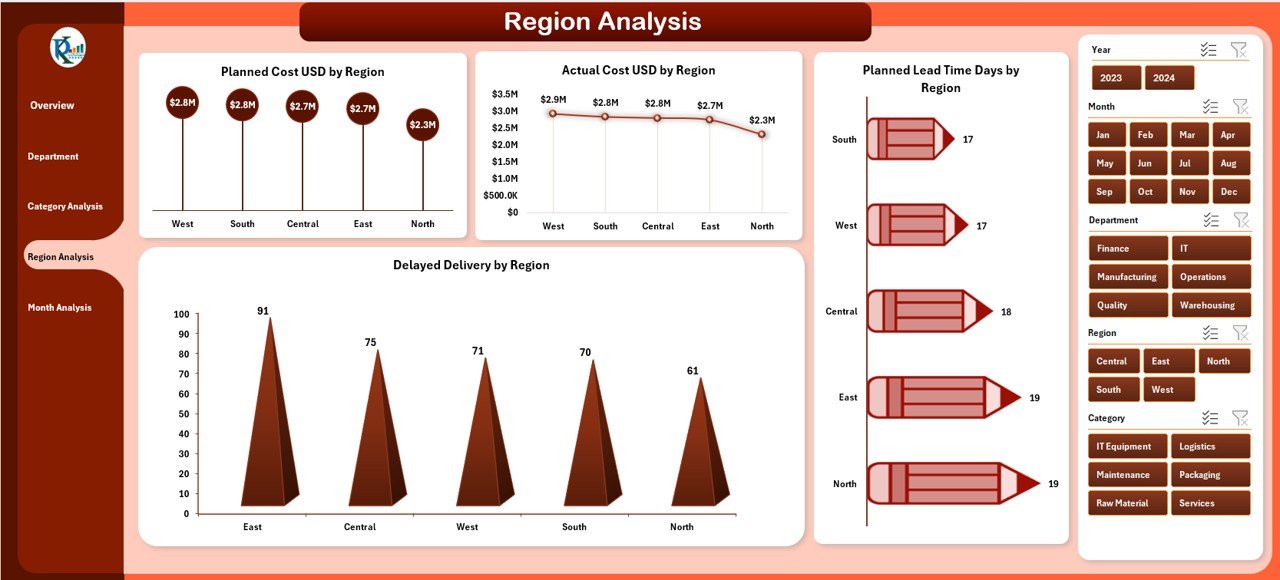
⭐ Region Analysis – Geographic Performance Visibility
✔ Planned Lead Time Days by Region
✔ Planned Cost USD by Region
✔ Delayed Delivery % by Region
✔ Actual Cost USD by Region
Procurement leaders compare regional performance and detect logistics or supplier issues specific to locations.
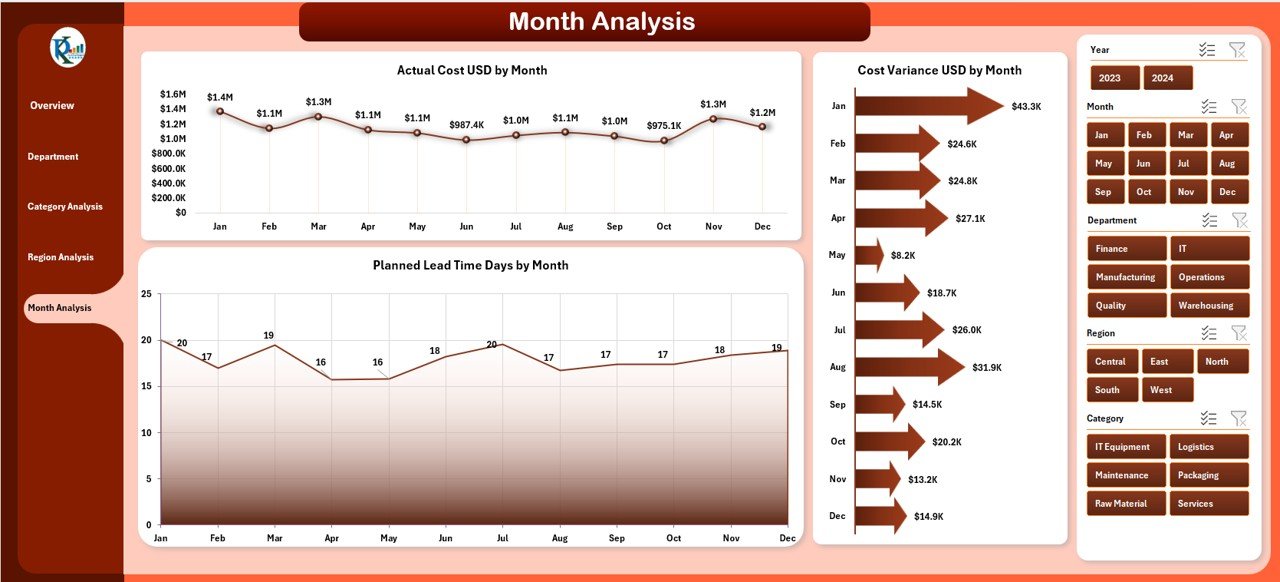
⭐ Month Analysis – Trend & Forecasting Insights
✔ Planned Lead Time Days by Month
✔ Actual Cost USD by Month
✔ Cost Variance USD by Month
Trend analysis helps teams detect seasonal spikes, forecast demand, and plan future budgets more accurately.
📦 What’s Inside the Procurement Analytics Dashboard
When you download this product, you get:
✅ Ready-to-use Excel dashboard file
✅ Five fully interactive analysis pages
✅ KPI cards with visual clarity
✅ Right-side slicers for fast filtering
✅ Clean, professional dashboard design
✅ Scalable structure for growing data
Simply update the Data Sheet, and the entire dashboard refreshes automatically.
🛠️ How to Use the Procurement Analytics Dashboard
1️⃣ Enter or update procurement data in the Data Sheet
2️⃣ Open the dashboard sheet
3️⃣ Use slicers to filter by department, category, region, or month
4️⃣ Review KPIs and charts instantly
5️⃣ Identify delays, cost variance, and planning gaps
6️⃣ Share insights with stakeholders
No advanced Excel expertise is required.
👥 Who Can Benefit from This Procurement Analytics Dashboard
This dashboard is ideal for:
✔ Procurement Managers
✔ Supply Chain Leaders
✔ Finance Teams
✔ Operations Managers
✔ Manufacturing & Service Organizations
✔ Retail & Distribution Companies
Any organization managing suppliers, budgets, and delivery timelines will benefit immediately.
### 📘 Click here to read the Detailed blog post
🎥 Visit our YouTube channel to learn step-by-step video tutorials
👉 Youtube.com/@PKAnExcelExpert


Reviews
There are no reviews yet.