Managing ophthalmology services demands accuracy, speed, and continuous performance tracking. Eye hospitals and clinics handle large volumes of patients, surgeries, diagnostics, consultations, and resources daily. Yet, when this data lives in scattered spreadsheets, identifying performance gaps and improving service quality becomes difficult and time-consuming.
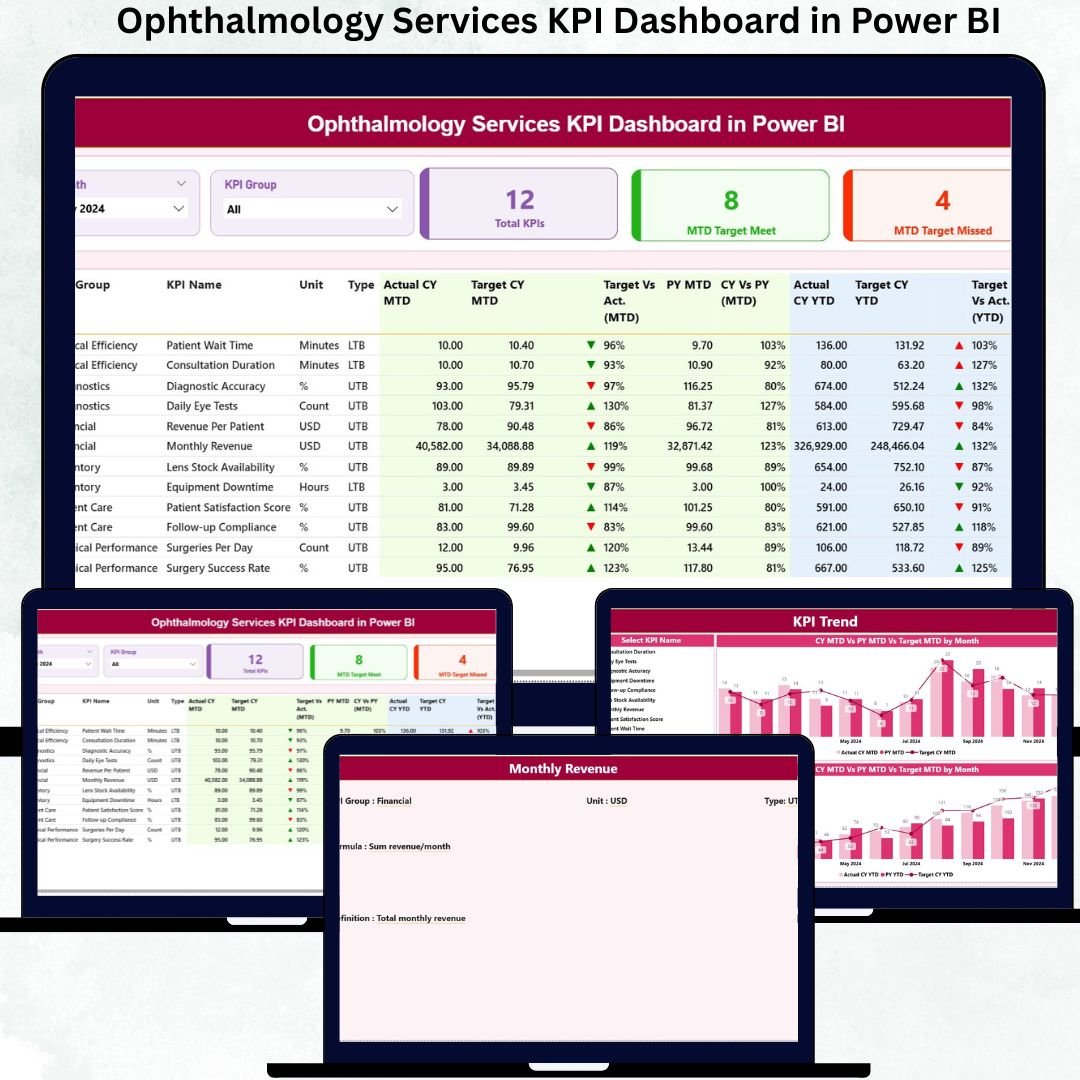
The Ophthalmology Services KPI Dashboard in Power BI solves this challenge by transforming raw clinical and operational data into clear, interactive, and insight-driven visuals. Ophthalmology Services KPI Dashboard in Power BI This ready-to-use dashboard allows healthcare leaders to monitor targets, actual performance, and trends from one unified platform. By combining Excel-based data input with Power BI analytics, the dashboard delivers flexibility, transparency, and analytical power without complexity.
With this dashboard, ophthalmology organizations move from reactive reporting to proactive, data-driven healthcare management—improving both patient care and operational efficiency.
🚀 Key Features of the Ophthalmology Services KPI Dashboard in Power BI
👁️ Centralized Ophthalmology KPI Tracking – Monitor all service KPIs in one dashboard
🎯 MTD & YTD Performance Monitoring – Track monthly and yearly service outcomes clearly
✅ Target Achievement Indicators – Instantly identify met and missed KPIs
📊 Actual vs Target vs Previous Year Comparison – Measure real performance objectively
🎛️ Interactive Month & KPI Group Slicers – Focus analysis instantly
📈 Trend Analysis Charts – Understand service performance over time
🔍 Drill-Through KPI Definitions – View KPI logic, formula, and meaning
⚡ Excel + Power BI Model – Simple updates with powerful analytics
📦 What’s Inside the Ophthalmology Services KPI Dashboard
This dashboard includes three carefully designed analytical pages, each serving a specific purpose:
🟢 Summary Page
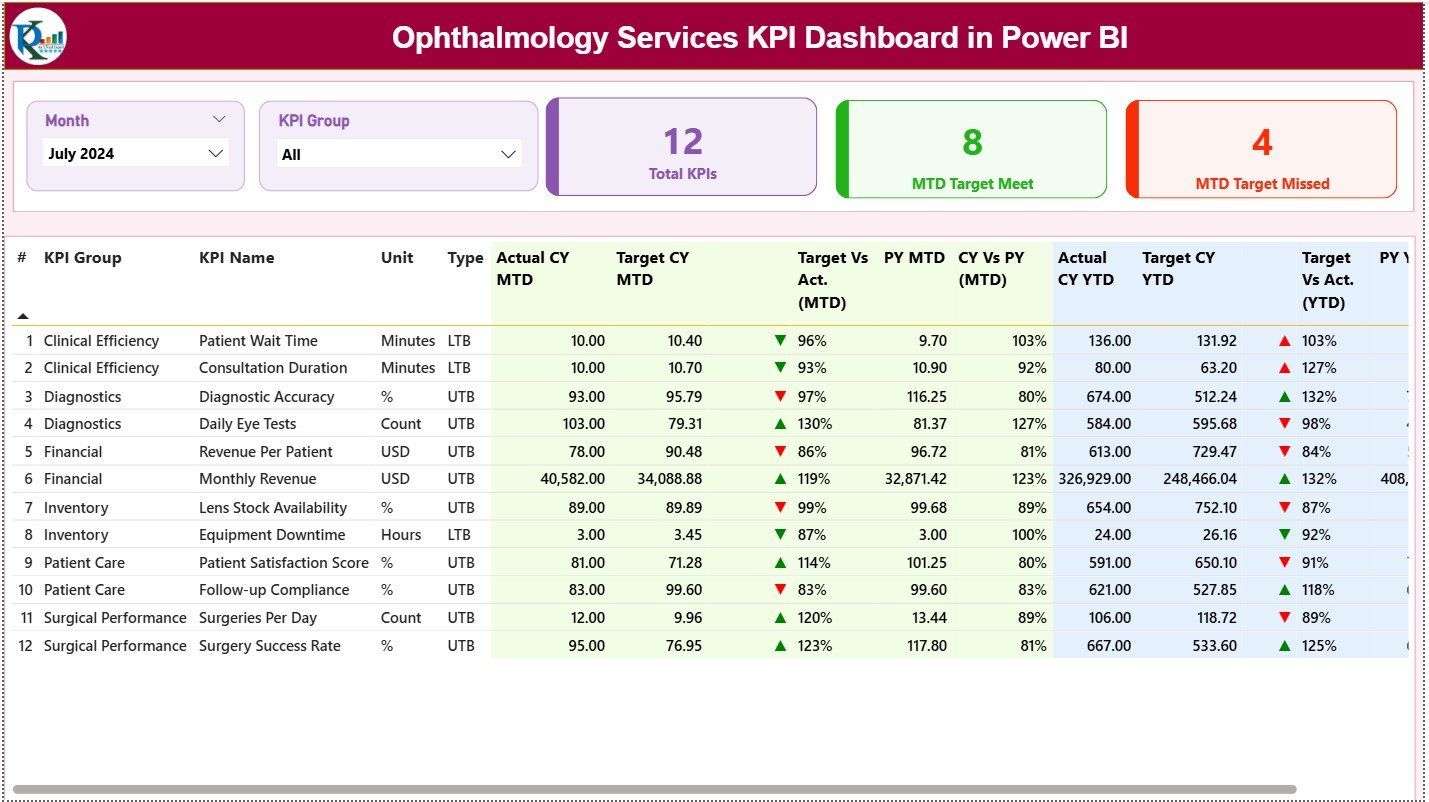
The main overview of ophthalmology service performance. It displays KPI cards for Total KPIs, MTD Target Met, and MTD Target Missed. A detailed performance table shows MTD and YTD Actuals, Targets, Previous Year values, and performance indicators—giving instant clarity on service efficiency and gaps.
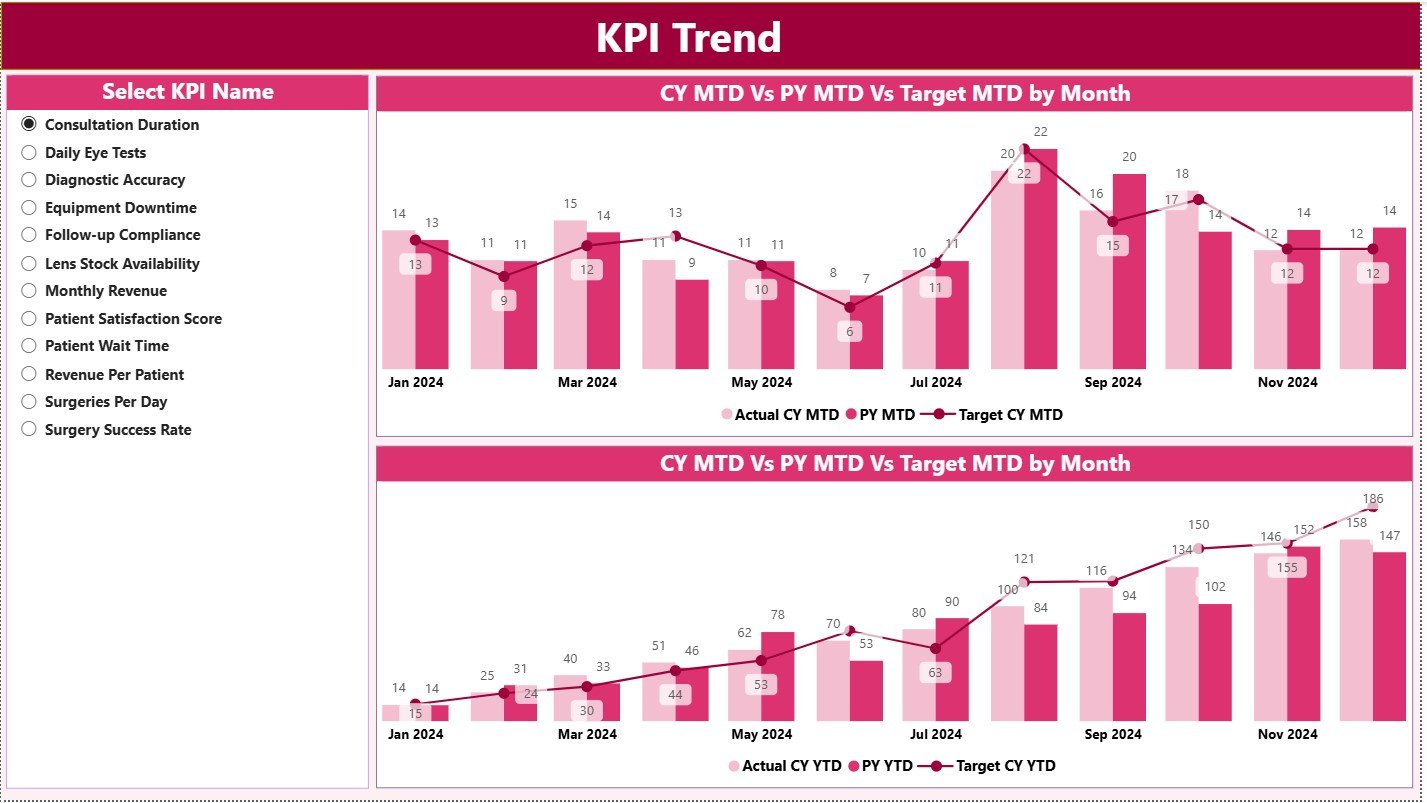
📉 KPI Trend Page
Designed for historical and trend-based analysis. Users select a specific KPI to instantly view MTD and YTD combo charts comparing Actual, Target, and Previous Year values. This page highlights improvement patterns, seasonality, and consistency.
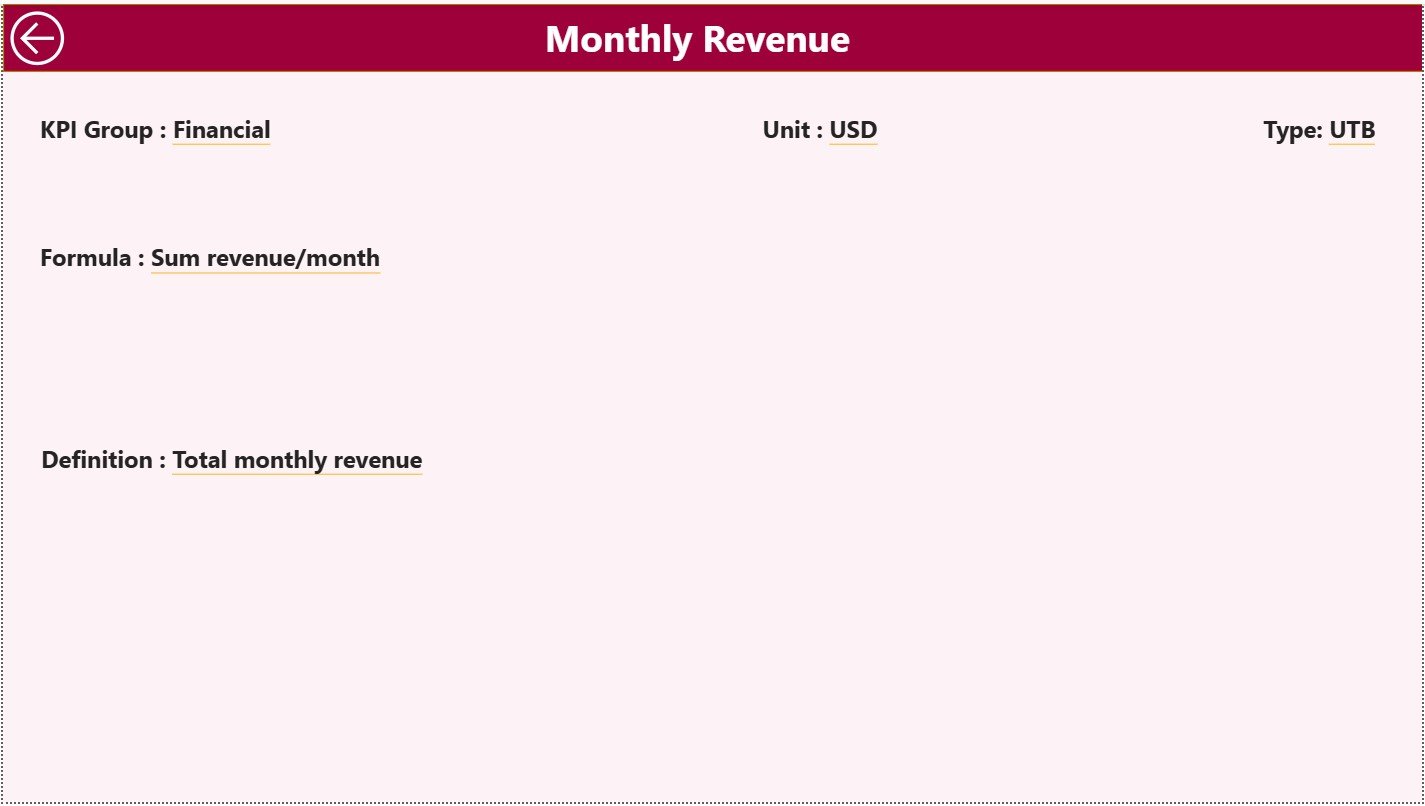
📘 KPI Definition Page
A drill-through transparency page that explains KPI logic. It displays KPI Formula, Definition, and Interpretation, ensuring alignment across clinical and administrative teams. A back button ensures smooth navigation.
The dashboard uses three structured Excel sheets:
-
Input Actual – MTD and YTD actual values
-
Input Target – Performance targets and benchmarks
-
KPI Definition – KPI structure, type (LTB/UTB), and logic
🛠️ How to Use the Ophthalmology Services KPI Dashboard
✅ Step 1: Enter actual performance values in the Input Actual Excel sheet
✅ Step 2: Maintain performance targets in the Input Target sheet
✅ Step 3: Define or update KPIs in the KPI Definition sheet
✅ Step 4: Refresh the Power BI dashboard
✅ Step 5: Analyze KPIs using slicers, tables, and trend charts
No advanced Power BI skills are required. The dashboard is plug-and-play and healthcare-friendly.
👥 Who Can Benefit from This Ophthalmology Dashboard?
🏥 Ophthalmology Clinic Managers
🏨 Hospital Administrators
👩⚕️ Clinical Operations Teams
✅ Quality & Compliance Teams
📊 Healthcare Analysts
👔 Senior Leadership & Management
Any eye-care organization seeking better visibility, quality control, and operational efficiency will gain immediate value.
🔗 Click here to read the Detailed blog post
🎥 Visit our YouTube channel to learn step-by-step video tutorials


Reviews
There are no reviews yet.