In today’s ultra-dynamic financial markets, stock exchanges operate under constant pressure to deliver accuracy, transparency, and speed. Massive volumes of transactional and operational data flow in every day. However, raw data alone does not support smart decision-making. What truly matters is how effectively that data converts into actionable insights. That is exactly where the Stock Exchanges KPI Dashboard in Power BI delivers unmatched value.
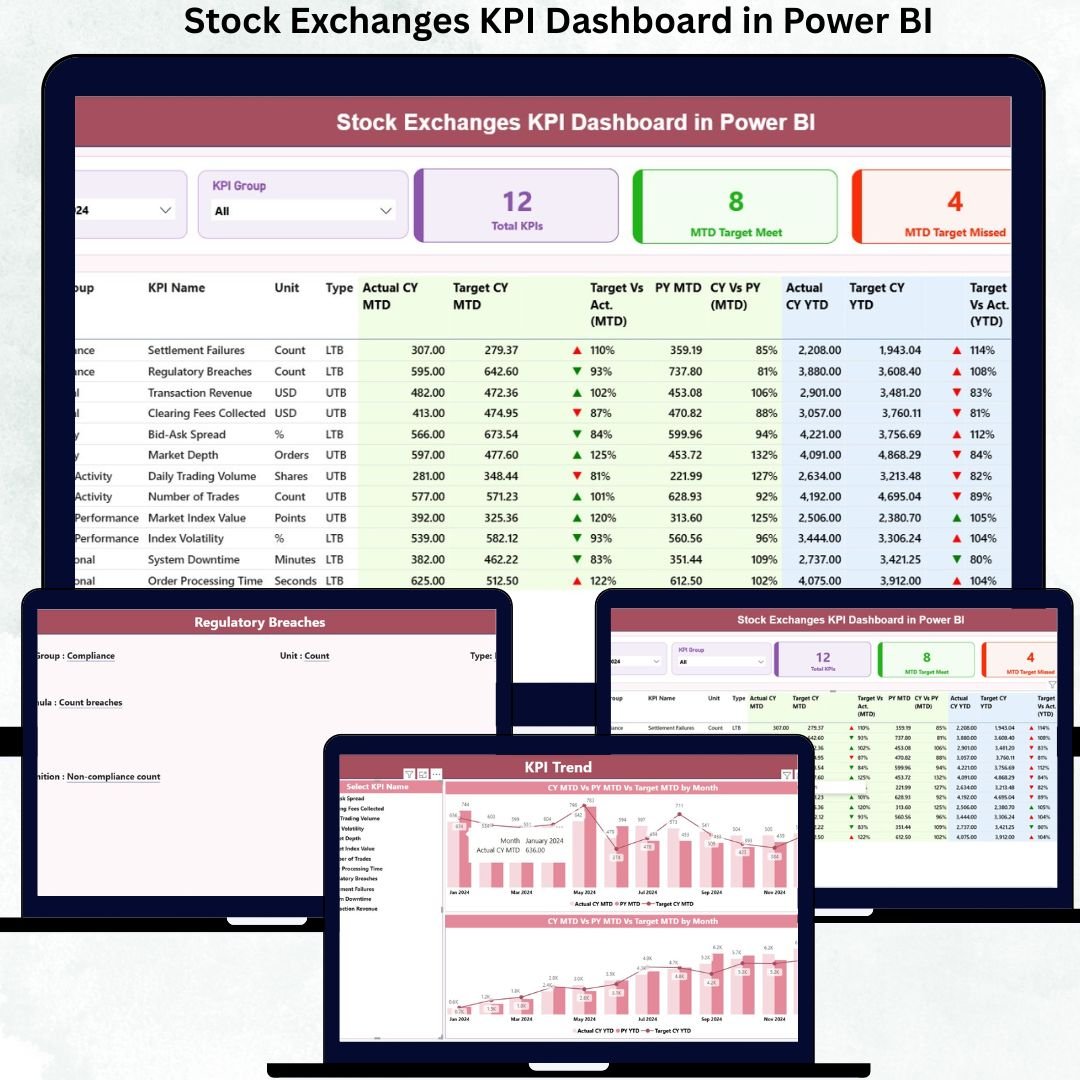
The Stock Exchanges KPI Dashboard in Power BI is a ready-to-use, professionally designed analytical solution built specifically for monitoring and evaluating stock exchange performance. Instead of working with disconnected Excel files, static reports, and manual calculations, this dashboard consolidates all critical KPIs into a single, interactive Power BI environment powered by structured Excel inputs.
Because the dashboard uses Excel as the data source and Power BI for visualization, it strikes the perfect balance between simplicity and analytical power. You simply update monthly actuals and targets in Excel, refresh Power BI, and instantly unlock updated performance insights—without coding or technical complexity.
This dashboard acts not just as a reporting tool, but as a strategic performance management system that helps leadership teams stay proactive, compliant, and data-driven at all times.
✅ Key Features of Stock Exchanges KPI Dashboard in Power BI
(H2)
🚀 Centralized KPI Monitoring
Track all stock exchange KPIs in one unified Power BI dashboard for complete visibility.
📅 MTD & YTD Performance Tracking
Analyze Month-to-Date and Year-to-Date performance instantly for better control.
🎯 Target vs Actual Analysis
Identify KPI achievements and shortfalls using automated percentage variance and icons.
📊 Previous Year Benchmarking
Measure growth and decline trends with CY vs PY comparisons.
🔍 Interactive Filters & Slicers
Slice performance by Month and KPI Group for focused analysis.
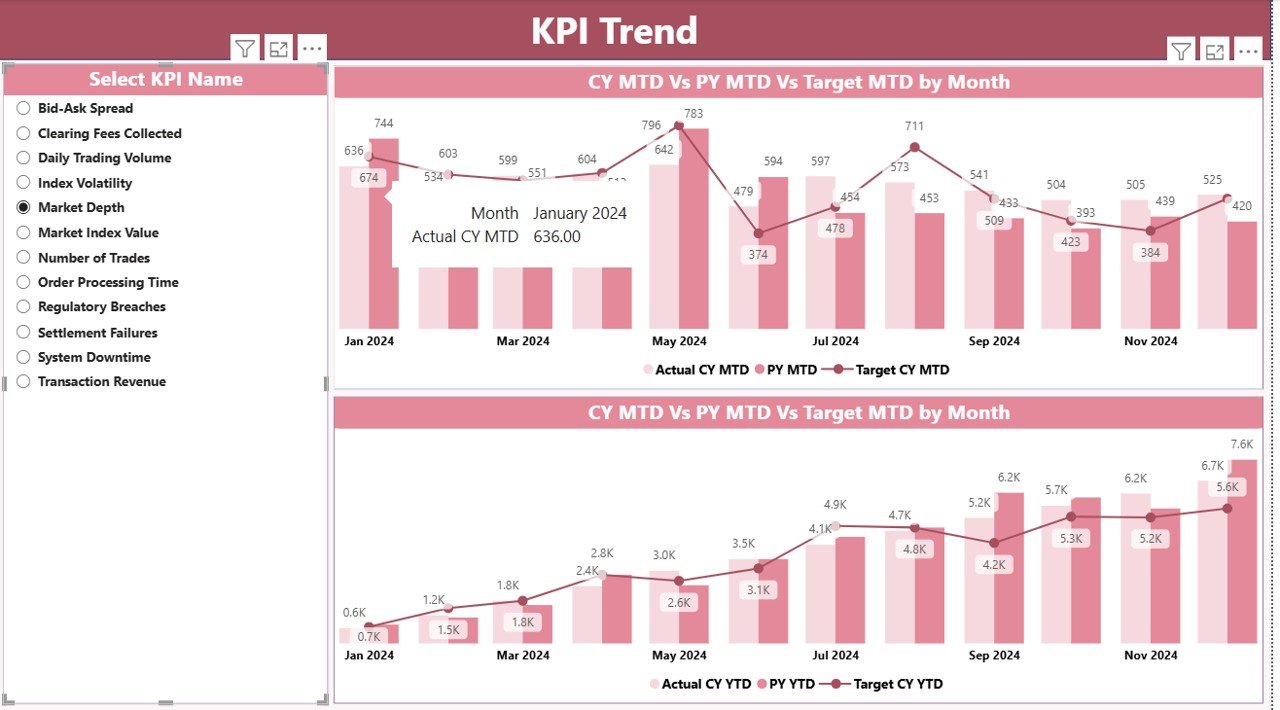
📈 Trend Analysis Page
View historical performance patterns using pre-built combo charts.
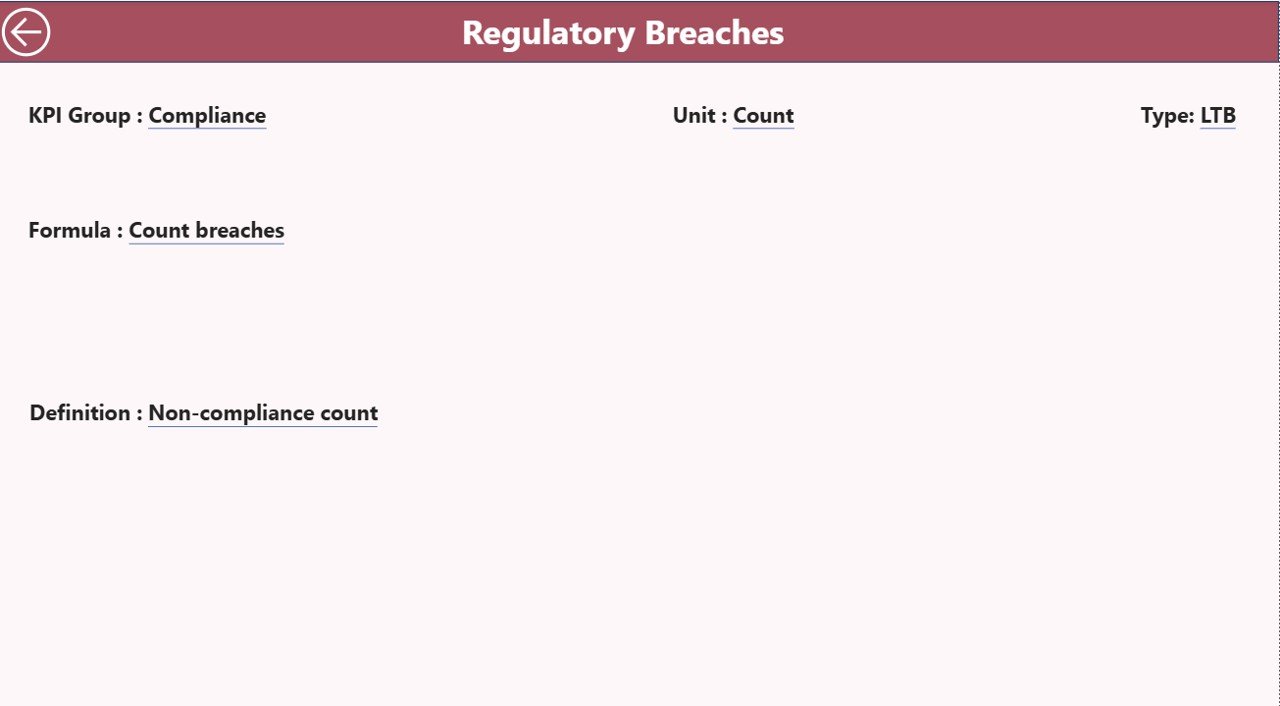
🧠 KPI Definition Governance
Maintain a single source of truth for KPI definitions, formulas, and types.
📦 What’s Inside the Stock Exchanges KPI Dashboard in Power BI
(H2)
This digital product includes a professionally structured Power BI file supported by organized Excel sheets:
📌 Power BI Dashboard (PBIX File)
-
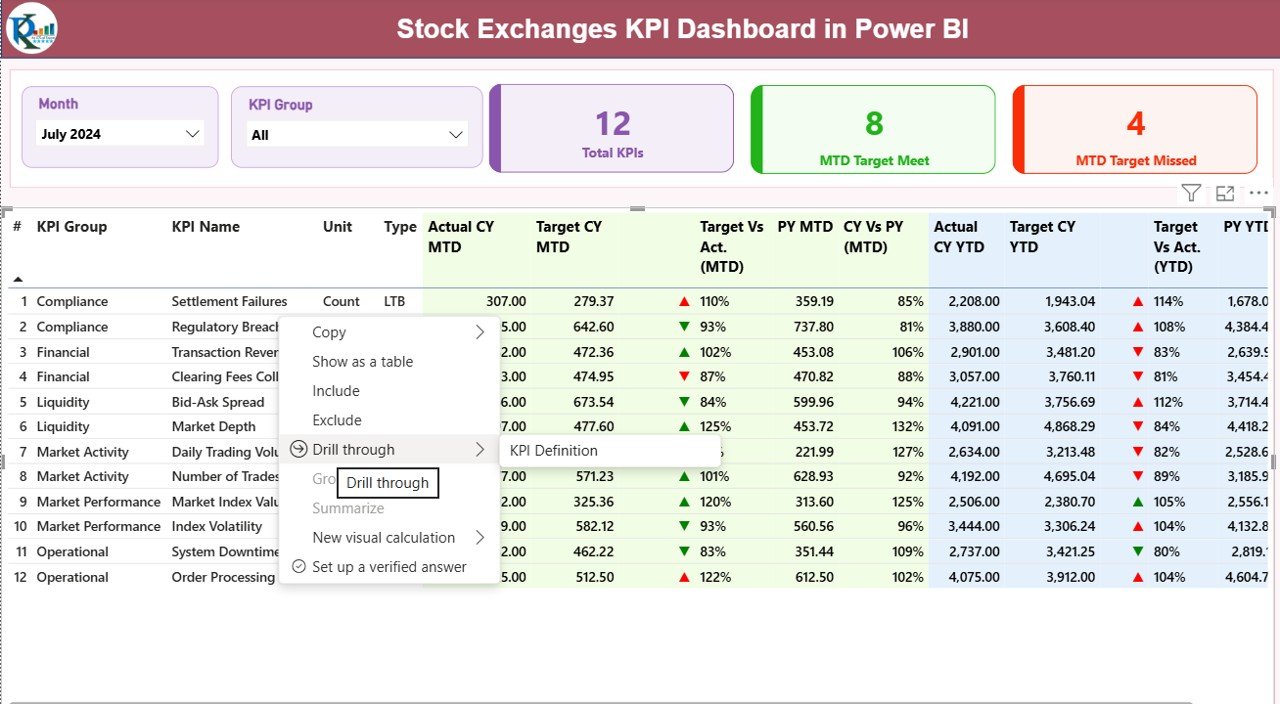
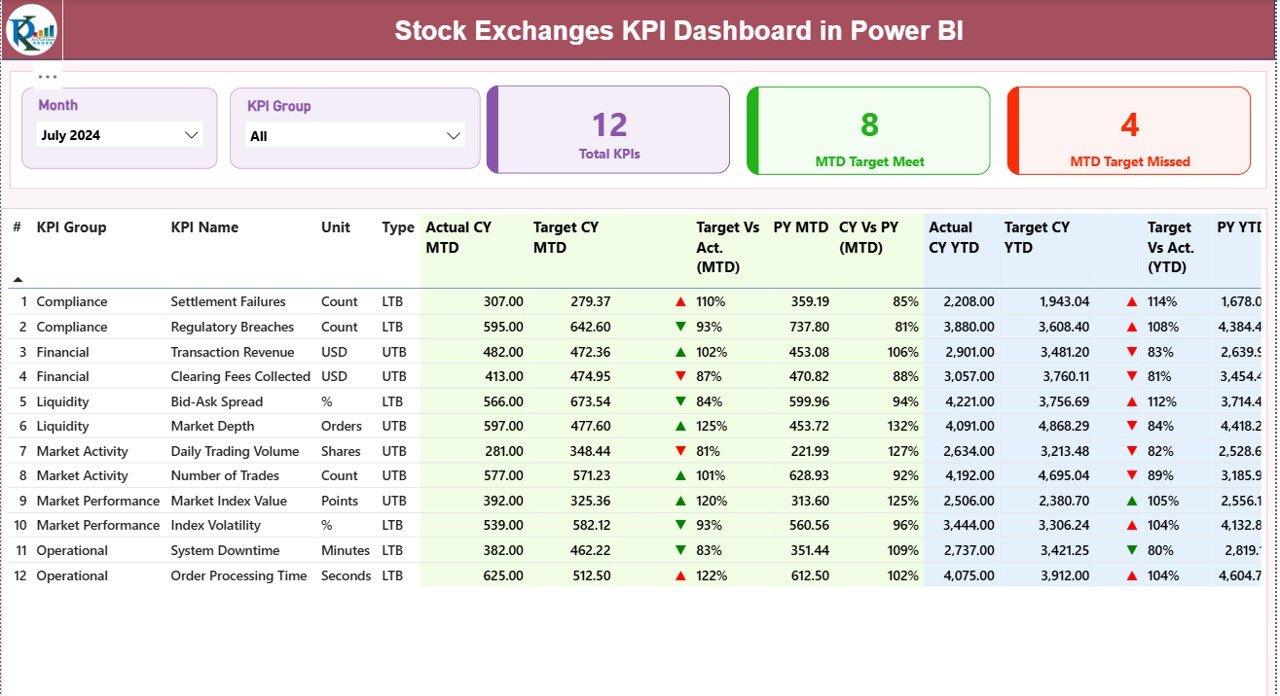
Summary Page with KPI cards and detailed KPI table
-
KPI Trend Page showing performance trends
-
KPI Definition Page for governance and clarity
📘 Excel Data Source File
-
Input_Actual Sheet for entering MTD and YTD actual values
-
Input_Target Sheet for defining monthly and yearly targets
-
KPI Definition Sheet to manage KPI logic and metadata
All calculations, measures, icons, and visuals are already pre-built, saving hours of manual work.
⚙️ How to Use the Stock Exchanges KPI Dashboard in Power BI
(H2)
Using this dashboard is simple and user-friendly:
1️⃣ Update performance data in the Excel Input_Actual and Input_Target sheets
2️⃣ Refresh the Power BI file with one click
3️⃣ Use filters to analyze KPIs by month and group
4️⃣ Review KPI cards for quick performance health
5️⃣ Drill into trends and definitions for deeper insights
No advanced Power BI knowledge is required. If you can use Excel, you can use this dashboard.
👥 Who Can Benefit from This Stock Exchanges KPI Dashboard in Power BI
(H2)
This dashboard is ideal for a wide range of financial professionals:
🏦 Stock Exchange Management Teams
📜 Regulatory & Compliance Departments
📊 Market Operations Teams
📈 Financial Analysts & Researchers
🧭 Strategy & Governance Leaders
💼 Financial Institutions & Brokerage Firms
Whether managing a large exchange or a specialized financial operation, this dashboard adapts to your needs.
🔗 Click here to read the Detailed Blog Post
Watch the step-by-step video tutorial:
🎥 Visit our YouTube channel to learn step-by-step video tutorials:
👉 YouTube.com/@PKAnExcelExpert


Reviews
There are no reviews yet.