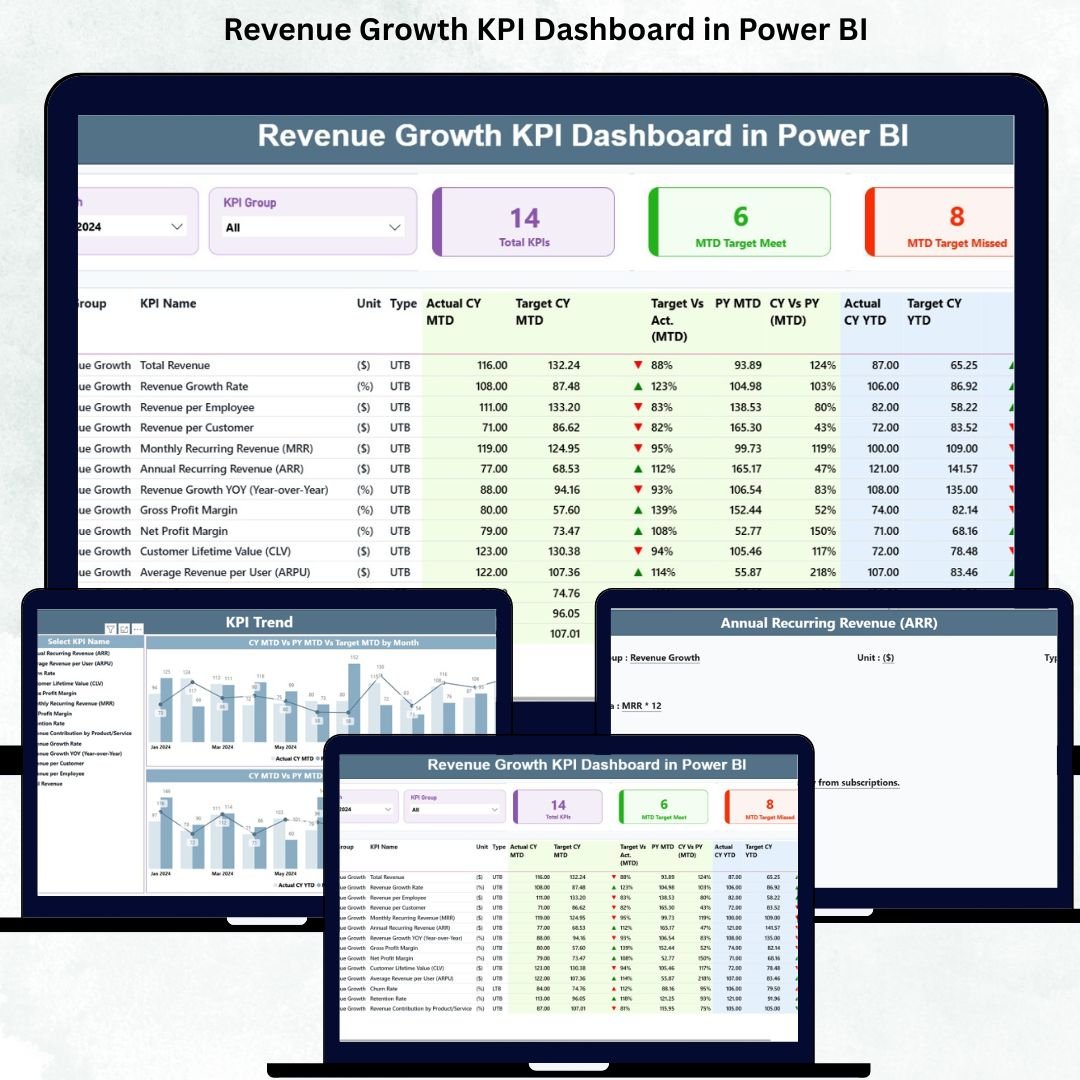
Every business wants to grow revenue, improve performance, and understand what truly drives results. But when monthly sales change, customer behaviour shifts, and teams run multiple campaigns at once, it becomes difficult to track everything manually. Leaders need real-time clarity—not multiple Excel files, not long reports—just one clean dashboard that shows everything instantly.
This is exactly where the Revenue Growth KPI Dashboard in Power BI becomes a game-changing tool for any organization.
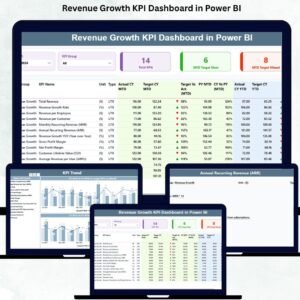
This ready-to-use Power BI dashboard converts raw revenue data into clear, interactive visuals. It helps teams track MTD progress, YTD numbers, targets, variance, and previous year comparisons in a single place. With powerful slicers, dynamic charts, drill-through pages, and auto-calculated KPIs, this dashboard becomes a complete command center for business growth.
Designed for CEOs, Sales Heads, Finance Managers, Marketing Teams, and Decision Makers—this dashboard gives you the insights you need to improve your performance faster, smarter, and with complete confidence.
🚀 Key Features of the Revenue Growth KPI Dashboard in Power BI
Below is a full breakdown of the dashboard, its structure, and how each part supports revenue acceleration.
⭐ Summary Page – Your Main Performance Hub
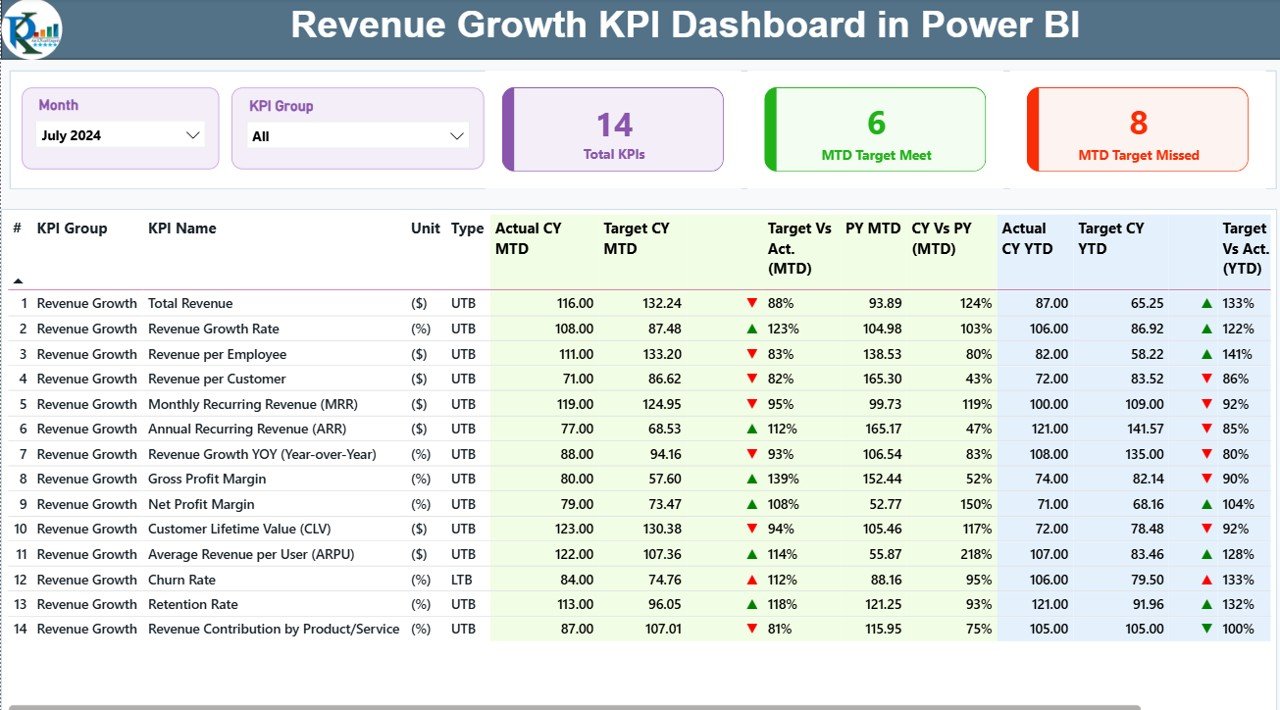
The Summary Page is the heart of this dashboard. It displays all KPIs in a single view along with smart slicers and auto-updating visuals.
🔹 Smart Slicers (Top Section)
Users can dynamically filter the dashboard by:
-
Month – View monthly performance instantly
-
KPI Group – Filter KPIs for Sales, Operations, Finance, Marketing, or Revenue
These slicers refresh the entire dashboard in real time.
🔹 KPI Cards for Quick Health Check
You get three powerful KPI Cards:
-
Total KPIs Count
-
MTD Target Met Count
-
MTD Target Missed Count
These cards give a clear summary of overall performance.
🔹 Detailed KPI Table – Full Revenue Intelligence
This KPI table is the backbone of the Summary Page. It includes:
-
KPI Number
-
KPI Group
-
KPI Name
-
Unit (%, $, Units, Nos.)
-
KPI Type (UTB – Upper the Better / LTB – Lower the Better)
-
Actual CY MTD
-
Target CY MTD
-
MTD Icon (▲ / ▼)
-
Target vs Actual (MTD)
-
Previous Year (PY MTD)
-
CY vs PY (MTD)
-
Actual CY YTD
-
Target CY YTD
-
YTD Icon (▲ / ▼)
-
Target vs Actual (YTD)
-
PY YTD
-
CY vs PY (YTD)
This table makes it extremely easy to identify KPIs that are on track, those that are missing targets, and those that need immediate attention.
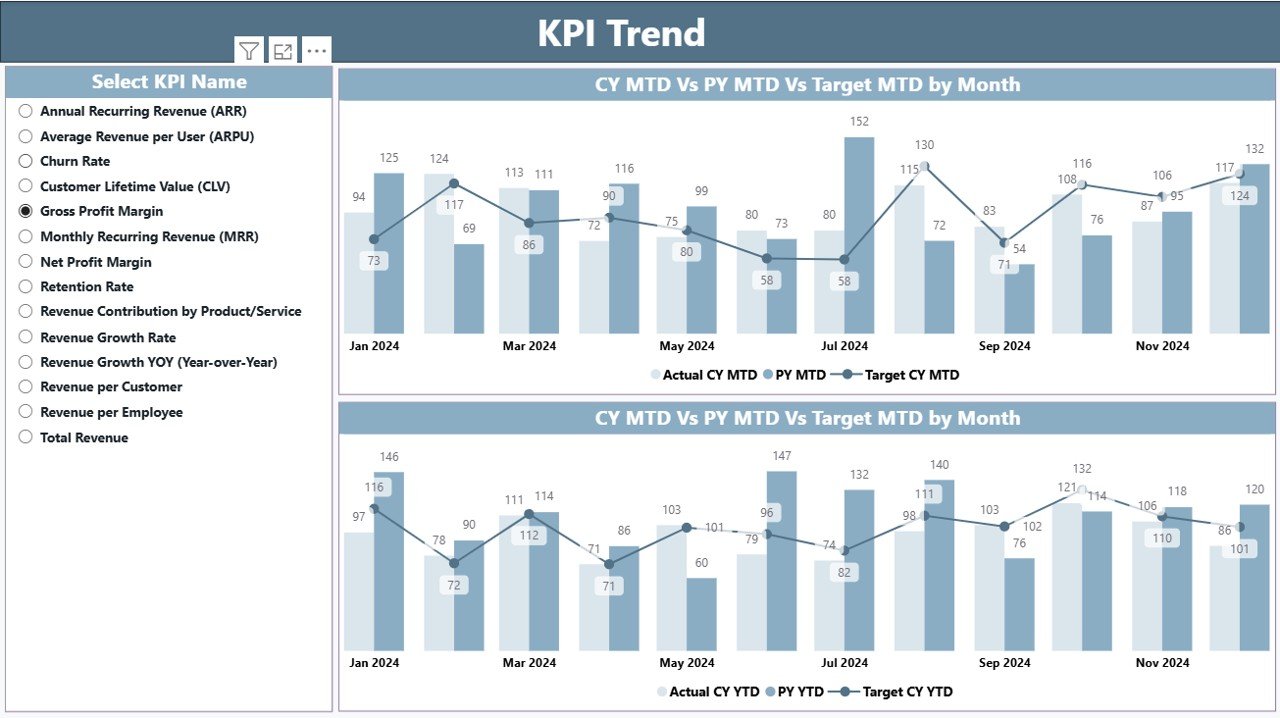
⭐ KPI Trend Page – Track Growth Month-by-Month
The KPI Trend Page helps teams understand long-term performance patterns.
🔹 KPI Name Slicer
Select any KPI to track its monthly trend.
🔹 Two Combo Charts
Powerful trend visuals show:
-
Current Year Actuals
-
Target Values
-
Previous Year Actuals
These charts are available for:
-
MTD Trend
-
YTD Trend
With these visuals, users can see if performance is improving, stable, or declining—helping teams take timely corrective actions.
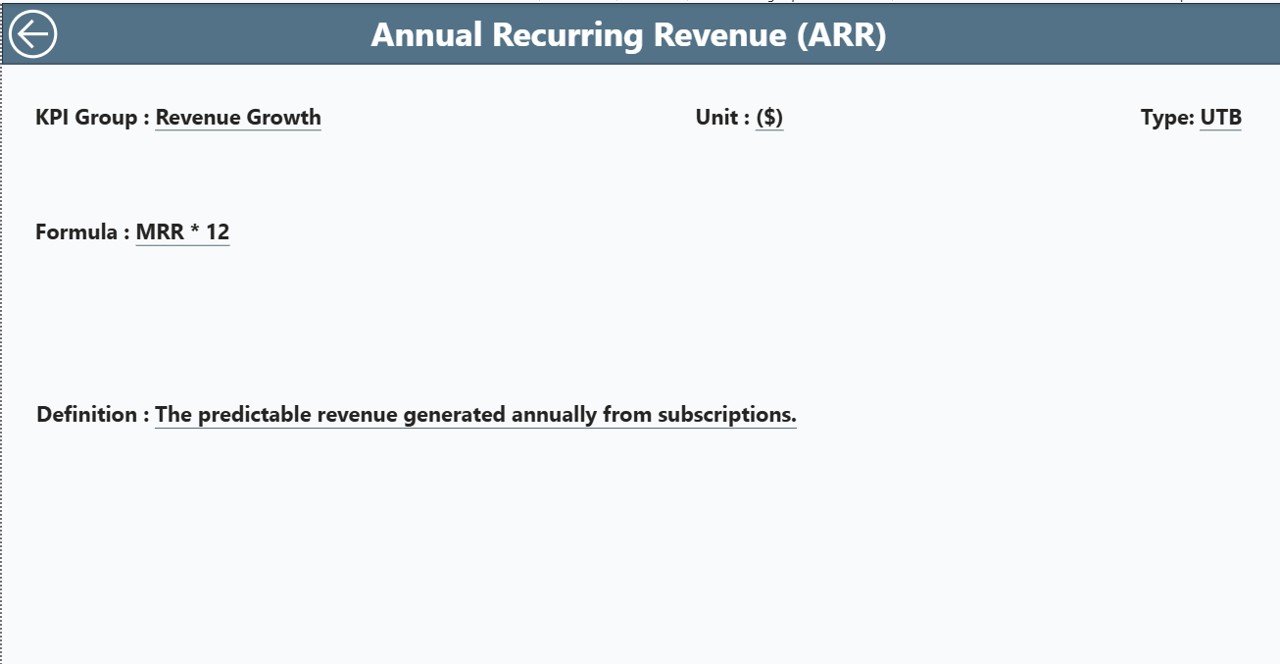
⭐ KPI Definition Page – Deep KPI Understanding
This hidden page opens through drill-through options on the KPI table.
It includes:
-
KPI Number
-
KPI Group
-
KPI Name
-
Unit
-
Formula
-
KPI Definition
-
KPI Type (LTB / UTB)
This page is extremely helpful for new users and ensures complete transparency across teams.
📦 What’s Inside the Dashboard?
-
3 powerful, interactive Power BI pages
-
Dynamic slicers for smooth filtering
-
Auto-calculated icons, variance, and comparisons
-
Drill-through capability
-
Clean layout for fast navigation
-
Fully structured Excel-based data source
-
Professional visuals designed for decision makers
🎯 Who Can Benefit from This Dashboard?
-
CEOs & Founders
-
Sales Directors & Sales Teams
-
Finance Departments
-
Marketing Teams
-
Business Analysts
-
Operations Managers
-
Strategy & Planning Teams
Any business that wants to grow revenue faster will benefit from this dashboard.
💡 How to Use the Revenue Growth Dashboard in Power BI
-
Enter Actual MTD/YTD values in the Input_Actual sheet
-
Enter MTD/YTD target values in Input_Target
-
Maintain KPI Definitions in KPI Definition sheet
-
Refresh Power BI to update all visuals
-
Use slicers to filter insights
-
Track trends using the Trend Page
-
Drill-through to understand KPI definitions
-
Compare CY vs PY to measure true growth
Even non-technical users can operate this dashboard easily.
### Click here to read the detailed blog post
📺 Visit our YouTube channel to learn step-by-step video tutorials
👉 youtube.com/@PKAnExcelExpert


Reviews
There are no reviews yet.